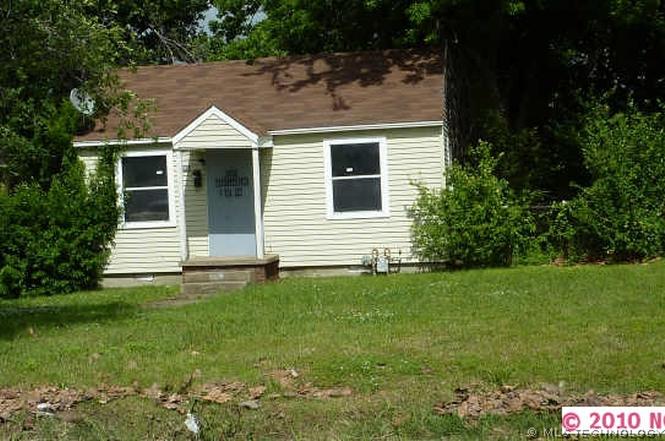
1331 N Olympia Ave · Tulsa, OK
Flood risk 1/10 · Minimal
- FEMA flood zone
- X (unshaded)
- Chance of flooding over 30 yrs
- 0.0%
- Est. flood insurance / yr
- $507 – $1,088
Fire risk 5/10 · Moderate
- Est. fire insurance / yr
- $2,463 – $4,575
Heat risk 6/10 · Moderate
- Hot days now (above 110°F)
- 7 days/yr
- Hot days in 30 yrs
- 17 days/yr
Wind risk 3/10 · Minor
- Chance of severe wind over 30 yrs
- 4.0%
Air-quality risk 2/10 · Minimal
- Unhealthy air days now
- 2 days/yr
- Unhealthy air days in 30 yrs
- 2 days/yr
Risk factors via First Street. Map © Google.
Why this score? — see what drove the B+ grade
The composite is a weighted blend of 9 inputs, each scored 0–100. Each bar is that input's sub-score; the figure is the points it added to the 100-point composite (weight × sub-score).
- Cash flow +30.0/30.0
- ARV discount +15.0/15.0
- 1% rule +10.0/10.0
- DSCR +10.0/10.0
- Livability +3.8/5.0
- Rent growth +3.1/5.0
- Condition / age +2.5/5.0
- Schools +0.8/10.0
- Appreciation +0.0/10.0
$75,500
🖨 Deal sheet 📄 Offer letter ✓ Due diligence
Listing remarks MLS
DO NOT DISTURB TENANTS! Part of a 64 package sold for 3.5 million.
Key facts
- 6,746 sq ft lot
- Built 1940
- Listed 173 days
Property features AI
Finance
- Other: Lot size approximately 0.155 acres
Exterior
- Security: No safety shelter
- Home design: Single-story
- Construction: Built per public records
- Exterior features: North-facing lot
Interior
- Bathrooms: 1 full bathroom
- Interior features: Other
Neighborhood map
What this means for you Summary
Snapshot
- This is a 2-bed/1.0-bath single-family listed at $76k.
Deal economics
- At list price, monthly cash flow is $532 ($6k/yr) — positive.
- The deal already cash-flows at list — no discount required.
- Meets the 1% rule at list price ($1k rent vs $76k).
- Recommended offer: $66k (12.0% below list) — sets the bar for market timing.
- Cap rate 14.8% vs local median 3.9% in Tulsa — top-decile yield for the area; either an underpriced asset or a hidden risk that comps aren't pricing in. Stress-test before assuming the spread holds.
Location & tenants
- Location reads 75/100 on livability (#13 in OK, #4,058 nationally) — a middle-class / working-renter tenant base. Strengths: amenities A+, commute A+, cost of living A+; Watch: schools F, crime F, employment D-.
- Tulsa (urban): math 7% / reading 12% proficiency, ranked #250 of 270 in OK (top 93%) — low school quality limits family demand, transient renter base, plan for 1-2y turnover; 76% free/reduced lunch — lower-income household profile, screen leases tightly.
- Market conditions: Rents rising (+2.5%/yr); 113 active listings in the ZIP; 14 comparable units currently listed for rent nearby; rentals at typical pace (median 24d on market — plan ~3-4 weeks tenant-placement turnaround); 89 units permitted in Osage County in 2024 (0 in 5+ unit buildings).
- This rent runs 34% of the median local income ($46k/yr) — at the standard rent-burdened threshold; future hikes will face affordability resistance.
Forward outlook
- Local home prices are declining (-3.0%/yr); year-one equity from $522 of loan paydown is wiped out by about $2k of value loss. Plan a longer hold.
- Osage County population projected to shrink 6% by 2050 — rents likely to lag national; underwrite the cash flow, not the appreciation.
- At projected returns (-3.0% appreciation + 2.5% rent growth), your $21k cash investment doubles in ~5 years — after that, you're playing with house money.
Negotiation context
- It's been on market 174 days — a 12% lower offer ($66k) is reasonable based on typical stale-listing flexibility.
- 9 sale attempts since 16y ago; this cycle's ask has dropped $19k (20%) from the opening price — seller is motivated, your offer sets the floor, not the list.
Risks & watch-outs
- Watch-outs: built in 1940 — expect roof / HVAC / electrical / plumbing capex.
- Climate carrying-cost: moderate wildfire risk; extreme-heat days projected 7→17/yr by 2055 (HVAC capex compounding) — expect insurance premiums to compound above CPI over the hold.
Questions for the listing agent
- It's been on market 174 days. Have you received any prior offers? Is the seller open to a 12% concession, seller financing, or rate buy-down credit?
- Built in 1940 — when were the roof, HVAC, electrical panel, plumbing, and water heater last replaced?
- Why hasn't it sold? Are there any deal-killer items the seller is aware of (foundation, flood, title, zoning, code violations)?
- Is there a deadline driving the sale (1031 exchange, divorce, estate, relocation)? That informs how much negotiation room exists.
- Schools are F-rated, which usually means shorter tenancies and higher turnover. Who's the typical renter profile here, and what's been the actual vacancy rate?
- Crime grade is F in this area — have there been break-ins, vandalism, or insurance claims at this property in the last 3 years? What carrier currently insures it and at what premium?
- What's the average days-on-market for RENTAL listings here right now (not sales)? A rising rental-DOM trend means longer vacancies and softer asking-rent achievability than the comps imply.
- What's the recent tenant-quality profile in this submarket — average credit score on applications, eviction rate, late-payment / NSF rate, and stable-employment percentage? A property-management company in the area should have these aggregated.
- How much new for-sale + rental construction is in the pipeline within 1–3 miles? Heavy new supply typically softens prices + rents 12–24 months out; constrained supply supports both.
Investment metrics
- 1% rule
- 1.73% ✓
- Cap rate
- 14.75%
- Cash-on-cash
- 30.22%
- DSCR
- 2.34
- GRM
- 4.8
CMA / ARV
- ARV (on-the-fly)
- $134,112
- Comps found
- 12
Show comp detail 12 sales within ~0.75 mi
| Address | Dist | Beds/Ba | Sqft | Sold | Price | $/sf | Match |
|---|---|---|---|---|---|---|---|
| 1311 N Osage Dr | 0.13mi | 3/1.0 (+1) | 1,008 (-1%) | 4mo | $132,000 | $131 | 84 |
| 1229 N Olympia Ave | 0.14mi | 2/1.0 | 1,043 (+3%) | 21mo | $170,000 | $163 | 72 |
| 1114 W Marshall St | 0.24mi | 2/1.0 | 927 (-9%) | 5mo | $157,500 | $170 | 70 |
| 1315 N Cheyenne Ave | 0.34mi | 3/1.0 (+1) | 1,092 (+8%) | 1mo | $139,000 | $127 | 65 |
| 1124 W Marshall St | 0.24mi | 3/1.0 (+1) | 1,062 (+4%) | 14mo | $71,000 | $67 | 65 |
| 112 E Newton St | 0.49mi | 2/2.0 | 1,064 (+5%) | 2mo | $143,500 | $135 | 63 |
| 1620 N Union Ave | 0.49mi | 3/1.0 (+1) | 1,061 (+4%) | 3mo | $140,000 | $132 | 62 |
| 1428 N Boston Pl | 0.52mi | 3/1.0 (+1) | 952 (-6%) | 8mo | $50,000 | $53 | 54 |
| 1450 N Nogales Ave | 0.13mi | 3/1.0 (+1) | 881 (-13%) | 17mo | $105,002 | $119 | 52 |
| 1204 N Phoenix Ave | 0.22mi | 3/1.0 (+1) | 1,152 (+13%) | 23mo | $182,275 | $158 | 44 |
| 1927 N Cheyenne Ave | 0.71mi | 2/1.0 | 1,140 (+12%) | 11mo | $114,000 | $100 | 38 |
| 907 N Denver Ave | 0.56mi | 3/1.5 (+1) | 1,112 (+9%) | 18mo | $170,000 | $153 | 36 |
Match score weights: distance 35% · size 25% · config 20% · recency 20%. Top-matched comps best support the ARV.
Projected returns pro-forma
-3.0% appreciation · 2.45% rent growth · sell at horizon
- IRR
- 24.2%
- Equity multiple
- 1.99×
- Total profit
- $20,958
- Equity at exit
- $11,257
- IRR
- 31.7%
- Equity multiple
- 3.79×
- Total profit
- $59,016
- Equity at exit
- $6,528
Cash invested: $21,140 (down + closing). Projections, not guarantees.
Landlord ↔ Tenant lean methodology
- Overall (STATE)
- 83 Strongly Landlord-Friendly
- State Oklahoma
- 83 Strongly Landlord-Friendly · R+20
- County
- — inherits STATE
- City
- — inherits STATE
ZIP-level market 74127
- Home prices YoY
- -20.4%
- Rents YoY
- 2.5%
- Active inventory
- 113
- Price-to-rent
- 4.8×
Monthly cashflow live
- Estimated rent
- $1,306 high interval (Pro) →
- Mortgage (P&I)
- −$396
- Tax from tax record
- −$72 /mo · $864/yr
- Insurance
- −$31
- HOA
- −$0
- Vacancy / Maint / Mgmt
- −$274
- Net cashflow
- $532
Break-even live
UW: 25.0% down · 7.5% · 30yr · 1.5% tax · 5.0% vac · 8.0% maint · 8.0% mgmt
Financing live
Cash to close
- Down payment
- $18,875
- Closing costs
- $2,265
- Reserves months
- —
- Total cash needed
- —
Loan-product check · same deal, 3 products live
Conventional
25% down · 7.5% · 30yr
- Down + closing
- —
- Monthly P&I
- —
- Monthly cashflow
- —
- DSCR
- —
- Eligible?
- —
Personal DTI + credit; lowest rate.
DSCR
20% down · 8.5% · 30yr
- Down + closing
- —
- Monthly P&I
- —
- Monthly cashflow
- —
- DSCR
- —
- Eligible?
- —
No personal income docs; deal must DSCR.
Hard money
10% down · 12.0% · 12mo
- Down + closing
- —
- Monthly P&I
- —
- Monthly cashflow
- —
- DSCR
- —
- Eligible?
- —
Short-term bridge; refi at stabilization.
Rent comps 14 comps
| Address | Beds | Baths | Sqft | Rent | $/sqft | DOM | Units | Dist |
|---|---|---|---|---|---|---|---|---|
| 1202 N Boston Ave Tulsa, OK | 1.0 | 1.0 | 728 | $790 | $1.09 | 23d | 1 | 0.47mi |
| 1123 N Main St Unit 12 Tulsa, OK | 1.0 | 1.0 | 784 | $1,160 | $1.48 | 23d | 1 | 0.51mi |
| 205 E Marshall St Tulsa, OK | 3.0 | 2.0 | 1452 | $1,725 | $1.19 | 23d | 1 | 0.62mi |
| 424 N Boulder Ave Tulsa, OK | 1.0–3.0 | 1.0–2.5 | 1220 | $2,686 | $2.20 | 1d | 62 | 1.04mi |
| 238 E Young Pl Unit A Tulsa, OK | 3.0 | 2.0 | 1020 | $1,550 | $1.52 | 16d | 1 | 1.21mi |
| 238 E Young Pl Unit B Tulsa, OK | 3.0 | 2.0 | 1000 | $1,700 | $1.70 | 23d | 1 | 1.21mi |
| 2144 N Garrison Pl Tulsa, OK | 2.0 | 1.0 | 832 | $1,050 | $1.26 | 16d | 1 | 1.29mi |
| 209 N Xenophon Ave Unit B Tulsa, OK | 3.0 | 2.0 | 1150 | $1,500 | $1.30 | 23d | 1 | 1.30mi |
| 2333 W Easton Pl Tulsa, OK | 2.0 | 1.0 | 846 | $700 | $0.83 | 23d | 1 | 1.32mi |
| 613 E Xyler St Tulsa, OK | 1.0 | 1.0 | 1392 | $875 | $0.63 | 16d | 1 | 1.35mi |
| 420 E Archer St Tulsa, OK | 1.0–2.0 | 1.0–2.5 | 1159 | $3,646 | $3.15 | 1d | 30 | 1.39mi |
| 1036 N Madison Ave Tulsa, OK | 2.0 | 1.0 | 800 | $1,100 | $1.38 | 23d | 1 | 1.40mi |
| 1008 E King Pl Tulsa, OK | 3.0 | 1.0 | 1284 | $1,295 | $1.01 | 2d | 1 | 1.44mi |
| 2521 W Cameron St Tulsa, OK | 3.0 | 1.5 | 1161 | $1,295 | $1.12 | 19d | 1 | 1.45mi |
Listing history 43 events
-
2026-06-18days on market $75,500 Active 174 DOM
-
2026-06-17days on market $75,500 Active 173 DOM
-
2026-06-16days on market $75,500 Active 172 DOM
-
2026-06-15days on market $75,500 Active 171 DOM
-
2026-06-13days on market $75,500 Active 169 DOM
-
2026-06-10days on market $75,500 Active 166 DOM
-
2026-06-09days on market $75,500 Active 165 DOM
-
2026-06-08days on market $75,500 Active 164 DOM
-
2026-06-07days on market $75,500 Active 163 DOM
-
2026-06-05days on market $75,500 Active 160 DOM
-
2026-06-03days on market $75,500 Active 159 DOM
-
2026-06-02days on market $75,500 Active 158 DOM
-
2026-06-01days on market $75,500 Active 157 DOM
-
2026-05-31days on market $75,500 Active 156 DOM
-
2026-01-23price $75,500
-
2026-01-15price $78,000
-
2026-01-12price $93,890
-
2025-12-24$94,890 Active
-
2024-07-02historical
-
2023-11-20price $95,100
-
2023-09-09price $95,200
-
2023-07-24price $96,825
-
2023-07-23price $97,825
-
2023-07-03$98,825 Active
-
2021-06-03soldstatus $1,450,000
-
2021-05-28soldstatus $45,312 Closed 66-char remark
Show marketing remark (66 chars)
DO NOT DISTURB TENANTS! Part of a 64 package sold for 3.5 million.
-
2021-04-23status Pending 66-char remark
Show marketing remark (66 chars)
DO NOT DISTURB TENANTS! Part of a 64 package sold for 3.5 million.
-
2021-03-29status Active 66-char remark
Show marketing remark (66 chars)
DO NOT DISTURB TENANTS! Part of a 64 package sold for 3.5 million.
-
2021-03-03status Pending 66-char remark
Show marketing remark (66 chars)
DO NOT DISTURB TENANTS! Part of a 64 package sold for 3.5 million.
-
2021-01-26status Active 66-char remark
Show marketing remark (66 chars)
DO NOT DISTURB TENANTS! Part of a 64 package sold for 3.5 million.
-
2021-01-08status Pending 66-char remark
Show marketing remark (66 chars)
DO NOT DISTURB TENANTS! Part of a 64 package sold for 3.5 million.
-
2021-01-08status Active 66-char remark
Show marketing remark (66 chars)
DO NOT DISTURB TENANTS! Part of a 64 package sold for 3.5 million.
-
2020-12-31historical 66-char remark
Show marketing remark (66 chars)
DO NOT DISTURB TENANTS! Part of a 64 package sold for 3.5 million.
-
2020-12-11$54,687 Active 66-char remark
Show marketing remark (66 chars)
DO NOT DISTURB TENANTS! Part of a 64 package sold for 3.5 million.
-
2016-03-08soldstatus $44,500
-
2016-03-03soldstatus $27,000 Closed
-
2015-12-22status Pending
-
2015-07-15$27,000 Active
-
2015-06-22historical
-
2015-06-03$27,000 Active
-
2011-04-21soldstatus $11,500
-
2011-03-13historical
-
2010-10-14$14,900
ⓘ Source: listings_history table (triggers on properties + properties_extension) + one-shot
backfill from property_details.listing_events for pre-trigger history.
Tax reassessment forecast OK · Resets to sale price
- Current annual tax
- $864 · $72/mo
- Projected year-2 tax
- $864 · $72/mo
- Expected delta
- $0/yr ($0/mo · 0.0%)
ⓘ Screening estimate from a state-policy table — verify with the county assessor before closing.
Climate risk First Street
- Flood 1/10 Low FEMA zone X (unshaded) · 0% chance over 30 yrs
- Wildfire 5/10 Major
- Heat 6/10 Major 7 d/yr ≥110°F today · 17 d/yr by 30 yrs out
- Wind 3/10 Moderate 4% chance of damaging wind over 30 yrs
- Air quality 2/10 Low 2 unhealthy d/yr today · 2 by 30 yrs out
Nearby sold comps map
Loading sold comps map…
Walkable amenities ~0.75 mi
Loading nearby amenities…
Taxation est. · year 1
- Rental income
- $15,672
- − Mortgage interest
- −$4,229
- − Property taxes
- −$864
- − Insurance
- −$378
- − Repairs & maintenance
- −$1,254
- − Management
- −$1,254
- − Depreciation
- −$2,196
- Taxable income
- $5,497
- Est. tax owed @ 24.0%
- −$1,319
- After-tax cash flow
- $5,069/yr
For passive investors: Depreciation is non-cash, so a rental often shows a tax loss while cash-flowing — sheltering income. Rental losses are passive: they offset passive income freely, and up to $25,000/yr can offset ordinary (W-2) income if you actively participate and your MAGI is under $100k (phasing out to $0 by $150k); unused losses carry forward. On sale, claimed depreciation is recaptured at up to 25%, and gains may owe capital-gains tax (a 1031 exchange can defer both). Figures are a year-1 estimate at your 24.0% rate — not tax advice; consult a CPA.
Schools (NCES district)
- District
- Tulsa
- NCES district ID
- 4030240
- Math proficiency
- 7% ▼ -9.00%
- Reading proficiency
- 12% ▼ -7.00%
- Median HH income
- $37,895
- Composite
- 8.04/100
- National rank
- #9919
- State rank
- #250 of 270 in OK
Livability — Tulsa
- Score
- 75/100
- State rank
- #13
- US rank
- #4058
Category grades
Schools grade is shown separately in the Schools card above.
Census & demographics
- Census place
- Tulsa, OK
- County
- Osage County · 26,244 people
- City population
- 389,418
- Metro
- Tulsa, OK
- Population (ZIP)
- 16,324
- Household income
- $46,373
- Rent vs Own
- Severe rent burden
- 782.0
Population outlook (Osage County) Hauer SSP2
- Today (2025)
- 48,950 people
- By 2030
- 48,936 · +-0.0%
- By 2040
- 47,826 · -2.3%
- By 2050
- 45,781 · -6.5%
- By 2075
- 41,140 · -16.0%
- By 2100
- 32,796 · -33.0%
Race, ethnicity, and origin ACS 2023
- Neighborhood character
- Diverse neighborhood (Simpson 0.66)
- Race & ethnicity
- White 50% Black 28% Two or more races 10% Hispanic / Latino 7% Native American 7%
- Hispanic origin (detail)
- Mexican 5%
- Common ancestry
- Slovak 2% Italian 1% Iranian 1%
- Foreign-born
- 4% · Canada, Jamaica
- Languages at home
- 94% English-only · Spanish 4%
Political lean MEDSL · Osage
- 2024 margin
- Solid R (+41.4) · D 28.4% · R 69.8% · Other 1.7%
- 2008→2024 swing
- -17.7pp toward R · 2008: -23.7pp · 2024: -41.4pp
- All cycles
- 2024: R+41.4 2020: R+39.5 2016: R+36.8 2012: R+25.2 2008: R+23.7
Not yet ingested
- Civics
- —
Market trends
- HPI YoY
- ▼ -59.31%
- Current HPI
- 231.5994
- Rent YoY
- ▲ 2.45%
- Metro
- Tulsa, OK
- State GDP YoY
- ▲ 1.55%
- F500 in state
- 6
Industry mix (Fortune 500 HQ in OK)
| Industry | F500 HQs | Revenue |
|---|---|---|
| Energy | 3 | $48B |
|
||
Price history
+406.7% since first listed29 events — show timeline
- 2026-01-23 Price Changed $75,500 MLS Technology, Inc.
- 2026-01-15 Price Changed $78,000 MLS Technology, Inc.
- 2026-01-12 Price Changed $93,890 MLS Technology, Inc.
- 2025-12-24 Listed $94,890 MLS Technology, Inc.
- 2024-07-02 Listing Removed — MLS Technology, Inc.
- 2023-11-20 Price Changed $95,100 MLS Technology, Inc.
- 2023-09-09 Price Changed $95,200 MLS Technology, Inc.
- 2023-07-24 Price Changed $96,825 MLS Technology, Inc.
- 2023-07-23 Price Changed $97,825 MLS Technology, Inc.
- 2023-07-03 Listed $98,825 MLS Technology, Inc.
- 2021-06-03 Sold (Public Records) $1,450,000 Public Records
- 2021-05-28 Sold (MLS) $45,312 MLS Technology, Inc.
- 2021-04-23 Pending — MLS Technology, Inc.
- 2021-03-29 Relisted — MLS Technology, Inc.
- 2021-03-03 Pending — MLS Technology, Inc.
- 2021-01-26 Relisted — MLS Technology, Inc.
- 2021-01-08 Pending — MLS Technology, Inc.
- 2021-01-08 Relisted — MLS Technology, Inc.
- 2020-12-31 Listing Removed — MLS Technology, Inc.
- 2020-12-11 Listed $54,687 MLS Technology, Inc.
- 2016-03-08 Sold (Public Records) $44,500 Public Records
- 2016-03-03 Sold (MLS) $27,000 MLS Technology, Inc.
- 2015-12-22 Pending — MLS Technology, Inc.
- 2015-07-15 Listed $27,000 MLS Technology, Inc.
- 2015-06-22 Listing Removed — MLS Technology, Inc.
- 2015-06-03 Listed $27,000 MLS Technology, Inc.
- 2011-04-21 Sold (MLS) $11,500 MLS Technology, Inc.
- 2011-03-13 Listing Removed — MLS Technology, Inc.
- 2010-10-14 Listed $14,900 MLS Technology, Inc.
Property tax history
+9.4%/yrLatest (2025): $864 · +9.1% YoY. Source: county tax records.
Cash-flow waterfall
monthlySold comps — $/sqft
last 12 mo · ≤1 miLoading sold comps…