 7-Plex
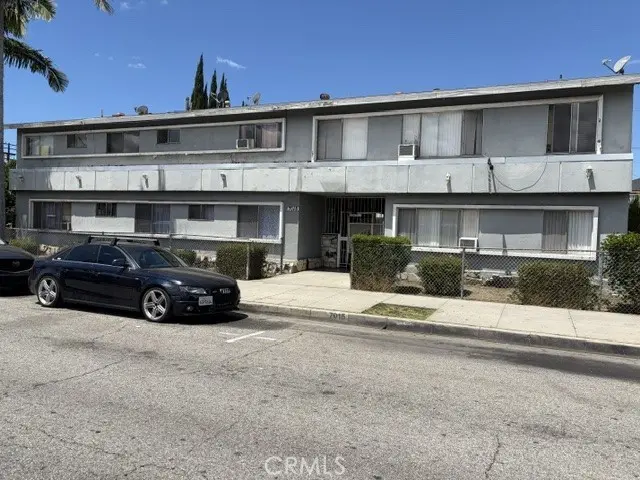
7015 Rugby · Huntington Park, CA
Flood risk 1/10 · Minimal
- FEMA flood zone
- X (unshaded)
- Chance of flooding over 30 yrs
- 0.0%
- Est. flood insurance / yr
- $507 – $1,088
Fire risk 1/10 · Minimal
- Est. fire insurance / yr
- $659 – $1,223
Heat risk 6/10 · Moderate
- Hot days now (above 90°F)
- 7 days/yr
- Hot days in 30 yrs
- 22 days/yr
Wind risk 1/10 · Minimal
- Chance of severe wind over 30 yrs
- —
Air-quality risk 5/10 · Moderate
- Unhealthy air days now
- 9 days/yr
- Unhealthy air days in 30 yrs
- 9 days/yr
Risk factors via First Street. Map © Google.
Why this score? — see what drove the C grade
The composite is a weighted blend of 9 inputs, each scored 0–100. Each bar is that input's sub-score; the figure is the points it added to the 100-point composite (weight × sub-score).
- Cash flow +26.1/30.0
- DSCR +8.8/10.0
- ARV discount +7.5/15.0
- 1% rule +6.1/10.0
- Schools +3.6/10.0
- Livability +3.1/5.0
- Condition / age +2.5/5.0
- Rent growth +2.1/5.0
- Appreciation +0.0/10.0
$2,199,500
🖨 Deal sheet 📄 Offer letter ✓ Due diligence
Multi-family units
County records classify this as Multi-Family (5+ Unit). Listing-text estimate: 7 units. confirmed
5+ unit building — per-unit beds/baths from public records are typically unavailable; the breakdown below (if shown) is an estimate from the listing text.
Listing remarks
Two story, twelve unit apartment building located one block from Huntington Park's Historic Downtown Pacific Blvd. Unit mix is 4-1 bedroom/1bathroom units, 7-2 bedroom/1 bathroom units and 1-3 bedroom/1 1//2 bath unit. The property has all units surrounding and most facing the sparkling, fully fenced swimming pool. 9 carports in the rear provide parking for the property and these.
Key facts
- 9 carports
- Two story
- 0.29 acre lot
Tags
Property features AI
Finance
- Other: Some units listed with rents and unit counts (examples): 4 units at $1,200 actual rent (1 bed/1 bath), 7 units at $1,600 actual rent (2 bed/1 bath), 1 unit at $2,200 actual rent (3 bed/2 bath); Tenant pays phone and electricity
- Financial info: Total actual rent reported: $14,750; Gross scheduled income: $177,000; Net operating income: $131,535; Total expenses reported: $131,535 (includes insurance, maintenance, pool, trash, utilities, gardener, pest control, workers comp, fuel, licenses, taxes); Operating expense reported separately: $131,535; Other expense: $3,500 (Attorney); Gross multiplier: 12; Gross equity reported: $2,199,500; Total building area reported: 10,952 (as provided); Number of units total: 12; Number of leased units: 12; Multiple separate utility meters: 13 electric meters, 13 gas meters, 1 separate water meter
- HOA & community: Rent control in effect
Exterior
- Parking: Assigned parking; Attached carports; Nine carport spaces total; One garage space per some units
- Security: Window bars; Wired for alarm system; Smoke and carbon monoxide detectors
- Utilities: Public/district water; Public sewer (sewer connected); Electricity available and connected; Natural gas available; Telephone available/in street and on property
- Home design: Attached property; Two-story building; Front entry; Entry level 1; Has a view; Entry slope less than 1 foot (accessibility)
- Construction: Composition/shingle roof; Concrete slab foundation; One building containing all units; Year built reported from assessor
- Exterior features: In-ground private gunite pool (fenced); Rain gutters; Block wall fencing; Lot is rectangular and level/flat; Near public transit; Lot size reported in assessor's data; Gutters and curbs in the neighborhood; Street lighting, sidewalks, storm drains, biking paths, nearby park
Interior
- Kitchen: Garbage disposal; Gas water heater; Central water heater
- Bedrooms: Primary bathroom (unit-level room type indicated)
- Flooring: Vinyl; Carpet; Laminated
- Bathrooms: Primary bathroom (unit-level room type indicated)
- Heating & cooling: Wall heaters
- Interior features: Balcony; Ceiling fan; Laminate countertops; Formica countertops; Sliding glass doors; Two staircases; Window bars; Carbon monoxide detector; Wired for alarm system; Smoke detector
- Laundry & utility: Community laundry
Neighborhood map
What this means for you Summary
Snapshot
- This is a 7 × 3-bed/?-bath units multifamily listed at $2.20M.
Deal economics
- At list price, monthly cash flow is $6k ($67k/yr) — positive. Per door: $794/mo.
- The deal already cash-flows at list — no discount required.
- Meets the 1% rule at list price ($24k rent vs $2.20M).
- Recommended offer: $2.17M (1.5% below list) — sets the bar for market timing.
- Cap rate 9.3% vs local median 3.1% in Huntington Park — top-decile yield for the area; either an underpriced asset or a hidden risk that comps aren't pricing in. Stress-test before assuming the spread holds.
Location & tenants
- Location reads 62/100 on livability (#491 in CA) — a middle-class / working-renter tenant base. Strengths: commute A+; Watch: employment D+, health & safety D, schools D-.
- Los Angeles Unified (urban): math 29% / reading 54% proficiency, ranked #223 of 517 in CA (top 43%) — families likely to look elsewhere, expect single-tenant / working-renter base with shorter leases; 67% free/reduced lunch — lower-income household profile, screen leases tightly.
- Market conditions: Rents soft (-1.4%/yr); 52 active listings in the ZIP; 19,697 units permitted in Los Angeles County in 2024 (9,426 in 5+ unit buildings).
- At $24,413/mo this rent would consume 452% of the median local household income ($65k/yr) (locally 3774% of renters already pay >50% of income on rent) — very limited rent-growth headroom before tenants either downsize or default.
Forward outlook
- Local home prices are declining (-3.0%/yr); year-one equity from $15k of loan paydown is wiped out by about $66k of value loss. Plan a longer hold.
- Los Angeles County population projected at +9% by 2050 — modest demand growth; plan on rents tracking national, not racing it.
Negotiation context
- It's been on market 17 days — a 2% lower offer ($2.17M) is reasonable based on typical stale-listing flexibility.
- Current owner paid $479k; list at $2.20M implies a 359% gain — meaningful room to come down on a strong offer.
Risks & watch-outs
- Climate carrying-cost: extreme-heat days projected 7→22/yr by 2055 (HVAC capex compounding) — expect insurance premiums to compound above CPI over the hold.
Questions for the listing agent
- Can we see the unit-by-unit rent roll, current vacancy, and any below-market leases? What's the average tenancy length?
- What capital expenditures (roof, boiler, parking lot, exteriors) have been made in the last 5 years, and what's planned in the next 2?
- Built in 1960 — when were the roof, HVAC, electrical panel, plumbing, and water heater last replaced?
- Is there a deadline driving the sale (1031 exchange, divorce, estate, relocation)? That informs how much negotiation room exists.
- Schools are D-rated, which usually means shorter tenancies and higher turnover. Who's the typical renter profile here, and what's been the actual vacancy rate?
- Crime grade is F in this area — have there been break-ins, vandalism, or insurance claims at this property in the last 3 years? What carrier currently insures it and at what premium?
- What's the average days-on-market for RENTAL listings here right now (not sales)? A rising rental-DOM trend means longer vacancies and softer asking-rent achievability than the comps imply.
- What's the recent tenant-quality profile in this submarket — average credit score on applications, eviction rate, late-payment / NSF rate, and stable-employment percentage? A property-management company in the area should have these aggregated.
- How much new apartment / multifamily construction is in the pipeline within 1–3 miles? Heavy new supply (>2% of stock underway) typically softens rents 12–24 months out; light construction supports rent growth.
Investment metrics
- 1% rule
- 1.11% ✓
- Cap rate
- 9.33%
- Cash-on-cash
- 10.83%
- DSCR
- 1.48
- GRM
- 7.5
CMA / ARV
No comps found within radius.
Projected returns pro-forma
-3.0% appreciation · 0.0% rent growth · sell at horizon
- IRR
- -3.3%
- Equity multiple
- 0.88×
- Total profit
- $-74,504
- Equity at exit
- $327,953
- IRR
- 2.9%
- Equity multiple
- 1.18×
- Total profit
- $112,272
- Equity at exit
- $190,173
Cash invested: $615,860 (down + closing). Projections, not guarantees.
Landlord ↔ Tenant lean methodology
- Overall (STATE)
- 18 Strongly Tenant-Friendly
- State California
- 18 Strongly Tenant-Friendly · D+13
- County
- — inherits STATE
- City
- — inherits STATE
ZIP-level market 90255
- Rents YoY
- -1.4%
- Active inventory
- 52
- Price-to-rent
- 52.6×
Monthly cashflow live
- Estimated rent
- $24,413 high interval (Pro) →
- Mortgage (P&I)
- −$11,534
- Tax from tax record
- −$1,277 /mo · $15,329/yr
- Insurance
- −$916
- HOA
- −$0
- Vacancy / Maint / Mgmt
- −$5,127
- Net cashflow
- $5,558
Break-even live
7-unit breakdown (identical units grouped — click to expand)
| Units | Beds | Baths | Est. rent |
|---|---|---|---|
| 7× units | 3 | — | $24,416 |
| #1 | 3 | — | $3,488 |
| #2 | 3 | — | $3,488 |
| #3 | 3 | — | $3,488 |
| #4 | 3 | — | $3,488 |
| #5 | 3 | — | $3,488 |
| #6 | 3 | — | $3,488 |
| #7 | 3 | — | $3,488 |
| Total (7 units) | $24,413 | ||
UW: 25.0% down · 7.5% · 30yr · 1.5% tax · 5.0% vac · 8.0% maint · 8.0% mgmt
Financing live
Cash to close
- Down payment
- $549,875
- Closing costs
- $65,985
- Reserves months
- —
- Total cash needed
- —
Loan-product check · same deal, 3 products live
Conventional
25% down · 7.5% · 30yr
- Down + closing
- —
- Monthly P&I
- —
- Monthly cashflow
- —
- DSCR
- —
- Eligible?
- —
Personal DTI + credit; lowest rate.
DSCR
20% down · 8.5% · 30yr
- Down + closing
- —
- Monthly P&I
- —
- Monthly cashflow
- —
- DSCR
- —
- Eligible?
- —
No personal income docs; deal must DSCR.
Hard money
10% down · 12.0% · 12mo
- Down + closing
- —
- Monthly P&I
- —
- Monthly cashflow
- —
- DSCR
- —
- Eligible?
- —
Short-term bridge; refi at stabilization.
Listing history 12 events
-
2026-06-18days on market $2,199,500 Active 17 DOM
-
2026-06-17days on market $2,199,500 Active 16 DOM
-
2026-06-16days on market $2,199,500 Active 15 DOM
-
2026-06-15days on market $2,199,500 Active 14 DOM
-
2026-06-13days on market $2,199,500 Active 12 DOM
-
2026-06-09days on market $2,199,500 Active 8 DOM
-
2026-06-08days on market $2,199,500 Active 7 DOM
-
2026-06-07days on market $2,199,500 Active 6 DOM
-
2026-06-04days on market $2,199,500 Active 3 DOM
-
2026-06-03days on market $2,199,500 Active 2 DOM
-
2026-06-02remarks 383-char remark
-
2026-06-02$2,199,500 Active 1 DOM
ⓘ Source: listings_history table (triggers on properties + properties_extension) + one-shot
backfill from property_details.listing_events for pre-trigger history.
Tax reassessment forecast CA · Resets to sale price
- Current annual tax
- $15,329 · $1,277/mo
- Projected year-2 tax
- $16,716 · $1,393/mo
- Expected delta
- +$1,387/yr (+$116/mo · 9.0%)
ⓘ Screening estimate from a state-policy table — verify with the county assessor before closing.
Climate risk First Street
- Flood 1/10 Low FEMA zone X (unshaded) · 0% chance over 30 yrs
- Wildfire 1/10 Low
- Heat 6/10 Major 7 d/yr ≥90°F today · 22 d/yr by 30 yrs out
- Wind 1/10 Low
- Air quality 5/10 Major 9 unhealthy d/yr today · 9 by 30 yrs out
Nearby sold comps map
Loading sold comps map…
Walkable amenities ~0.75 mi
Loading nearby amenities…
Taxation est. · year 1
- Rental income
- $292,956
- − Mortgage interest
- −$123,206
- − Property taxes
- −$15,329
- − Insurance
- −$10,998
- − Repairs & maintenance
- −$23,436
- − Management
- −$23,436
- − Depreciation
- −$63,985
- Taxable income
- $32,565
- Est. tax owed @ 24.0%
- −$7,816
- After-tax cash flow
- $58,880/yr
For passive investors: Depreciation is non-cash, so a rental often shows a tax loss while cash-flowing — sheltering income. Rental losses are passive: they offset passive income freely, and up to $25,000/yr can offset ordinary (W-2) income if you actively participate and your MAGI is under $100k (phasing out to $0 by $150k); unused losses carry forward. On sale, claimed depreciation is recaptured at up to 25%, and gains may owe capital-gains tax (a 1031 exchange can defer both). Figures are a year-1 estimate at your 24.0% rate — not tax advice; consult a CPA.
Schools (NCES district)
- District
- Los Angeles Unified
- NCES district ID
- 0622710
- Math proficiency
- 29% ▼ -4.00%
- Reading proficiency
- 54% ▲ 10.00%
- Median HH income
- $50,403
- Composite
- 35.67/100
- National rank
- #4875
- State rank
- #223 of 517 in CA
Livability — Huntington Park
- Score
- 62/100
- State rank
- #491
- US rank
- #16649
Category grades
Schools grade is shown separately in the Schools card above.
Census & demographics
- Census place
- Huntington Park, CA
- County
- Los Angeles County · 9,444,647 people
- City population
- 69,349
- Metro
- Los Angeles-Long Beach-Anaheim, CA
- Population (ZIP)
- 69,349
- Household income
- $64,766
- Rent vs Own
- Severe rent burden
- 3774.0
Population outlook (Los Angeles County) Hauer SSP2
- Today (2025)
- 10,940,515 people
- By 2030
- 11,256,481 · +2.9%
- By 2040
- 11,729,929 · +7.2%
- By 2050
- 11,948,407 · +9.2%
- By 2075
- 11,818,114 · +8.0%
- By 2100
- 10,842,928 · -0.9%
Race, ethnicity, and origin ACS 2023
- Neighborhood character
- Predominantly Hispanic (97%)
- Race & ethnicity
- Hispanic / Latino 97% Two or more races 31% Native American 2% White 1%
- Hispanic origin (detail)
- Mexican 78%
- Foreign-born
- 46% · Canada
- Languages at home
- 11% English-only · Spanish 88%
Political lean MEDSL · Los Angeles
- 2024 margin
- Solid D (+32.9) · D 64.8% · R 31.9% · Other 3.3%
- 2008→2024 swing
- -7.4pp toward R · 2008: 40.4pp · 2024: 32.9pp
- All cycles
- 2024: D+32.9 2020: D+44.2 2016: D+48.0 2012: D+40.0 2008: D+40.4
Not yet ingested
- Civics
- —
Market trends
- HPI YoY
- ▼ -666.90%
- Current HPI
- 432.2813
- Rent YoY
- ▼ -1.44%
- Metro
- Los Angeles-Long Beach-Anaheim, CA
- State GDP YoY
- ▲ 3.21%
- F500 in state
- 116
Industry mix (Fortune 500 HQ in CA)
| Industry | F500 HQs | Revenue |
|---|---|---|
| Technology | 27 | $1,492B |
|
||
| Financial Services | 3 | $174B |
|
||
| Retail | 3 | $44B |
|
||
| Insurance | 3 | $26B |
|
||
| Media / Entertainment | 2 | $115B |
|
||
| Pharmaceuticals / Biotech | 2 | $62B |
|
||
Price history
+359.2% since first listed2 events — show timeline
- 2026-06-01 Listed $2,199,500 CRMLS
- 1999-04-08 Sold (Public Records) $479,000 Public Records
Property tax history
+2.3%/yrLatest (2025): $15,329 · -66.0% YoY. Source: county tax records.
Cash-flow waterfall
monthlySold comps — $/sqft
last 12 mo · ≤1 miLoading sold comps…