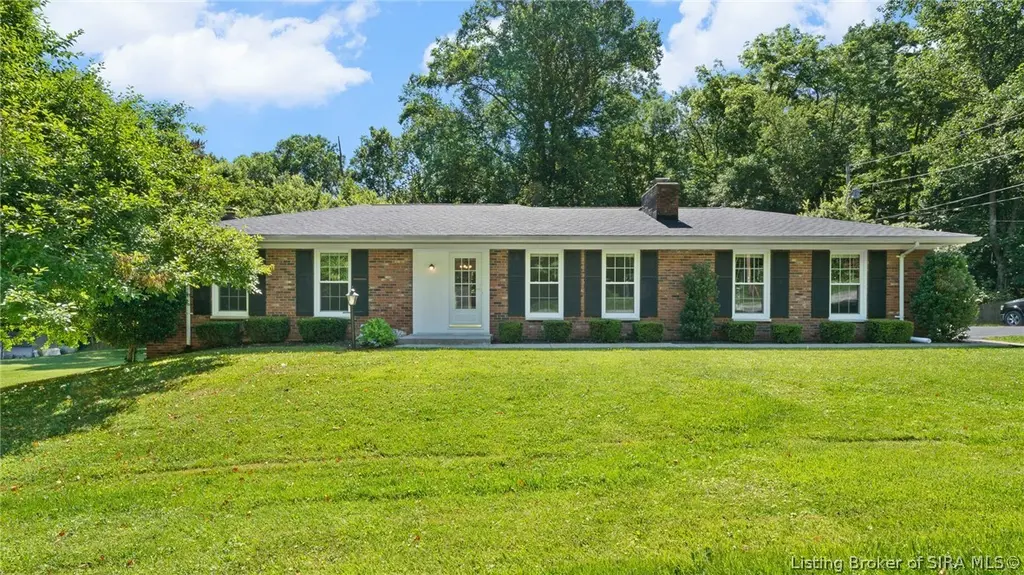
17711 Carter Pl · Borden, IN
Flood risk 1/10 · Minimal
- FEMA flood zone
- X (unshaded)
- Chance of flooding over 30 yrs
- 0.0%
- Est. flood insurance / yr
- $473 – $860
Fire risk 3/10 · Minor
- Est. fire insurance / yr
- $717 – $1,331
Heat risk 4/10 · Minor
- Hot days now (above 104°F)
- 7 days/yr
- Hot days in 30 yrs
- 20 days/yr
Wind risk 2/10 · Minimal
- Chance of severe wind over 30 yrs
- 1.0%
Air-quality risk 2/10 · Minimal
- Unhealthy air days now
- 1 days/yr
- Unhealthy air days in 30 yrs
- 2 days/yr
Risk factors via First Street. Map © Google.
Why this score? — see what drove the F grade
The composite is a weighted blend of 9 inputs, each scored 0–100. Each bar is that input's sub-score; the figure is the points it added to the 100-point composite (weight × sub-score).
- Appreciation +10.0/10.0
- Cash flow +7.8/30.0
- Schools +5.0/10.0
- Livability +3.1/5.0
- Rent growth +2.5/5.0
- Condition / age +2.5/5.0
- DSCR +1.8/10.0
- 1% rule +1.3/10.0
- ARV discount +0.0/15.0
$326,000
🖨 Deal sheet 📄 Offer letter ✓ Due diligence
Listing remarks
Welcome to Dow Knob Estates, where peaceful Southern Indiana living meets everyday convenience. This charming brick ranch offers 3 bedrooms, 2 full baths, and a finished walkout basement with plenty of space for relaxing or entertaining. The enclosed sunroom provides a cozy retreat, complete with a hot tub for year-round enjoyment. An attached 2-car garage and a brand-new roof (July 2025) add to the home's appeal, while the location places you just minutes from Huber's Orchard, Deam Lake State Recreation Area, and Covered Bridge Golf Club. A Boundary Retracement Survey is available. Looking for additional acreage? The adjoining land is available as part of the parent listing, MLS #202608868
Key facts
- Hot tub
- Enclosed sunroom
- Brand new roof
Tags
Property features AI
Exterior
- Parking: Attached garage with two spaces; Garage faces side; Garage door opener
- Utilities: Public water connection; Septic sewer
- Home design: Single-story home; Shingle roof; Brick, cedar, and frame exterior; Poured foundation; Resale property; Residential zoning
- Construction: Built with brick, cedar, and frame materials; Poured foundation
- Exterior features: Deck; Landscaped yard; Paved driveway; Property on a cul-de-sac
Interior
- Kitchen: Pantry
- Bedrooms: Bedroom on first level with built-in bookshelf
- Flooring: Carpet in multiple lower-level rooms; Tile in at least one full bath
- Bathrooms: Two full bathrooms; One half bathroom; Full bath on first level; Finished lower-level bath (includes shower in laundry area)
- Heating & cooling: Forced-air heating; Central air conditioning
- Interior features: Built-in bookcases; Ceiling fans; Bath in primary bedroom; Main-level primary bedroom; Pantry; Sunroom; Thermal windows; Wood-burning fireplace
- Laundry & utility: Laundry room in basement; Main-level laundry area with shower and sink; Washer and dryer included
Neighborhood map
What this means for you Summary
Snapshot
- This is a 3-bed/2.0-bath single-family listed at $326k.
Deal economics
- At list price, monthly cash flow is $-369 ($-4k/yr) — negative.
- To cash-flow at today's rent, offer at most $261k (20.0% below list).
- To meet the 1% rule (rent ≥ 1% of price), the offer needs to be $204k (37.4% below list).
- Recommended offer: $204k (37.4% below list) — sets the bar for 1% rule.
Location & tenants
- Location reads 61/100 on livability (#507 in IN) — a middle-class / working-renter tenant base. Strengths: crime A+, cost of living A+, housing A+; Watch: employment D+, amenities F, commute F.
- Market conditions: 26 active listings in the ZIP; 911 units permitted in Clark County in 2024 (133 in 5+ unit buildings).
Forward outlook
- In year one you build about $35k of equity ($2k loan paydown + $33k appreciation (10.0% local appreciation)).
- Clark County population projected at +17% by 2050 — long-run rental-demand tailwind backs the buy-and-hold thesis.
- By year 2, paydown + projected appreciation supports a ~$56k cash-out refi (75% LTV) — recoverable capital for the next deal without selling this one.
Negotiation context
- Only 2 days on market — expect competitive offers; lowballing is unlikely to land.
Questions for the listing agent
- What do current leases actually rent for vs. the listed asking? Can we see a recent rent roll and the last 12 months of T-12 income?
- Built in 1969 — when were the roof, HVAC, electrical panel, plumbing, and water heater last replaced?
- Is there a deadline driving the sale (1031 exchange, divorce, estate, relocation)? That informs how much negotiation room exists.
- Schools are B-rated — typically a magnet for longer-tenancy family renters. What's the average tenant stay here, and is there a school-zone premium baked into asking?
- The area grade is low — what's the realistic commute time and amenity access for the typical tenant pool here? Any planned neighborhood developments (good or bad) we should know about?
- What's the average days-on-market for RENTAL listings here right now (not sales)? A rising rental-DOM trend means longer vacancies and softer asking-rent achievability than the comps imply.
- What's the recent tenant-quality profile in this submarket — average credit score on applications, eviction rate, late-payment / NSF rate, and stable-employment percentage? A property-management company in the area should have these aggregated.
- How much new for-sale + rental construction is in the pipeline within 1–3 miles? Heavy new supply typically softens prices + rents 12–24 months out; constrained supply supports both.
Investment metrics
- 1% rule
- 0.63% ✗
- Cap rate
- 4.94%
- Cash-on-cash
- -4.85%
- DSCR
- 0.78
- GRM
- 13.3
CMA / ARV
- ARV (on-the-fly)
- $265,923
- Comps found
- 1
Show comp detail 1 sale within ~0.75 mi
| Address | Dist | Beds/Ba | Sqft | Sold | Price | $/sf | Match |
|---|---|---|---|---|---|---|---|
| 17421 Highway 60 | 0.39mi | 3/1.0 | 1,237 (-12%) | 1mo | $234,000 | $189 | 57 |
Match score weights: distance 35% · size 25% · config 20% · recency 20%. Top-matched comps best support the ARV.
Projected returns pro-forma
10.0% appreciation · 3.0% rent growth · sell at horizon
- IRR
- 20.8%
- Equity multiple
- 2.69×
- Total profit
- $153,929
- Equity at exit
- $293,687
- IRR
- 18.9%
- Equity multiple
- 6.17×
- Total profit
- $471,492
- Equity at exit
- $633,346
Cash invested: $91,280 (down + closing). Projections, not guarantees.
Landlord ↔ Tenant lean methodology
- Overall (STATE)
- 90 Strongly Landlord-Friendly
- State Indiana
- 90 Strongly Landlord-Friendly · R+11
- County
- — inherits STATE
- City
- — inherits STATE
ZIP-level market 47106
- Home prices YoY
- 6.7%
- Active inventory
- 26
- Price-to-rent
- 13.3×
Monthly cashflow live
- Estimated rent
- $2,041 medium interval (Pro) →
- Mortgage (P&I)
- −$1,710
- Tax from tax record
- −$136 /mo · $1,626/yr
- Insurance
- −$136
- HOA
- −$0
- Vacancy / Maint / Mgmt
- −$429
- Net cashflow
- $-369
Break-even live
UW: 25.0% down · 7.5% · 30yr · 1.5% tax · 5.0% vac · 8.0% maint · 8.0% mgmt
Financing live
Cash to close
- Down payment
- $81,500
- Closing costs
- $9,780
- Reserves months
- —
- Total cash needed
- —
Loan-product check · same deal, 3 products live
Conventional
25% down · 7.5% · 30yr
- Down + closing
- —
- Monthly P&I
- —
- Monthly cashflow
- —
- DSCR
- —
- Eligible?
- —
Personal DTI + credit; lowest rate.
DSCR
20% down · 8.5% · 30yr
- Down + closing
- —
- Monthly P&I
- —
- Monthly cashflow
- —
- DSCR
- —
- Eligible?
- —
No personal income docs; deal must DSCR.
Hard money
10% down · 12.0% · 12mo
- Down + closing
- —
- Monthly P&I
- —
- Monthly cashflow
- —
- DSCR
- —
- Eligible?
- —
Short-term bridge; refi at stabilization.
Listing history 13 events
-
2026-06-18days on market $326,000 Active 2 DOM
-
2026-06-16remarks 699-char remark
-
2026-06-16pricedays on market $326,000 Active 1 DOM
-
2026-06-15days on market $361,000 Active 10 DOM
-
2026-06-13days on market $361,000 Active 8 DOM
-
2026-06-10days on market $361,000 Active 5 DOM
-
2026-06-09days on market $361,000 Active 4 DOM
-
2026-06-08days on market $361,000 Active 3 DOM
-
2026-06-07remarks 687-char remark
-
2026-06-07pricedays on market $361,000 Active 2 DOM
-
2026-06-01days on market $346,000 Active 49 DOM
-
2026-05-31days on market $346,000 Active 48 DOM
-
2026-04-13$346,000 Active
ⓘ Source: listings_history table (triggers on properties + properties_extension) + one-shot
backfill from property_details.listing_events for pre-trigger history.
Tax reassessment forecast IN · Partial reset (capped growth)
- Current annual tax
- $1,626 · $136/mo
- Projected year-2 tax
- $2,199 · $183/mo
- Expected delta
- +$572/yr (+$48/mo · 35.2%)
ⓘ Screening estimate from a state-policy table — verify with the county assessor before closing.
Climate risk First Street
- Flood 1/10 Low FEMA zone X (unshaded) · 0% chance over 30 yrs
- Wildfire 3/10 Moderate
- Heat 4/10 Moderate 7 d/yr ≥104°F today · 20 d/yr by 30 yrs out
- Wind 2/10 Low 100% chance of damaging wind over 30 yrs
- Air quality 2/10 Low 1 unhealthy d/yr today · 2 by 30 yrs out
Nearby sold comps map
Loading sold comps map…
Walkable amenities ~0.75 mi
Loading nearby amenities…
Taxation est. · year 1
- Rental income
- $24,490
- − Mortgage interest
- −$18,261
- − Property taxes
- −$1,626
- − Insurance
- −$1,630
- − Repairs & maintenance
- −$1,959
- − Management
- −$1,959
- − Depreciation
- −$9,484
- Taxable loss
- −$10,430
- Est. tax savings @ 24.0%
- +$2,503
- After-tax cash flow
- $-1,921/yr
For passive investors: Depreciation is non-cash, so a rental often shows a tax loss while cash-flowing — sheltering income. Rental losses are passive: they offset passive income freely, and up to $25,000/yr can offset ordinary (W-2) income if you actively participate and your MAGI is under $100k (phasing out to $0 by $150k); unused losses carry forward. On sale, claimed depreciation is recaptured at up to 25%, and gains may owe capital-gains tax (a 1031 exchange can defer both). Figures are a year-1 estimate at your 24.0% rate — not tax advice; consult a CPA.
Schools (NCES district)
No district data.
Livability — Borden
- Score
- 61/100
- State rank
- #507
- US rank
- #17982
Category grades
Schools grade is shown separately in the Schools card above.
Census & demographics
- Population (ZIP)
- 4,583
Population outlook (Clark County) Hauer SSP2
- Today (2025)
- 126,401 people
- By 2030
- 131,455 · +4.0%
- By 2040
- 140,471 · +11.1%
- By 2050
- 147,677 · +16.8%
- By 2075
- 161,702 · +27.9%
- By 2100
- 164,078 · +29.8%
Race, ethnicity, and origin ACS 2023
- Neighborhood character
- Predominantly White (95%)
- Race & ethnicity
- White 95% Two or more races 2%
- Common ancestry
- Lithuanian 2% Serbian 2% Italian 2%
- Foreign-born
- 0%
Political lean MEDSL · Clark
- 2024 margin
- Strong R (+20.4) · D 38.9% · R 59.3% · Other 1.8%
- 2008→2024 swing
- -13.3pp toward R · 2008: -7.1pp · 2024: -20.4pp
- All cycles
- 2024: R+20.4 2020: R+18.3 2016: R+22.0 2012: R+9.9 2008: R+7.1
Not yet ingested
- Civics
- —
Market trends
- HPI YoY
- ▲ 21.50%
- Current HPI
- 344.4
- Rent YoY
- —
- Metro
- —
- State GDP YoY
- ▲ 2.90%
- F500 in state
- 18
Industry mix (Fortune 500 HQ in IN)
| Industry | F500 HQs | Revenue |
|---|---|---|
| Industrial Machinery | 2 | $37B |
|
||
| Healthcare | 1 | $177B |
|
||
| Pharmaceuticals | 1 | $45B |
|
||
| Metals / Steel | 1 | $18B |
|
||
| Agriculture | 1 | $17B |
|
||
| Packaging | 1 | $12B |
|
||
Price history
1 event — show timeline
- 2026-04-13 Listed $346,000 SIRA
Property tax history
+5.2%/yrLatest (2024): $1,626 · +14.6% YoY. Source: county tax records.
Cash-flow waterfall
monthlySold comps — $/sqft
last 12 mo · ≤1 miLoading sold comps…