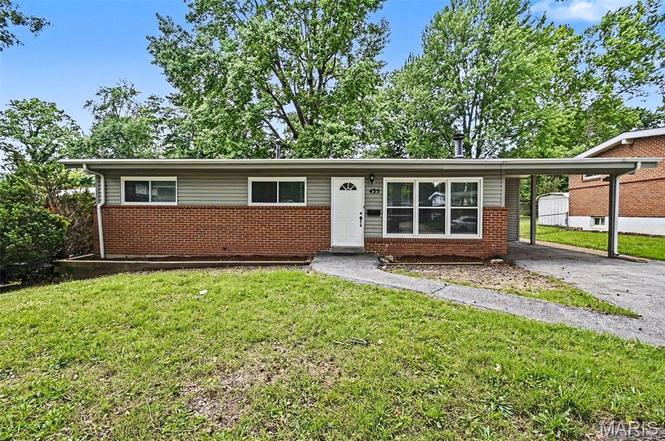
435 Saint Edward Ln · Florissant, MO
Flood risk 1/10 · Minimal
- FEMA flood zone
- X (unshaded)
- Chance of flooding over 30 yrs
- 0.0%
- Est. flood insurance / yr
- $473 – $860
Fire risk 1/10 · Minimal
- Est. fire insurance / yr
- $1,054 – $1,958
Heat risk 4/10 · Minor
- Hot days now (above 105°F)
- 7 days/yr
- Hot days in 30 yrs
- 21 days/yr
Wind risk 2/10 · Minimal
- Chance of severe wind over 30 yrs
- 1.0%
Air-quality risk 3/10 · Minor
- Unhealthy air days now
- 3 days/yr
- Unhealthy air days in 30 yrs
- 5 days/yr
Risk factors via First Street. Map © Google.
Why this score? — see what drove the C+ grade
The composite is a weighted blend of 9 inputs, each scored 0–100. Each bar is that input's sub-score; the figure is the points it added to the 100-point composite (weight × sub-score).
- Cash flow +19.6/30.0
- ARV discount +10.5/15.0
- Appreciation +10.0/10.0
- DSCR +6.2/10.0
- 1% rule +4.7/10.0
- Rent growth +4.4/5.0
- Livability +3.7/5.0
- Condition / age +2.5/5.0
- Schools +1.2/10.0
$169,900
🖨 Deal sheet 📄 Offer letter ✓ Due diligence
Listing remarks MLS
Welcome Home! Freshly updated 3 bedroom in the heart of Florissant is ready for new owners. Vaulted ceilings accentuate an open living room and dining room upon entry. Kitchen has been upgraded with a new electric cooktop, granite countertops and new ceramic tile. Both bathrooms new fixtures, flooring, vanities and lighting. 3 spacious bedroom provide a cozy nights sleep with an additional room in the finished basement as well. Upgraded electric service is supported by a standby generator so you will never be in the dark. Enjoy the beautiful weather under a large covered porch showcasing the back yard. Located near highway access, grocery stores and shopping.
Key facts
- Hardwood flooring
- Walk in closet
- Move in ready
Tags
Property features AI
Finance
- Other: Living area listed as 1,183 (public records)
- Financial info: Lease not considered
Exterior
- Parking: Carport (1 space)
- Utilities: Public water; Public sewer; Electricity available; Natural gas connected; Water connected; Electric service listed as 'Other'
- Home design: Single-family house; One level; Slab foundation
- Construction: Brick and vinyl siding exterior; Composition/shingle roof
- Exterior features: Level lot; Rain gutters; Back yard fencing; No patio or porch listed; Asphalt/paved road frontage (city street)
Interior
- Kitchen: Cooktop; Convection oven; Dishwasher; Refrigerator
- Bedrooms: 3 bedrooms (all on the main level)
- Flooring: Hardwood
- Bathrooms: 1 full bathroom; 1 half bathroom
- Heating & cooling: Natural gas heating; Central air conditioning
- Interior features: Smart thermostat; Basement (other)
- Laundry & utility: Dedicated laundry room
Neighborhood map
What this means for you Summary
Snapshot
- This is a 3-bed/1.5-bath single-family listed at $170k.
Deal economics
- At list price, monthly cash flow is $197 ($2k/yr) — positive.
- The deal already cash-flows at list — no discount required.
- To meet the 1% rule (rent ≥ 1% of price), the offer needs to be $165k (2.9% below list).
- Recommended offer: $165k (2.9% below list) — sets the bar for 1% rule.
- Cap rate 7.7% vs local median 6.3% in Florissant — meaningfully above typical; check what's discounted (condition, days-on-market, listing class) to confirm the premium yield is real.
Location & tenants
- Location reads 73/100 on livability (#82 in MO) — a middle-class / working-renter tenant base. Strengths: cost of living A+, housing A+, health & safety B+; Watch: crime C-, amenities D+, commute F.
- Ferguson-Florissant R-II (suburban): math 7% / reading 20% proficiency, ranked #311 of 324 in MO (top 96%) — low school quality limits family demand, transient renter base, plan for 1-2y turnover; 70% free/reduced lunch — lower-income household profile, screen leases tightly.
- Zoned schools: Combs Elementary (math 7% / reading 17%, grade F, #1,016 of 1,115 statewide, top 92%, 295 students, 99% FRL); Mccluer North High (math 5% / reading 28%, grade F, #487 of 521 statewide, top 93%, 1,136 students, 100% FRL) — zoned schools average 99% FRL vs 70% district-wide (30 pts higher); higher-poverty schools than district average — tighter screening recommended.
- Market conditions: Rents rising fast (+7.5%/yr); 218 active listings in the ZIP; 40 comparable units currently listed for rent nearby; rentals at typical pace (median 24d on market — plan ~3-4 weeks tenant-placement turnaround); 920 units permitted in St. Louis County in 2024 (250 in 5+ unit buildings).
Forward outlook
- In year one you build about $18k of equity ($1k loan paydown + $17k appreciation (10.0% local appreciation)).
- At projected returns (10.0% appreciation + 7.5% rent growth), your $48k cash investment doubles in ~3 years — after that, you're playing with house money.
- By year 3, paydown + projected appreciation supports a ~$46k cash-out refi (75% LTV) — recoverable capital for the next deal without selling this one.
Negotiation context
- Only 1 days on market — expect competitive offers; lowballing is unlikely to land.
- 2 sale attempts since 4y ago with the ask held roughly flat each time — persistent listings suggest the price (not the market) is what's stuck; bring a comps-based counter.
Risks & watch-outs
- Watch-outs: built in 1956 — expect roof / HVAC / electrical / plumbing capex.
Questions for the listing agent
- Built in 1956 — when were the roof, HVAC, electrical panel, plumbing, and water heater last replaced?
- Is there a deadline driving the sale (1031 exchange, divorce, estate, relocation)? That informs how much negotiation room exists.
- Schools are D-rated, which usually means shorter tenancies and higher turnover. Who's the typical renter profile here, and what's been the actual vacancy rate?
- What's the average days-on-market for RENTAL listings here right now (not sales)? A rising rental-DOM trend means longer vacancies and softer asking-rent achievability than the comps imply.
- What's the recent tenant-quality profile in this submarket — average credit score on applications, eviction rate, late-payment / NSF rate, and stable-employment percentage? A property-management company in the area should have these aggregated.
- How much new for-sale + rental construction is in the pipeline within 1–3 miles? Heavy new supply typically softens prices + rents 12–24 months out; constrained supply supports both.
Investment metrics
- 1% rule
- 0.97% ✗
- Cap rate
- 7.69%
- Cash-on-cash
- 4.98%
- DSCR
- 1.22
- GRM
- 8.6
CMA / ARV
- ARV (on-the-fly)
- $182,182
- Comps found
- 12
Show comp detail 12 sales within ~0.75 mi
| Address | Dist | Beds/Ba | Sqft | Sold | Price | $/sf | Match |
|---|---|---|---|---|---|---|---|
| 815 Robinwood Dr | 0.38mi | 3/1.0 | 1,148 (-3%) | 2mo | $179,900 | $157 | 74 |
| 260 Saint Edward Ln | 0.21mi | 3/2.0 | 1,092 (-8%) | 3mo | $170,000 | $156 | 73 |
| 1980 Parker Rd | 0.59mi | 3/1.5 | 1,196 (+1%) | 1mo | $182,157 | $152 | 70 |
| 2740 Holiday Hill Dr | 0.43mi | 3/1.0 | 1,107 (-6%) | 3mo | $99,900 | $90 | 64 |
| 205 Lynn Meadows Ln | 0.50mi | 3/1.0 | 1,104 (-7%) | 1mo | $135,000 | $122 | 62 |
| 1320 Pepperhill Dr | 0.65mi | 3/2.0 | 1,247 (+5%) | 1mo | $200,000 | $160 | 58 |
| 2340 Johnstown Dr | 0.34mi | 3/2.0 | 1,344 (+14%) | 2mo | $119,000 | $89 | 58 |
| 1020 Belmont Ter | 0.48mi | 3/1.5 | 1,040 (-12%) | 4mo | $159,900 | $154 | 54 |
| 1065 Cheyenne Dr | 0.50mi | 3/2.0 | 1,040 (-12%) | 3mo | $172,000 | $165 | 52 |
| 940 Rogers Ln | 0.71mi | 3/2.0 | 1,309 (+11%) | 1mo | $150,000 | $115 | 46 |
| 4 Fremont Ct | 0.71mi | 2/2.0 (-1) | 1,304 (+10%) | 1mo | $135,000 | $104 | 42 |
| 1345 Hialeah Pl | 0.70mi | 4/2.5 (+1) | 1,344 (+14%) | 1mo | $215,000 | $160 | 35 |
Match score weights: distance 35% · size 25% · config 20% · recency 20%. Top-matched comps best support the ARV.
Projected returns pro-forma
10.0% appreciation · 7.51% rent growth · sell at horizon
- IRR
- 29.6%
- Equity multiple
- 3.37×
- Total profit
- $112,900
- Equity at exit
- $153,059
- IRR
- 27.0%
- Equity multiple
- 8.18×
- Total profit
- $341,573
- Equity at exit
- $330,078
Cash invested: $47,572 (down + closing). Projections, not guarantees.
Landlord ↔ Tenant lean methodology
- Overall (STATE)
- 81 Strongly Landlord-Friendly
- State Missouri
- 81 Strongly Landlord-Friendly · R+10
- County
- — inherits STATE
- City
- — inherits STATE
ZIP-level market 63033
- Home prices YoY
- 2.5%
- Rents YoY
- 7.5%
- Active inventory
- 218
- Price-to-rent
- 8.6×
Monthly cashflow live
- Estimated rent
- $1,649 high interval (Pro) →
- Mortgage (P&I)
- −$891
- Tax from tax record
- −$144 /mo · $1,724/yr
- Insurance
- −$71
- HOA
- −$0
- Vacancy / Maint / Mgmt
- −$346
- Net cashflow
- $197
Break-even live
UW: 25.0% down · 7.5% · 30yr · 1.5% tax · 5.0% vac · 8.0% maint · 8.0% mgmt
Financing live
Cash to close
- Down payment
- $42,475
- Closing costs
- $5,097
- Reserves months
- —
- Total cash needed
- —
Loan-product check · same deal, 3 products live
Conventional
25% down · 7.5% · 30yr
- Down + closing
- —
- Monthly P&I
- —
- Monthly cashflow
- —
- DSCR
- —
- Eligible?
- —
Personal DTI + credit; lowest rate.
DSCR
20% down · 8.5% · 30yr
- Down + closing
- —
- Monthly P&I
- —
- Monthly cashflow
- —
- DSCR
- —
- Eligible?
- —
No personal income docs; deal must DSCR.
Hard money
10% down · 12.0% · 12mo
- Down + closing
- —
- Monthly P&I
- —
- Monthly cashflow
- —
- DSCR
- —
- Eligible?
- —
Short-term bridge; refi at stabilization.
Rent comps 40 comps
| Address | Beds | Baths | Sqft | Rent | $/sqft | DOM | Units | Dist |
|---|---|---|---|---|---|---|---|---|
| 410 Ridge Dr Florissant, MO | 3.0 | 2.0 | 1226 | $1,650 | $1.35 | 17d | 1 | 0.09mi |
| 560 Jamaica Pl Florissant, MO | 3.0 | 2.0 | 1350 | $1,653 | $1.22 | 43d | 1 | 0.16mi |
| 20 Saint Benedict Ln Florissant, MO | 3.0 | 1.5 | 1092 | $1,525 | $1.40 | 20d | 1 | 0.16mi |
| 1725 Saint Catherine St Florissant, MO | 3.0 | 1.0 | 1107 | $1,800 | $1.63 | 14d | 1 | 0.23mi |
| 765 Bobbins Ln Florissant, MO | 3.0 | 1.0 | 1107 | $1,450 | $1.31 | 43d | 1 | 0.26mi |
| 297 Saint Eugene Ln Florissant, MO | 2.0 | 1.0 | 1100 | $1,100 | $1.00 | 43d | 1 | 0.30mi |
| 100 Taney Dr Florissant, MO | 3.0 | 1.0 | 1148 | $1,495 | $1.30 | 21d | 1 | 0.31mi |
| 1545 Washington St Florissant, MO | 3.0 | 1.5 | 1337 | $2,055 | $1.54 | 2d | 1 | 0.34mi |
| 790 Pebble Ln Florissant, MO | 3.0 | 2.0 | 1242 | $1,795 | $1.45 | 23d | 1 | 0.35mi |
| 1600 Washington St Florissant, MO | 3.0 | 1.5 | 1095 | $1,250 | $1.14 | 20d | 1 | 0.36mi |
| 1280 Saint Catherine St Florissant, MO | 3.0 | 1.0 | 1274 | $1,600 | $1.26 | 14d | 1 | 0.48mi |
| 1004 N New Florissant Rd Florissant, MO | 2.0 | 1.0 | 719 | $1,375 | $1.91 | 23d | 1 | 0.60mi |
| 1045 N New Florissant Rd Florissant, MO | 2.0 | 1.0 | 783 | $1,250 | $1.60 | 14d | 1 | 0.64mi |
| 50 Lynn Meadows Ln Florissant, MO | 3.0 | 1.0 | 864 | $1,450 | $1.68 | 23d | 1 | 0.71mi |
| 1180 S New Florissant Rd Florissant, MO | 3.0 | 1.0 | 925 | $1,225 | $1.32 | 23d | 1 | 0.76mi |
| 1250 S New Florissant Rd Florissant, MO | 2.0 | 1.0 | 1150 | $1,500 | $1.30 | 14d | 1 | 0.80mi |
| 1465 W Duchesne Dr Florissant, MO | 3.0 | 1.0 | 896 | $1,500 | $1.67 | 43d | 1 | 0.82mi |
| 1050 Ozment Dr Florissant, MO | 3.0 | 2.0 | 984 | $1,525 | $1.55 | 43d | 1 | 0.89mi |
| 17 Valley Dr Florissant, MO | 2.0 | 2.0 | 1356 | $1,525 | $1.12 | 43d | 1 | 0.89mi |
| 1095 Ozment Dr Florissant, MO | 3.0 | 2.0 | 984 | $1,461 | $1.48 | 23d | 1 | 0.91mi |
| 305 S Lafayette St Florissant, MO | 3.0 | 1.0 | 864 | $1,409 | $1.63 | 16d | 1 | 0.95mi |
| 5 Santa Cruz Dr Florissant, MO | 2.0 | 1.0 | 1410 | $1,411 | $1.00 | 16d | 1 | 0.97mi |
| 10 Saint Celeste Dr Florissant, MO | 2.0 | 1.0 | 716 | $1,290 | $1.80 | 12d | 1 | 1.02mi |
| 1670 Arundel Dr Florissant, MO | 3.0 | 2.0 | 1012 | $1,450 | $1.43 | 23d | 1 | 1.03mi |
| 9 Saint Celeste Dr Florissant, MO | 3.0 | 1.0 | 992 | $1,450 | $1.46 | 43d | 1 | 1.06mi |
| 1600 Horseshoe Dr Florissant, MO | 3.0 | 2.0 | 1314 | $1,550 | $1.18 | 43d | 1 | 1.07mi |
| 3 Champlain Ct Florissant, MO | 3.0 | 1.0 | 1100 | $1,600 | $1.45 | 43d | 1 | 1.09mi |
| 135 Saint Maurice Ln Florissant, MO | 3.0 | 1.0 | 816 | $1,395 | $1.71 | 43d | 1 | 1.12mi |
| 24 Barto Dr Saint Louis, MO | 3.0 | 1.0 | 864 | $1,400 | $1.62 | 43d | 1 | 1.16mi |
| 1785 Trotter Way Florissant, MO | 3.0 | 2.0 | 1297 | $1,806 | $1.39 | 7d | 1 | 1.17mi |
| 221 Barto Dr Saint Louis, MO | 3.0 | 2.0 | 958 | $1,295 | $1.35 | 20d | 1 | 1.19mi |
| 36 Connolly Dr Saint Louis, MO | 3.0 | 1.0 | 1024 | $1,149 | $1.12 | 23d | 1 | 1.21mi |
| 220 Du Bourg Ln Florissant, MO | 2.0 | 1.0 | 816 | $1,150 | $1.41 | 43d | 1 | 1.26mi |
| 1502 Summer Run Dr #108 Florissant, MO | 2.0 | 1.5 | 922 | $1,200 | $1.30 | 23d | 1 | 1.27mi |
| 1710 Kay Dr Florissant, MO | 3.0 | 1.0 | 960 | $1,500 | $1.56 | 1d | 1 | 1.28mi |
| 167 Reeb Ln Florissant, MO | 1.0–2.0 | 1.0 | 850 | $1,300 | $1.53 | 1d | 4 | 1.29mi |
| 11 Anistasia Dr Saint Louis, MO | 3.0 | 1.5 | 1120 | $1,345 | $1.20 | 23d | 1 | 1.30mi |
| 155 Reeb Ln Apt 2 Florissant, MO | 2.0 | 1.0 | 850 | $995 | $1.17 | 43d | 1 | 1.30mi |
| 23 Quick Dr Apt 2 Florissant, MO | 2.0 | 1.0 | 850 | $1,100 | $1.29 | 43d | 1 | 1.31mi |
| 21 Quick Dr Apt 3 Florissant, MO | 2.0 | 1.0 | 850 | $995 | $1.17 | 23d | 1 | 1.32mi |
Listing history 2 events
-
2026-06-17remarks 699-char remark
-
2026-06-17$169,900 Active 1 DOM
ⓘ Source: listings_history table (triggers on properties + properties_extension) + one-shot
backfill from property_details.listing_events for pre-trigger history.
Tax reassessment forecast MO · Resets to sale price
- Current annual tax
- $1,724 · $144/mo
- Projected year-2 tax
- $1,724 · $144/mo
- Expected delta
- $0/yr ($0/mo · 0.0%)
ⓘ Screening estimate from a state-policy table — verify with the county assessor before closing.
Climate risk First Street
- Flood 1/10 Low FEMA zone X (unshaded) · 0% chance over 30 yrs
- Wildfire 1/10 Low
- Heat 4/10 Moderate 7 d/yr ≥105°F today · 21 d/yr by 30 yrs out
- Wind 2/10 Low 100% chance of damaging wind over 30 yrs
- Air quality 3/10 Moderate 3 unhealthy d/yr today · 5 by 30 yrs out
Nearby sold comps map
Loading sold comps map…
Walkable amenities ~0.75 mi
Loading nearby amenities…
Taxation est. · year 1
- Rental income
- $19,788
- − Mortgage interest
- −$9,517
- − Property taxes
- −$1,724
- − Insurance
- −$850
- − Repairs & maintenance
- −$1,583
- − Management
- −$1,583
- − Depreciation
- −$4,943
- Taxable loss
- −$411
- Est. tax savings @ 24.0%
- +$99
- After-tax cash flow
- $2,466/yr
For passive investors: Depreciation is non-cash, so a rental often shows a tax loss while cash-flowing — sheltering income. Rental losses are passive: they offset passive income freely, and up to $25,000/yr can offset ordinary (W-2) income if you actively participate and your MAGI is under $100k (phasing out to $0 by $150k); unused losses carry forward. On sale, claimed depreciation is recaptured at up to 25%, and gains may owe capital-gains tax (a 1031 exchange can defer both). Figures are a year-1 estimate at your 24.0% rate — not tax advice; consult a CPA.
Schools (NCES district)
- District
- Ferguson-Florissant R-II
- NCES district ID
- 2912010
- Math proficiency
- 7% ▼ -9.00%
- Reading proficiency
- 20% ▼ -6.00%
- Median HH income
- $44,610
- Composite
- 11.96/100
- National rank
- #9666
- State rank
- #311 of 324 in MO
Livability — Florissant
- Score
- 73/100
- State rank
- #82
- US rank
- #5406
Category grades
Schools grade is shown separately in the Schools card above.
Census & demographics
- Census place
- Florissant, MO
- County
- Saint Louis County · 888,823 people
- City population
- 69,104
- Metro
- St. Louis, MO-IL
- Population (ZIP)
- 43,056
- Household income
- $66,776
- Rent vs Own
- Severe rent burden
- 1429.0
Population outlook (St. Louis County) Hauer SSP2
- Today (2025)
- 1,025,227 people
- By 2030
- 1,028,023 · +0.3%
- By 2040
- 1,020,940 · -0.4%
- By 2050
- 1,007,280 · -1.8%
- By 2075
- 987,277 · -3.7%
- By 2100
- 921,984 · -10.1%
Race, ethnicity, and origin ACS 2023
- Neighborhood character
- Predominantly Black (71%)
- Race & ethnicity
- Black 71% White 23% Two or more races 4% Hispanic / Latino 1%
- Common ancestry
- Romanian 1% Lithuanian 1% Italian 1%
- Foreign-born
- 3% · Canada, Vietnam
- Languages at home
- 95% English-only · Spanish 1% French/Haitian/Cajun 1%
Political lean MEDSL · St. Louis
- 2024 margin
- Strong D (+23.4) · D 60.8% · R 37.4% · Other 1.7%
- 2008→2024 swing
- +3.5pp toward D · 2008: 19.9pp · 2024: 23.4pp
- All cycles
- 2024: D+23.4 2020: D+24.0 2016: D+16.2 2012: D+13.7 2008: D+19.9
Not yet ingested
- Civics
- —
Market trends
- HPI YoY
- ▲ 13.78%
- Current HPI
- 570.6
- Rent YoY
- ▲ 7.51%
- Metro
- St. Louis, MO-IL
- State GDP YoY
- ▲ 1.84%
- F500 in state
- 20
Industry mix (Fortune 500 HQ in MO)
| Industry | F500 HQs | Revenue |
|---|---|---|
| Healthcare | 1 | $163B |
|
||
| Insurance | 1 | $21B |
|
||
| Industrial Technology | 1 | $17B |
|
||
| Retail | 1 | $16B |
|
||
| Industrial Distribution | 1 | $10B |
|
||
| Utilities | 1 | $9B |
|
||
Price history
+208.9% since first listed10 events — show timeline
- 2026-06-17 Listed $169,900 MARIS as Distributed by MLS Grid
- 2022-12-22 Rental Removed — RENT.
- 2022-07-22 Sold (Public Records) $210,000 Public Records
- 2022-07-18 Pending — MARIS as Distributed by MLS Grid
- 2022-07-15 Sold (MLS) — MARIS as Distributed by MLS Grid
- 2022-06-19 Contingent — MARIS as Distributed by MLS Grid
- 2022-06-10 Listed $208,000 MARIS as Distributed by MLS Grid
- 2022-06-09 Coming Soon $208,000 MARIS as Distributed by MLS Grid
- 2021-11-23 Sold (Public Records) $103,000 Public Records
- 1992-03-10 Sold (Public Records) $55,000 Public Records
Property tax history
+0.5%/yrLatest (2022): $1,724 · +1.7% YoY. Source: county tax records.
Cash-flow waterfall
monthlySold comps — $/sqft
last 12 mo · ≤1 miLoading sold comps…