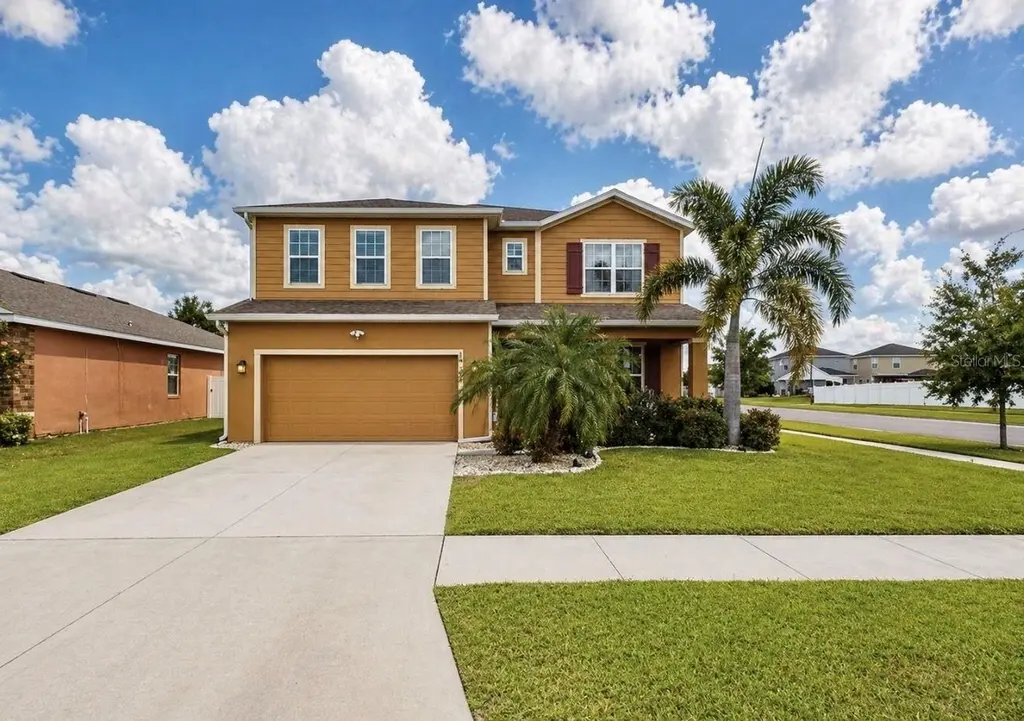
14146 Poke Ridge Dr · Riverview, FL
Flood risk 1/10 · Minimal
- FEMA flood zone
- X (unshaded)
- Chance of flooding over 30 yrs
- 0.0%
- Est. flood insurance / yr
- $507 – $1,088
Fire risk 4/10 · Minor
- Est. fire insurance / yr
- $947 – $1,759
Heat risk 10/10 · Severe
- Hot days now (above 109°F)
- 7 days/yr
- Hot days in 30 yrs
- 25 days/yr
Wind risk 10/10 · Severe
- Chance of severe wind over 30 yrs
- 99.0%
Air-quality risk 3/10 · Minor
- Unhealthy air days now
- 3 days/yr
- Unhealthy air days in 30 yrs
- 3 days/yr
Risk factors via First Street. Map © Google.
Why this score? — see what drove the D- grade
The composite is a weighted blend of 9 inputs, each scored 0–100. Each bar is that input's sub-score; the figure is the points it added to the 100-point composite (weight × sub-score).
- Cash flow +8.9/30.0
- ARV discount +7.5/15.0
- Appreciation +4.3/10.0
- Schools +4.2/10.0
- Livability +4.0/5.0
- Rent growth +2.8/5.0
- DSCR +2.5/10.0
- Condition / age +2.5/5.0
- 1% rule +2.1/10.0
$449,999
🖨 Deal sheet 📄 Offer letter ✓ Due diligence
Listing remarks
Welcome to this spacious & beautifully upgraded home located on a premium corner lot with an oversized back yard in the highly sought-after Carlton Lakes community of Riverview! Offering 5 bedrooms, 2.5 bathrooms, and over 2,800 square feet, this 3-car garage home blends functionality, flexibility, and outdoor living at its finest. Meticulously cared for, the sellers have done a pre-listing inspection and have a clear Four Point inspection report for the buyer's peace of mind and insurance on this stunning property. Step inside to soaring 9-foot ceilings, 8-foot doors, and a thoughtfully designed floor plan featuring a dedicated office/den (currently configured as a 4-bedroom + office
Key facts
- 0.28 acre lot
- 3 garage spots
- Community pool
Property features AI
Finance
- Other: CDD present; Homestead exemption indicated
- Financial info: Other annual assessment: $3,022
- HOA & community: Has HOA (Inframark Community Management); HOA dues required: $132 annually ($11/month); Community clubhouse, fitness center, pool, playground; Community mailbox, sidewalks, street lights; Deed restrictions; Pets allowed
Exterior
- Parking: Driveway; Garage door opener; Tandem garage; 3-car attached garage
- Security: Hurricane shutters
- Utilities: Public water; Public sewer; Electricity available; Underground utilities; Water available; Irrigation equipment
- Home design: Single family residence; Two levels; Faces west; Residential zoning (PD)
- Construction: Block and stucco construction; Shingle roof; Slab foundation; Built with landscaped trees/vegetation
- Exterior features: Covered, enclosed and screened porch areas; Front porch and wrap-around porch; Patio; Sliding doors; Hurricane shutters; Rain gutters; Sidewalks
Interior
- Kitchen: Convection oven; Cooktop; Dishwasher; Disposal; Microwave; Refrigerator
- Bedrooms: 5 bedrooms
- Flooring: Carpet; Ceramic tile
- Bathrooms: 2 full bathrooms; 1 half bathroom
- Heating & cooling: Central heating; Central air
- Interior features: Ceiling fans; Dry bar; Eat-in kitchen; High ceilings; Kitchen/family room combo; Open floorplan; Solid surface and stone counters; Solid wood cabinets; Thermostat; Tray ceilings; Walk-in closets; Window treatments; Blinds; Double-pane windows
- Laundry & utility: Washer and dryer hookups; Electric dryer hookup; Inside laundry room on upper level; Water softener; Electric water heater
Neighborhood map
What this means for you Summary
Snapshot
- This is a 5-bed/3.0-bath single-family listed at $450k.
Deal economics
- At list price, monthly cash flow is $-362 ($-4k/yr) — negative.
- To cash-flow at today's rent, offer at most $386k (14.2% below list).
- To meet the 1% rule (rent ≥ 1% of price), the offer needs to be $319k (29.1% below list).
- Recommended offer: $319k (29.1% below list) — sets the bar for 1% rule.
Location & tenants
- Location reads 79/100 on livability (#134 in FL, #2,000 nationally) — a middle-class / working-renter tenant base. Strengths: housing A+, health & safety A+, employment B+; Watch: amenities F.
- Hillsborough (suburban): math 47% / reading 50% proficiency, ranked #41 of 73 in FL (top 56%) — families likely to look elsewhere, expect single-tenant / working-renter base with shorter leases.
- Zoned schools: Jule F Sumner High School (math 43% / reading 43%, grade F, #255 of 667 statewide, top 39%, 3,827 students, 43% FRL).
- Market conditions: Rents rising (+1.2%/yr); 457 active listings in the ZIP; 24 comparable units currently listed for rent nearby; rentals at typical pace (median 25d on market — plan ~3-4 weeks tenant-placement turnaround); high-income renter base; 9,053 units permitted in Hillsborough County in 2024 (4,555 in 5+ unit buildings).
- This rent runs 33% of the median local income ($116k/yr) — at the standard rent-burdened threshold; future hikes will face affordability resistance.
Forward outlook
- Local home prices are declining (-1.4%/yr); year-one equity from $3k of loan paydown is wiped out by about $6k of value loss. Plan a longer hold.
- Hillsborough County population projected at +37% by 2050 — long-run rental-demand tailwind backs the buy-and-hold thesis.
Negotiation context
- Only 7 days on market — expect competitive offers; lowballing is unlikely to land.
- Current owner paid $150k; list at $450k implies a 200% gain — meaningful room to come down on a strong offer.
Risks & watch-outs
- Climate carrying-cost: severe wind risk, 99% chance of damaging wind over 30y; extreme-heat days projected 7→25/yr by 2055 (HVAC capex compounding) — expect insurance premiums to compound above CPI over the hold.
Questions for the listing agent
- What do current leases actually rent for vs. the listed asking? Can we see a recent rent roll and the last 12 months of T-12 income?
- What does the HOA fee cover, when was the last increase, and are there any pending special assessments or reserve-fund shortfalls?
- Is there a deadline driving the sale (1031 exchange, divorce, estate, relocation)? That informs how much negotiation room exists.
- Schools are B-rated — typically a magnet for longer-tenancy family renters. What's the average tenant stay here, and is there a school-zone premium baked into asking?
- The area grade is low — what's the realistic commute time and amenity access for the typical tenant pool here? Any planned neighborhood developments (good or bad) we should know about?
- What's the average days-on-market for RENTAL listings here right now (not sales)? A rising rental-DOM trend means longer vacancies and softer asking-rent achievability than the comps imply.
- What's the recent tenant-quality profile in this submarket — average credit score on applications, eviction rate, late-payment / NSF rate, and stable-employment percentage? A property-management company in the area should have these aggregated.
- How much new for-sale + rental construction is in the pipeline within 1–3 miles? Heavy new supply typically softens prices + rents 12–24 months out; constrained supply supports both.
Investment metrics
- 1% rule
- 0.71% ✗
- Cap rate
- 5.33%
- Cash-on-cash
- -3.45%
- DSCR
- 0.85
- GRM
- 11.7
CMA / ARV
No comps found within radius.
Projected returns pro-forma
-1.42% appreciation · 1.18% rent growth · sell at horizon
- IRR
- -13.9%
- Equity multiple
- 0.43×
- Total profit
- $-71,264
- Equity at exit
- $99,600
- IRR
- -8.6%
- Equity multiple
- 0.31×
- Total profit
- $-86,765
- Equity at exit
- $97,079
Cash invested: $126,000 (down + closing). Projections, not guarantees.
Landlord ↔ Tenant lean methodology
- Overall (STATE)
- 87 Strongly Landlord-Friendly
- State Florida
- 87 Strongly Landlord-Friendly · R+3
- County
- — inherits STATE
- City
- — inherits STATE
ZIP-level market 33579
- Home prices YoY
- -0.6%
- Rents YoY
- 1.2%
- Active inventory
- 457
- Price-to-rent
- 11.7×
Monthly cashflow live
- Estimated rent
- $3,192 high interval (Pro) →
- Mortgage (P&I)
- −$2,360
- Tax from tax record
- −$326 /mo · $3,910/yr
- Insurance
- −$187
- HOA
- −$11
- Vacancy / Maint / Mgmt
- −$670
- Net cashflow
- $-362
Break-even live
UW: 25.0% down · 7.5% · 30yr · 1.5% tax · 5.0% vac · 8.0% maint · 8.0% mgmt
Financing live
Cash to close
- Down payment
- $112,500
- Closing costs
- $13,500
- Reserves months
- —
- Total cash needed
- —
Loan-product check · same deal, 3 products live
Conventional
25% down · 7.5% · 30yr
- Down + closing
- —
- Monthly P&I
- —
- Monthly cashflow
- —
- DSCR
- —
- Eligible?
- —
Personal DTI + credit; lowest rate.
DSCR
20% down · 8.5% · 30yr
- Down + closing
- —
- Monthly P&I
- —
- Monthly cashflow
- —
- DSCR
- —
- Eligible?
- —
No personal income docs; deal must DSCR.
Hard money
10% down · 12.0% · 12mo
- Down + closing
- —
- Monthly P&I
- —
- Monthly cashflow
- —
- DSCR
- —
- Eligible?
- —
Short-term bridge; refi at stabilization.
Rent comps 24 comps
| Address | Beds | Baths | Sqft | Rent | $/sqft | DOM | Units | Dist |
|---|---|---|---|---|---|---|---|---|
| 14112 Poke Ridge Dr Riverview, FL | 5.0 | 3.5 | 3467 | $3,200 | $0.92 | 24d | 1 | 0.19mi |
| 11201 Hudson Hills Ln Riverview, FL | 5.0 | 2.5 | 2254 | $2,450 | $1.09 | 15d | 1 | 0.22mi |
| 14153 Arbor Pines Dr Riverview, FL | 5.0 | 2.5 | 2889 | $3,586 | $1.24 | 24d | 1 | 0.31mi |
| 11167 Leland Groves Dr Riverview, FL | 5.0 | 3.0 | 2526 | $3,500 | $1.39 | 24d | 1 | 0.38mi |
| 11176 Leland Groves Dr Riverview, FL | 4.0 | 2.5 | 2318 | $2,700 | $1.16 | 5d | 1 | 0.38mi |
| 11510 Harlan Eddy Ct Riverview, FL | 4.0 | 2.0 | 2351 | $2,700 | $1.15 | 24d | 1 | 0.61mi |
| 13655 Artesa Bell Dr Riverview, FL | 4.0 | 3.0 | 2351 | $3,075 | $1.31 | 5d | 1 | 0.64mi |
| 10638 Aldo Moro Dr Wimauma, FL | 4.0 | 2.5 | 2803 | $2,800 | $1.00 | 24d | 1 | 0.73mi |
| 13714 Artesa Bell Dr Riverview, FL | 4.0 | 4.5 | 3453 | $3,300 | $0.96 | 24d | 1 | 0.73mi |
| 11211 Flora Springs Dr Riverview, FL | 5.0 | 3.0 | 2320 | $2,723 | $1.17 | 24d | 1 | 0.80mi |
| 10614 Shady Branch Dr Riverview, FL | 4.0 | 2.5 | 2482 | $2,286 | $0.92 | 14d | 1 | 0.86mi |
| 11009 Golden Silence Dr Riverview, FL | 4.0 | 2.5 | 2154 | $2,800 | $1.30 | 24d | 1 | 0.96mi |
| 14435 Barley Field Dr Wimauma, FL | 4.0 | 2.0 | 2046 | $2,231 | $1.09 | 14d | 1 | 1.11mi |
| 14437 Barley Field Dr Wimauma, FL | 4.0 | 2.5 | 2280 | $2,296 | $1.01 | 24d | 1 | 1.12mi |
| 13423 Beechberry Dr Riverview, FL | 4.0 | 2.5 | 2322 | $2,800 | $1.21 | 3d | 1 | 1.13mi |
| 11618 Ashton Field Ave Riverview, FL | 4.0 | 3.0 | 2114 | $2,600 | $1.23 | 14d | 1 | 1.25mi |
| 11519 Misty Isle Ln Riverview, FL | 4.0 | 2.0 | 1936 | $2,600 | $1.34 | 24d | 1 | 1.29mi |
| 11721 Sunburst Marble Rd Riverview, FL | 5.0 | 3.0 | 3704 | $3,200 | $0.86 | 24d | 1 | 1.34mi |
| 10505 Opus Dr Riverview, FL | 4.0 | 2.5 | 1942 | $2,550 | $1.31 | 24d | 1 | 1.36mi |
| 11716 Navajo Sandstone St Riverview, FL | 4.0 | 2.5 | 2450 | $2,900 | $1.18 | 5d | 1 | 1.42mi |
| 11328 Misty Isle Ln Riverview, FL | 4.0 | 3.5 | 2532 | $2,600 | $1.03 | 10d | 1 | 1.45mi |
| 11412 Misty Isle Ln Riverview, FL | 5.0 | 4.0 | 2523 | $3,200 | $1.27 | 24d | 1 | 1.46mi |
| 10220 Newminster Loop Ruskin, FL | 4.0 | 2.5 | 2483 | $2,315 | $0.93 | 15d | 1 | 1.47mi |
| 10904 Summerton Dr Riverview, FL | 4.0 | 3.0 | 2977 | $3,150 | $1.06 | 3d | 1 | 1.48mi |
HOA detail
- Monthly dues
- $11 · $132/yr
Listing history 3 events
-
2026-05-06status Pending
-
2026-04-29$449,999 Active
-
2019-06-13soldstatus $150,000
ⓘ Source: listings_history table (triggers on properties + properties_extension) + one-shot
backfill from property_details.listing_events for pre-trigger history.
Tax reassessment forecast FL · Resets to sale price
- Current annual tax
- $3,910 · $326/mo
- Projected year-2 tax
- $3,910 · $326/mo
- Expected delta
- $0/yr ($0/mo · 0.0%)
ⓘ Screening estimate from a state-policy table — verify with the county assessor before closing.
Climate risk First Street
- Flood 1/10 Low FEMA zone X (unshaded) · 0% chance over 30 yrs
- Wildfire 4/10 Moderate
- Heat 10/10 Extreme 7 d/yr ≥109°F today · 25 d/yr by 30 yrs out
- Wind 10/10 Extreme 99% chance of damaging wind over 30 yrs
- Air quality 3/10 Moderate 3 unhealthy d/yr today · 3 by 30 yrs out
Nearby sold comps map
Loading sold comps map…
Walkable amenities ~0.75 mi
Loading nearby amenities…
Taxation est. · year 1
- Rental income
- $38,309
- − Mortgage interest
- −$25,207
- − Property taxes
- −$3,910
- − Insurance
- −$2,250
- − Repairs & maintenance
- −$3,065
- − Management
- −$3,065
- − HOA
- −$132
- − Depreciation
- −$13,091
- Taxable loss
- −$12,410
- Est. tax savings @ 24.0%
- +$2,978
- After-tax cash flow
- $-1,367/yr
For passive investors: Depreciation is non-cash, so a rental often shows a tax loss while cash-flowing — sheltering income. Rental losses are passive: they offset passive income freely, and up to $25,000/yr can offset ordinary (W-2) income if you actively participate and your MAGI is under $100k (phasing out to $0 by $150k); unused losses carry forward. On sale, claimed depreciation is recaptured at up to 25%, and gains may owe capital-gains tax (a 1031 exchange can defer both). Figures are a year-1 estimate at your 24.0% rate — not tax advice; consult a CPA.
Schools (NCES district)
- District
- Hillsborough
- NCES district ID
- 1200870
- Math proficiency
- 47% ▼ -8.00%
- Reading proficiency
- 50% ▼ -4.00%
- Median HH income
- $50,622
- Composite
- 41.6/100
- National rank
- #3435
- State rank
- #41 of 73 in FL
Livability — Riverview
- Score
- 79/100
- State rank
- #134
- US rank
- #2000
Category grades
Schools grade is shown separately in the Schools card above.
Census & demographics
- Census place
- Riverview, FL
- County
- Hillsborough County · 1,540,968 people
- City population
- 137,988
- Metro
- Tampa-St. Petersburg-Clearwater, FL
- Population (ZIP)
- 49,470
- Household income
- $116,134
- Rent vs Own
- Severe rent burden
- 258.0
Population outlook (Hillsborough County) Hauer SSP2
- Today (2025)
- 1,607,022 people
- By 2030
- 1,733,968 · +7.9%
- By 2040
- 1,979,565 · +23.2%
- By 2050
- 2,203,427 · +37.1%
- By 2075
- 2,667,893 · +66.0%
- By 2100
- 2,891,558 · +79.9%
Race, ethnicity, and origin ACS 2023
- Neighborhood character
- Highly diverse neighborhood (Simpson 0.71)
- Race & ethnicity
- White 42% Hispanic / Latino 25% Black 24% Two or more races 19% Asian 5%
- Hispanic origin (detail)
- Mexican 3% Puerto Rican 12% Cuban 3% Dominican 1%
- Common ancestry
- Hispanic 1% British 1% Romanian 1%
- Foreign-born
- 17% · Canada, Jamaica, China
- Languages at home
- 73% English-only · Spanish 19% Other Indo-European 2% French/Haitian/Cajun 1%
Political lean MEDSL · Hillsborough
- 2024 margin
- Toss-up / Even · D 47.8% · R 50.9% · Other 1.3%
- 2008→2024 swing
- -10.2pp toward R · 2008: 7.1pp · 2024: -3.1pp
- All cycles
- 2024: R+3.1 2020: D+6.9 2016: D+6.8 2012: D+6.7 2008: D+7.1
Not yet ingested
- Civics
- —
Market trends
- HPI YoY
- ▼ -1.42%
- Current HPI
- 240.5825
- Rent YoY
- ▲ 1.18%
- Metro
- Tampa-St. Petersburg-Clearwater, FL
- State GDP YoY
- ▲ 3.28%
- F500 in state
- 36
Industry mix (Fortune 500 HQ in FL)
| Industry | F500 HQs | Revenue |
|---|---|---|
| Industrial Technology | 2 | $29B |
|
||
| Insurance | 2 | $17B |
|
||
| Retail | 1 | $60B |
|
||
| Technology Distribution | 1 | $58B |
|
||
| Homebuilding | 1 | $35B |
|
||
| Technology Manufacturing | 1 | $35B |
|
||
Price history
+200.0% since first listed3 events — show timeline
- 2026-05-06 Pending — Stellar MLS as Distributed by MLS Grid
- 2026-04-29 Listed $449,999 Stellar MLS as Distributed by MLS Grid
- 2019-06-13 Sold (Public Records) $150,000 Public Records
Property tax history
+25.2%/yrLatest (2025): $3,910 · -53.2% YoY. Source: county tax records.
Cash-flow waterfall
monthlySold comps — $/sqft
last 12 mo · ≤1 miLoading sold comps…