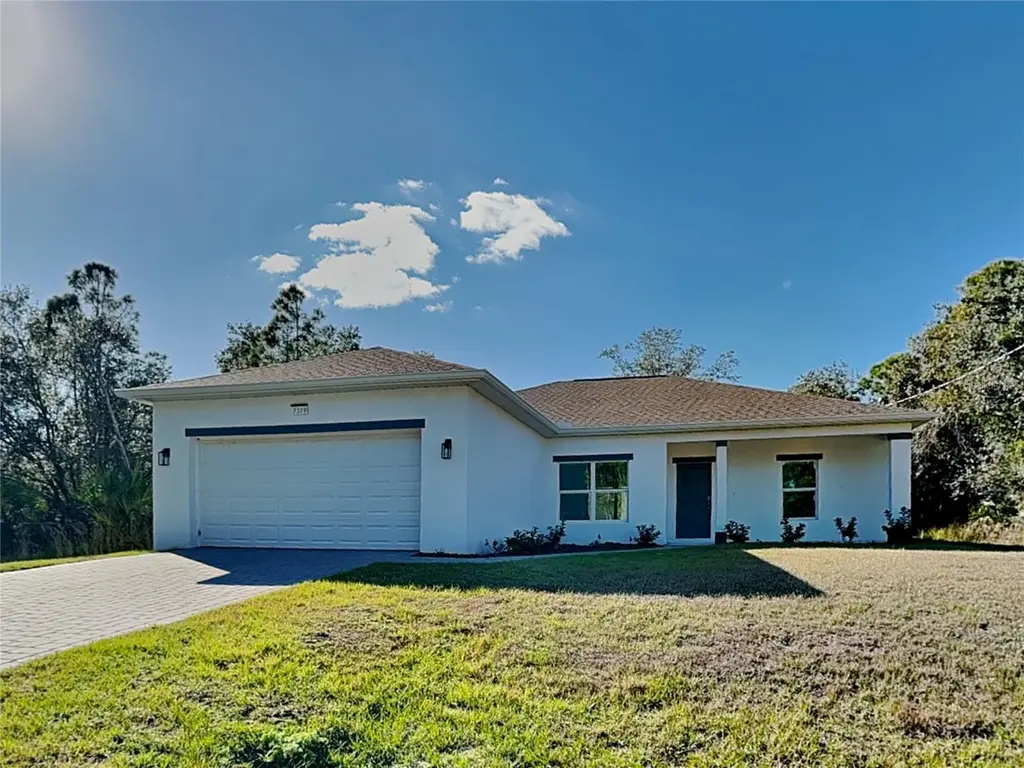
5281 Gillot Blvd · North Port, FL
Flood risk 7/10 · Major
- FEMA flood zone
- X (shaded)
- Chance of flooding over 30 yrs
- 0.94%
- Est. flood insurance / yr
- $507 – $1,088
Fire risk 1/10 · Minimal
- Est. fire insurance / yr
- $947 – $1,759
Heat risk 10/10 · Severe
- Hot days now (above 107°F)
- 7 days/yr
- Hot days in 30 yrs
- 29 days/yr
Wind risk 10/10 · Severe
- Chance of severe wind over 30 yrs
- 99.0%
Air-quality risk 3/10 · Minor
- Unhealthy air days now
- 2 days/yr
- Unhealthy air days in 30 yrs
- 3 days/yr
Risk factors via First Street. Map © Google.
Why this score? — see what drove the D- grade
The composite is a weighted blend of 9 inputs, each scored 0–100. Each bar is that input's sub-score; the figure is the points it added to the 100-point composite (weight × sub-score).
- Cash flow +10.8/30.0
- ARV discount +7.5/15.0
- Schools +4.6/10.0
- Rent growth +3.8/5.0
- Livability +3.8/5.0
- 1% rule +3.2/10.0
- DSCR +3.1/10.0
- Condition / age +2.5/5.0
- Appreciation +0.0/10.0
$289,900
🖨 Deal sheet (PDF) 📄 Offer letter ✓ Due diligence
Listing remarks MLS
Great lot in desirable area of Gulf Cove. Adjacent lot 23 also available. Close to beaches, shopping and schools.
Key facts
- Two walk in closets
- 0.23 acre lot
- 2 garage spots
Tags
Property features AI
Finance
- Other: Zoning: RSF3.5
- HOA & community: No HOA / association indicated
Exterior
- Parking: Attached garage; 2-car garage
- Utilities: Well water; Septic tank; Cable available; Electricity available; Water available
- Home design: Single family residence; Residential property; New construction; One story; East facing entry
- Construction: Stucco construction; Shingle roof; Slab foundation; Completed condition; Built with approximately 1548 sq ft living area
- Exterior features: Irrigation equipment; Asphalt road access
Interior
- Kitchen: Microwave; Range; Refrigerator
- Bedrooms: 3 bedrooms
- Bathrooms: 2 full bathrooms
- Heating & cooling: Electric heating; Central air conditioning
- Interior features: Ceiling fans; High ceilings; Kitchen/family room combo; Thermostat
- Laundry & utility: Washer hookup; Electric dryer hookup; Laundry inside; Electric water heater
Neighborhood map
What this means for you Summary
Snapshot
- This is a 3-bed/2.0-bath land listed at $290k.
Deal economics
- At list price, monthly cash flow is $-200 ($-2k/yr) — negative.
- To cash-flow at today's rent, offer at most $261k (10.0% below list).
- To meet the 1% rule (rent ≥ 1% of price), the offer needs to be $237k (18.3% below list).
- Recommended offer: $237k (18.3% below list) — sets the bar for 1% rule.
- Cap rate 5.7% vs local median 3.8% in North Port — top-decile yield for the area; either an underpriced asset or a hidden risk that comps aren't pricing in. Stress-test before assuming the spread holds.
Location & tenants
- Location reads 75/100 on livability (#252 in FL, #3,975 nationally) — a middle-class / working-renter tenant base. Strengths: crime A+, housing A+, health & safety A+; Watch: amenities F, commute F.
- Charlotte (suburban): math 54% / reading 54% proficiency, ranked #22 of 73 in FL (top 30%) — acceptable for families but not a draw, mixed tenant base, ~2y average lease.
- Zoned schools: Myakka River Elementary School (math 65% / reading 60%, grade B, #601 of 2,144 statewide, top 28%, 608 students, 51% FRL); L. A. Ainger Middle School (math 65% / reading 53%, grade B, #144 of 571 statewide, top 26%, 720 students, 40% FRL); Lemon Bay High School (math 50% / reading 56%, grade C-, #148 of 667 statewide, top 23%, 1,360 students, 28% FRL).
- Market conditions: Rents rising fast (+5.3%/yr); 2198 active listings in the ZIP; 21 comparable units currently listed for rent nearby; rentals at typical pace (median 23d on market — plan ~3-4 weeks tenant-placement turnaround); solid renter incomes; 4,585 units permitted in Charlotte County in 2024 (703 in 5+ unit buildings).
- This rent runs 34% of the median local income ($84k/yr) — at the standard rent-burdened threshold; future hikes will face affordability resistance.
Forward outlook
- Local home prices are declining (-3.0%/yr); year-one equity from $2k of loan paydown is wiped out by about $9k of value loss. Plan a longer hold.
- Charlotte County population projected at +24% by 2050 — long-run rental-demand tailwind backs the buy-and-hold thesis.
Negotiation context
- It's been on market 30 days — a 2% lower offer ($286k) is reasonable based on typical stale-listing flexibility.
- 8 sale attempts since 22y ago with the ask held roughly flat each time — persistent listings suggest the price (not the market) is what's stuck; bring a comps-based counter.
Risks & watch-outs
- Watch-outs: flood insurance adds $66/mo.
- Climate carrying-cost: major flood risk; severe wind risk, 99% chance of damaging wind over 30y; extreme-heat days projected 7→29/yr by 2055 (HVAC capex compounding) — expect insurance premiums to compound above CPI over the hold.
Questions for the listing agent
- What do current leases actually rent for vs. the listed asking? Can we see a recent rent roll and the last 12 months of T-12 income?
- What's the actual annual flood-insurance premium (NFIP or private), and is the property in a SFHA with mandatory coverage?
- Is there a deadline driving the sale (1031 exchange, divorce, estate, relocation)? That informs how much negotiation room exists.
- Schools are B-rated — typically a magnet for longer-tenancy family renters. What's the average tenant stay here, and is there a school-zone premium baked into asking?
- The area grade is low — what's the realistic commute time and amenity access for the typical tenant pool here? Any planned neighborhood developments (good or bad) we should know about?
- What's the average days-on-market for RENTAL listings here right now (not sales)? A rising rental-DOM trend means longer vacancies and softer asking-rent achievability than the comps imply.
- What's the recent tenant-quality profile in this submarket — average credit score on applications, eviction rate, late-payment / NSF rate, and stable-employment percentage? A property-management company in the area should have these aggregated.
- How much new for-sale + rental construction is in the pipeline within 1–3 miles? Heavy new supply typically softens prices + rents 12–24 months out; constrained supply supports both.
Investment metrics
- 1% rule
- 0.82% ✗
- Cap rate
- 5.74%
- Cash-on-cash
- -1.97%
- DSCR
- 0.91
- GRM
- 10.2
CMA / ARV
No comps found within radius.
Projected returns pro-forma
-3.0% appreciation · 5.29% rent growth · sell at horizon
- IRR
- -18.6%
- Equity multiple
- 0.33×
- Total profit
- $-54,044
- Equity at exit
- $43,225
- IRR
- -6.9%
- Equity multiple
- 0.52×
- Total profit
- $-39,141
- Equity at exit
- $25,065
Cash invested: $81,172 (down + closing). Projections, not guarantees.
Landlord ↔ Tenant lean methodology
- Overall (STATE)
- 87 Strongly Landlord-Friendly
- State Florida
- 87 Strongly Landlord-Friendly · R+3
- County
- — inherits STATE
- City
- — inherits STATE
ZIP-level market 33981
- Home prices YoY
- -7.5%
- Rents YoY
- 5.3%
- Active inventory
- 2198
- Price-to-rent
- 10.2×
Monthly cashflow live
- Estimated rent
- $2,367 high interval (Pro) →
- Mortgage (P&I)
- −$1,520
- Tax est. 1.5%
- −$362 /mo · $4,348/yr
- Insurance
- −$121
- Flood insurance flood zone
- −$66 /mo · $798/yr
- HOA
- −$0
- Vacancy / Maint / Mgmt
- −$497
- Net cashflow
- $-200
Break-even live
Sensitivity live
| Price | -10% $1 | -5% $-100 | +0% $-200 | +5% $-300 | +10% $-400 |
|---|---|---|---|---|---|
| Rent | -10% $-387 | -5% $-293 | +0% $-200 | +5% $-106 | +10% $-13 |
| Rate | -1.0pp $-54 | -0.5pp $-126 | base $-200 | +0.5pp $-275 | +1.0pp $-351 |
UW: 25.0% down · 7.5% · 30yr · 1.5% tax · 5.0% vac · 8.0% maint · 8.0% mgmt
Financing live
Cash to close
- Down payment
- $72,475
- Closing costs
- $8,697
- Reserves months
- —
- Total cash needed
- —
Loan-product check · same deal, 3 products live
Conventional
25% down · 7.5% · 30yr
- Down + closing
- —
- Monthly P&I
- —
- Monthly cashflow
- —
- DSCR
- —
- Eligible?
- —
Personal DTI + credit; lowest rate.
DSCR
20% down · 8.5% · 30yr
- Down + closing
- —
- Monthly P&I
- —
- Monthly cashflow
- —
- DSCR
- —
- Eligible?
- —
No personal income docs; deal must DSCR.
Hard money
10% down · 12.0% · 12mo
- Down + closing
- —
- Monthly P&I
- —
- Monthly cashflow
- —
- DSCR
- —
- Eligible?
- —
Short-term bridge; refi at stabilization.
Rent comps 21 comps
| Address | Beds | Baths | Sqft | Rent | $/sqft | DOM | Units | Dist |
|---|---|---|---|---|---|---|---|---|
| 6464 David Blvd Port Charlotte, FL | 3.0 | 2.0 | 1613 | $1,716 | $1.06 | 23d | 1 | 0.37mi |
| 5498 Montego Ln Port Charlotte, FL | 2.0 | 2.0 | 1070 | $1,695 | $1.58 | 23d | 1 | 0.39mi |
| 5311 Levy Ln Port Charlotte, FL | 3.0 | 2.0 | 1192 | $1,850 | $1.55 | 15d | 1 | 0.39mi |
| 5496 Brussels Ter Port Charlotte, FL | 3.0 | 2.0 | 1400 | $3,900 | $2.79 | 23d | 1 | 0.46mi |
| 12129 Grosspoint Ave Port Charlotte, FL | 3.0 | 2.0 | 1388 | $2,300 | $1.66 | 23d | 1 | 0.76mi |
| 13184 Eureka Cir Port Charlotte, FL | 3.0 | 2.0 | 1640 | $2,300 | $1.40 | 23d | 1 | 0.79mi |
| 13280 Foresman Blvd Port Charlotte, FL | 3.0 | 2.0 | 1500 | $2,800 | $1.87 | 15d | 1 | 0.87mi |
| 6795 David Blvd Apt A Port Charlotte, FL | 2.0 | 1.0 | 1127 | $1,375 | $1.22 | 23d | 1 | 0.88mi |
| 12174 Terkelsen Ave Port Charlotte, FL | 3.0 | 2.0 | 1400 | $3,200 | $2.29 | 23d | 1 | 0.91mi |
| 12884 Bacchus Rd Port Charlotte, FL | 3.0 | 2.0 | 1092 | $2,300 | $2.11 | 23d | 1 | 0.98mi |
| 12223 Maltz Ave Unit 12225" Port Charlotte, FL | 3.0 | 2.0 | 1162 | $1,649 | $1.42 | 23d | 1 | 1.10mi |
| 12223 Maltz Ave Unit 12223 Port Charlotte, FL | 3.0 | 2.0 | 1162 | $1,647 | $1.42 | 23d | 1 | 1.10mi |
| 13349 Buckett Cir Port Charlotte, FL | 3.0 | 3.0 | 1560 | $2,795 | $1.79 | 23d | 1 | 1.11mi |
| 12032 Edwards Rd Port Charlotte, FL | 3.0 | 2.0 | 1723 | $1,869 | $1.08 | 15d | 1 | 1.21mi |
| 6628 Thorman Rd Port Charlotte, FL | 3.0 | 2.0 | 1116 | $1,800 | $1.61 | 23d | 1 | 1.26mi |
| 6351 Coniston St Port Charlotte, FL | 3.0 | 2.0 | 1200 | $1,950 | $1.62 | 23d | 1 | 1.30mi |
| 13288 Fowler Ave Port Charlotte, FL | 3.0 | 2.0 | 1203 | $2,500 | $2.08 | 23d | 1 | 1.31mi |
| 6248 Drucker Cir Port Charlotte, FL | 3.0 | 2.0 | 1414 | $1,810 | $1.28 | 15d | 1 | 1.34mi |
| 5201 Forbes Ter Port Charlotte, FL | 4.0 | 2.0 | 1664 | $3,200 | $1.92 | 23d | 1 | 1.37mi |
| 6193 Seaport St Port Charlotte, FL | 3.0 | 2.0 | 1613 | $1,966 | $1.22 | 15d | 1 | 1.39mi |
| 4154 Jennings Blvd Port Charlotte, FL | 3.0 | 2.0 | 1554 | $3,900 | $2.51 | 23d | 1 | 1.41mi |
Listing history 37 events
-
2026-06-22days on market $289,900 Active 30 DOM
-
2026-06-18days on market $289,900 Active 27 DOM
-
2026-06-17days on market $289,900 Active 26 DOM
-
2026-06-16days on market $289,900 Active 25 DOM
-
2026-06-15days on market $289,900 Active 24 DOM
-
2026-06-14days on market $289,900 Active 22 DOM
-
2026-06-13days on market $289,900 Active 21 DOM
-
2026-06-10days on market $289,900 Active 19 DOM
-
2026-06-09days on market $289,900 Active 18 DOM
-
2026-06-08days on market $289,900 Active 17 DOM
-
2026-06-07days on market $289,900 Active 16 DOM
-
2026-06-05days on market $289,900 Active 13 DOM
-
2026-06-03days on market $289,900 Active 12 DOM
-
2026-06-02days on market $289,900 Active 11 DOM
-
2026-06-01days on market $289,900 Active 10 DOM
-
2026-05-31days on market $289,900 Active 9 DOM
-
2026-05-30days on market $289,900 Active 8 DOM
-
2026-05-22$289,900 Active
-
2026-01-22price $1,995
-
2025-10-25$2,195
-
2025-10-25historical $2,195
-
2025-09-11$2,195
-
2025-09-10historical $2,195
-
2025-09-06$2,195
-
2025-09-05historical $2,195
-
2025-06-20price $2,195
-
2025-06-05historical
-
2025-05-01$2,300
-
2025-04-21$344,900 Active
-
2024-06-17soldstatus $293,453
-
2021-03-26soldstatus $60,000
-
2021-01-07soldstatus $92,500
-
2004-11-18soldstatus $30,000
-
2004-11-11soldstatus $30,500 113-char remark
Show marketing remark (113 chars)
Great lot in desirable area of Gulf Cove. Adjacent lot 23 also available. Close to beaches, shopping and schools.
-
2004-07-21$32,000 113-char remark
Show marketing remark (113 chars)
Great lot in desirable area of Gulf Cove. Adjacent lot 23 also available. Close to beaches, shopping and schools.
-
2004-07-08soldstatus $40,000
-
2004-05-05$42,900
ⓘ Source: listings_history table (triggers on properties + properties_extension) + one-shot
backfill from property_details.listing_events for pre-trigger history.
Climate risk First Street
- Flood 7/10 Severe FEMA zone X (shaded) · 94% chance over 30 yrs
- Wildfire 1/10 Low
- Heat 10/10 Extreme 7 d/yr ≥107°F today · 29 d/yr by 30 yrs out
- Wind 10/10 Extreme 99% chance of damaging wind over 30 yrs
- Air quality 3/10 Moderate 2 unhealthy d/yr today · 3 by 30 yrs out
Nearby sold comps map
Loading sold comps map…
Walkable amenities ~0.75 mi
Loading nearby amenities…
Taxation est. · year 1
- Rental income
- $28,407
- − Mortgage interest
- −$16,239
- − Property taxes
- −$4,348
- − Insurance
- −$2,247
- − Repairs & maintenance
- −$2,273
- − Management
- −$2,273
- − Depreciation
- −$8,433
- Taxable loss
- −$7,406
- Est. tax savings @ 24.0%
- +$1,777
- After-tax cash flow
- $-620/yr
For passive investors: Depreciation is non-cash, so a rental often shows a tax loss while cash-flowing — sheltering income. Rental losses are passive: they offset passive income freely, and up to $25,000/yr can offset ordinary (W-2) income if you actively participate and your MAGI is under $100k (phasing out to $0 by $150k); unused losses carry forward. On sale, claimed depreciation is recaptured at up to 25%, and gains may owe capital-gains tax (a 1031 exchange can defer both). Figures are a year-1 estimate at your 24.0% rate — not tax advice; consult a CPA.
Schools (NCES district)
- District
- Charlotte
- NCES district ID
- 1200240
- Math proficiency
- 54% ▼ -6.00%
- Reading proficiency
- 54% ▼ -1.00%
- Median HH income
- $44,864
- Composite
- 45.62/100
- National rank
- #2586
- State rank
- #22 of 73 in FL
Livability — North Port
- Score
- 75/100
- State rank
- #252
- US rank
- #3975
Category grades
Schools grade is shown separately in the Schools card above.
Census & demographics
- County
- Charlotte County · 196,994 people
- City population
- 75,324
- Metro
- Punta Gorda, FL
- Population (ZIP)
- 15,622
- Household income
- $84,098
- Rent vs Own
- Severe rent burden
- 105.0
Population outlook (Charlotte County) Hauer SSP2
- Today (2025)
- 198,646 people
- By 2030
- 210,507 · +6.0%
- By 2040
- 230,857 · +16.2%
- By 2050
- 247,148 · +24.4%
- By 2075
- 281,777 · +41.8%
- By 2100
- 293,609 · +47.8%
Race, ethnicity, and origin ACS 2023
- Neighborhood character
- Predominantly White (89%)
- Race & ethnicity
- White 89% Two or more races 4% Hispanic / Latino 4% Black 2% Asian 1%
- Common ancestry
- Romanian 4% Lithuanian 3% Italian 2%
- Foreign-born
- 6% · Canada
- Languages at home
- 96% English-only · Spanish 1% German/W. Germanic 1% Tagalog/Filipino 1%
Political lean MEDSL · Charlotte
- 2024 margin
- Solid R (+34.0) · D 32.7% · R 66.7%
- 2008→2024 swing
- -26.7pp toward R · 2008: -7.2pp · 2024: -34.0pp
- All cycles
- 2024: R+34.0 2020: R+26.6 2016: R+27.8 2012: R+14.3 2008: R+7.2
Not yet ingested
- Civics
- —
Market trends
- HPI YoY
- ▼ -28.09%
- Current HPI
- 346.5247
- Rent YoY
- ▲ 5.29%
- Metro
- Punta Gorda, FL
- State GDP YoY
- ▲ 3.28%
- F500 in state
- 36
Industry mix (Fortune 500 HQ in FL)
| Industry | F500 HQs | Revenue |
|---|---|---|
| Industrial Technology | 2 | $29B |
|
||
| Insurance | 2 | $17B |
|
||
| Retail | 1 | $60B |
|
||
| Technology Distribution | 1 | $58B |
|
||
| Homebuilding | 1 | $35B |
|
||
| Technology Manufacturing | 1 | $35B |
|
||
Price history
+575.8% since first listed20 events — show timeline
- 2026-05-22 Listed $289,900 Stellar MLS as Distributed by MLS Grid
- 2026-01-22 Price Changed $1,995 RentEngineListings
- 2025-10-25 Listed for Rent $2,195 RentEngineListings
- 2025-10-25 Rental Removed $2,195 TENANTTURNER2
- 2025-09-11 Listed for Rent $2,195 TENANTTURNER2
- 2025-09-10 Rental Removed $2,195 BUILDIUM
- 2025-09-06 Listed for Rent $2,195 BUILDIUM
- 2025-09-05 Rental Removed $2,195 TENANTTURNER2
- 2025-06-20 Price Changed $2,195 TENANTTURNER2
- 2025-06-05 Listing Removed — Stellar MLS as Distributed by MLS Grid
- 2025-05-01 Listed for Rent $2,300 TENANTTURNER2
- 2025-04-21 Listed $344,900 Stellar MLS as Distributed by MLS Grid
- 2024-06-17 Sold (Public Records) $293,453 Public Records
- 2021-03-26 Sold (Public Records) $60,000 Public Records
- 2021-01-07 Sold (Public Records) $92,500 Public Records
- 2004-11-18 Sold (Public Records) $30,000 Public Records
- 2004-11-11 Sold (MLS) $30,500 Stellar MLS as Distributed by MLS Grid
- 2004-07-21 Listed $32,000 Stellar MLS as Distributed by MLS Grid
- 2004-07-08 Sold (MLS) $40,000 Stellar MLS as Distributed by MLS Grid
- 2004-05-05 Listed $42,900 Stellar MLS as Distributed by MLS Grid
Property tax history
+4.2%/yrLatest (2025): $527 · +1.0% YoY. Source: county tax records.
Cash-flow waterfall
monthlySold comps — $/sqft
last 12 mo · ≤1 miLoading sold comps…