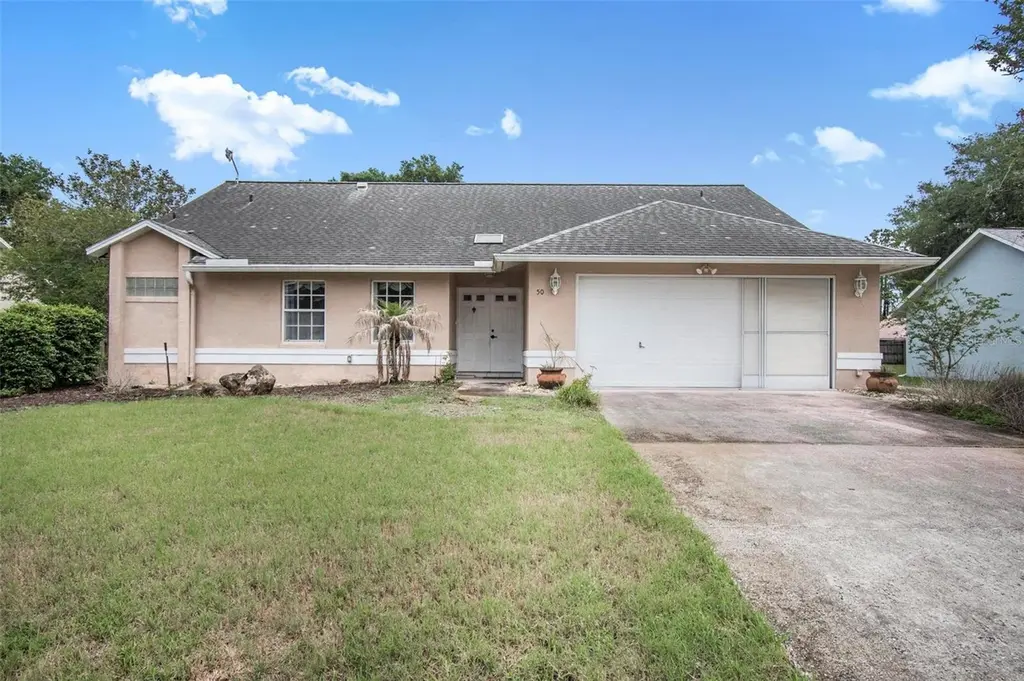
50 Westover Ln · Palm Coast, FL
Flood risk 1/10 · Minimal
- FEMA flood zone
- X (unshaded)
- Chance of flooding over 30 yrs
- 0.0%
- Est. flood insurance / yr
- $507 – $1,088
Fire risk 3/10 · Minor
- Est. fire insurance / yr
- $947 – $1,759
Heat risk 9/10 · Severe
- Hot days now (above 106°F)
- 7 days/yr
- Hot days in 30 yrs
- 20 days/yr
Wind risk 10/10 · Severe
- Chance of severe wind over 30 yrs
- 99.0%
Air-quality risk 2/10 · Minimal
- Unhealthy air days now
- 2 days/yr
- Unhealthy air days in 30 yrs
- 2 days/yr
Risk factors via First Street. Map © Google.
Why this score? — see what drove the B- grade
The composite is a weighted blend of 9 inputs, each scored 0–100. Each bar is that input's sub-score; the figure is the points it added to the 100-point composite (weight × sub-score).
- Cash flow +26.4/30.0
- ARV discount +15.0/15.0
- DSCR +9.0/10.0
- 1% rule +5.7/10.0
- Schools +4.6/10.0
- Livability +3.5/5.0
- Rent growth +2.8/5.0
- Condition / age +2.5/5.0
- Appreciation +0.0/10.0
$215,000
🖨 Deal sheet 📄 Offer letter ✓ Due diligence
Listing remarks
Multiple Offer Situation. Seller requests Highest and Best by 2pm Thursday May 14th. This 3-bedroom, 2-bath single-family home sits on an elevated lot in the highly desirable Pine Lakes neighborhood, across the street from the golf course and has tons of potential! Entry foyer opens into an open living space with access to the 168 square foot Florida Room. Large primary bedroom with walk in closet and en suite featuring dual sinks and walk in shower. 2 guest bedrooms share a bathroom which has access to the back yard, perfect for a pool bath as there is plenty of room to add a pool! A/C 2015, Roof 2005. Pine Lakes is known for its mature surroundings, quiet streets, and convenient access
Key facts
- Dual sinks
- Florida room
- Back yard access
Tags
Property features AI
Finance
- Other: Homestead exemption indicated; Zoned SFR-3
- HOA & community: Located in the Pine Lakes development; No HOA association (per listing)
Exterior
- Parking: Attached 2-car garage
- Utilities: Public water; Public sewer; Electricity connected; Water connected
- Home design: Single family residence; One level; Faces east
- Construction: Block and stucco construction; Shingle roof; Slab foundation; Built by ITT (Greystone model)
- Exterior features: Covered rear porch; Sliding doors; Paved road access
Interior
- Kitchen: Range; Refrigerator
- Bedrooms: 3 bedrooms
- Flooring: Carpet; Tile
- Bathrooms: 2 full bathrooms
- Heating & cooling: Electric heating; Central air conditioning
- Interior features: Ceiling fans; High ceilings; Open floor plan; Split bedroom layout; Thermostat; Vaulted ceilings; Walk-in closets; Window treatments
- Laundry & utility: Inside laundry room with washer and electric dryer hookups
Neighborhood map
What this means for you Summary
Snapshot
- This is a 3-bed/2.0-bath single-family listed at $215k.
Deal economics
- At list price, monthly cash flow is $563 ($7k/yr) — positive.
- The deal already cash-flows at list — no discount required.
- Meets the 1% rule at list price ($2k rent vs $215k).
- Cap rate 9.4% vs local median 3.8% in Palm Coast — top-decile yield for the area; either an underpriced asset or a hidden risk that comps aren't pricing in. Stress-test before assuming the spread holds.
Location & tenants
- Location reads 69/100 on livability (#478 in FL) — a middle-class / working-renter tenant base. Strengths: housing A+, health & safety A+, cost of living B+; Watch: amenities F, commute F.
- Flagler (rural): math 53% / reading 56% proficiency, ranked #20 of 73 in FL (top 27%) — acceptable for families but not a draw, mixed tenant base, ~2y average lease.
- Zoned schools: Lewis E. Wadsworth Elementary (math 54% / reading 57%, grade C, #855 of 2,144 statewide, top 41%, 743 students, 68% FRL); Flagler-Palm Coast High School (math 36% / reading 51%, grade F, #248 of 667 statewide, top 38%, 2,523 students, 52% FRL).
- Market conditions: Rents rising (+1.2%/yr); 1367 active listings in the ZIP; 37 comparable units currently listed for rent nearby; rentals at typical pace (median 23d on market — plan ~3-4 weeks tenant-placement turnaround); solid renter incomes; 2,588 units permitted in Flagler County in 2024 (0 in 5+ unit buildings).
- This rent runs 36% of the median local income ($76k/yr) — at the standard rent-burdened threshold; future hikes will face affordability resistance.
Forward outlook
- Local home prices are declining (-3.0%/yr); year-one equity from $1k of loan paydown is wiped out by about $6k of value loss. Plan a longer hold.
- Flagler County population projected at +28% by 2050 — long-run rental-demand tailwind backs the buy-and-hold thesis.
Negotiation context
- Only 2 days on market — expect competitive offers; lowballing is unlikely to land.
- 2 sale attempts with the ask held roughly flat each time — persistent listings suggest the price (not the market) is what's stuck; bring a comps-based counter.
- Current owner paid $120k; list at $215k implies a 79% gain — meaningful room to come down on a strong offer.
Risks & watch-outs
- Climate carrying-cost: severe wind risk, 99% chance of damaging wind over 30y; extreme-heat days projected 7→20/yr by 2055 (HVAC capex compounding) — expect insurance premiums to compound above CPI over the hold.
Questions for the listing agent
- Is there a deadline driving the sale (1031 exchange, divorce, estate, relocation)? That informs how much negotiation room exists.
- What's the average days-on-market for RENTAL listings here right now (not sales)? A rising rental-DOM trend means longer vacancies and softer asking-rent achievability than the comps imply.
- What's the recent tenant-quality profile in this submarket — average credit score on applications, eviction rate, late-payment / NSF rate, and stable-employment percentage? A property-management company in the area should have these aggregated.
- How much new for-sale + rental construction is in the pipeline within 1–3 miles? Heavy new supply typically softens prices + rents 12–24 months out; constrained supply supports both.
Investment metrics
- 1% rule
- 1.07% ✓
- Cap rate
- 9.44%
- Cash-on-cash
- 11.23%
- DSCR
- 1.50
- GRM
- 7.8
CMA / ARV
- ARV (on-the-fly)
- $295,236
- Comps found
- 12
Show comp detail 12 sales within ~0.75 mi
| Address | Dist | Beds/Ba | Sqft | Sold | Price | $/sf | Match |
|---|---|---|---|---|---|---|---|
| 50 Westover Ln | 0.00mi | 3/2.0 | 1,668 (0%) | 1mo | $230,000 | $138 | 99 |
| 132 Westgrill Dr | 0.10mi | 3/2.0 | 1,630 (-2%) | 0mo | $175,000 | $107 | 91 |
| 110 Westgrill Dr | 0.22mi | 3/2.0 | 1,657 (-1%) | 0mo | $355,000 | $214 | 88 |
| 5 Westglen Ln | 0.28mi | 3/2.0 | 1,699 (+2%) | 1mo | $300,000 | $177 | 83 |
| 135 Westchester Ln | 0.28mi | 3/2.0 | 1,776 (+6%) | 2mo | $300,000 | $169 | 74 |
| 31 Lago Vista Pl | 0.35mi | 3/2.0 | 1,577 (-6%) | 2mo | $267,000 | $169 | 73 |
| 49 Village Cir | 0.57mi | 3/2.5 | 1,665 (-0%) | 1mo | $227,500 | $137 | 70 |
| 6 Westgale Pl | 0.11mi | 3/2.0 | 1,423 (-15%) | 2mo | $356,250 | $250 | 69 |
| 104 Westrobin Ln | 0.59mi | 3/2.0 | 1,698 (+2%) | 1mo | $293,500 | $173 | 68 |
| 23 Westmoreland Dr | 0.40mi | 3/2.0 | 1,889 (+13%) | 1mo | $350,000 | $185 | 58 |
| 17 Weller Ln | 0.72mi | 3/2.0 | 1,768 (+6%) | 1mo | $339,000 | $192 | 56 |
| 45 Westridge Ln | 0.56mi | 3/2.0 | 1,428 (-14%) | 2mo | $289,489 | $203 | 48 |
Match score weights: distance 35% · size 25% · config 20% · recency 20%. Top-matched comps best support the ARV.
Projected returns pro-forma
-3.0% appreciation · 1.18% rent growth · sell at horizon
- IRR
- -1.4%
- Equity multiple
- 0.95×
- Total profit
- $-3,227
- Equity at exit
- $32,057
- IRR
- 6.4%
- Equity multiple
- 1.44×
- Total profit
- $26,527
- Equity at exit
- $18,589
Cash invested: $60,200 (down + closing). Projections, not guarantees.
Landlord ↔ Tenant lean methodology
- Overall (STATE)
- 87 Strongly Landlord-Friendly
- State Florida
- 87 Strongly Landlord-Friendly · R+3
- County
- — inherits STATE
- City
- — inherits STATE
ZIP-level market 32164
- Home prices YoY
- -6.3%
- Rents YoY
- 1.2%
- Active inventory
- 1367
- Price-to-rent
- 7.8×
Monthly cashflow live
- Estimated rent
- $2,309 high interval (Pro) →
- Mortgage (P&I)
- −$1,127
- Tax from tax record
- −$44 /mo · $523/yr
- Insurance
- −$90
- HOA
- −$0
- Vacancy / Maint / Mgmt
- −$485
- Net cashflow
- $563
Break-even live
UW: 25.0% down · 7.5% · 30yr · 1.5% tax · 5.0% vac · 8.0% maint · 8.0% mgmt
Financing live
Cash to close
- Down payment
- $53,750
- Closing costs
- $6,450
- Reserves months
- —
- Total cash needed
- —
Loan-product check · same deal, 3 products live
Conventional
25% down · 7.5% · 30yr
- Down + closing
- —
- Monthly P&I
- —
- Monthly cashflow
- —
- DSCR
- —
- Eligible?
- —
Personal DTI + credit; lowest rate.
DSCR
20% down · 8.5% · 30yr
- Down + closing
- —
- Monthly P&I
- —
- Monthly cashflow
- —
- DSCR
- —
- Eligible?
- —
No personal income docs; deal must DSCR.
Hard money
10% down · 12.0% · 12mo
- Down + closing
- —
- Monthly P&I
- —
- Monthly cashflow
- —
- DSCR
- —
- Eligible?
- —
Short-term bridge; refi at stabilization.
Rent comps 37 comps
| Address | Beds | Baths | Sqft | Rent | $/sqft | DOM | Units | Dist |
|---|---|---|---|---|---|---|---|---|
| 60 Westover Ln Unit 1261607P Palm Coast, FL | 3.0 | 2.0 | 1894 | $3,907 | $2.06 | 2d | 1 | 0.07mi |
| 80 Westfield Ln Palm Coast, FL | 3.0 | 2.0 | 1945 | $1,951 | $1.00 | 21d | 1 | 0.23mi |
| 43 Waverly Ln Palm Coast, FL | 3.0 | 2.0 | 1560 | $2,100 | $1.35 | 23d | 1 | 0.54mi |
| 57 Wellstream Ln Palm Coast, FL | 3.0 | 2.0 | 2040 | $1,900 | $0.93 | 23d | 1 | 0.67mi |
| 59 Wellstream Ln Palm Coast, FL | 3.0 | 2.0 | 1367 | $1,795 | $1.31 | 23d | 1 | 0.67mi |
| 20 Woodfield Dr Palm Coast, FL | 3.0 | 2.0 | 1791 | $1,995 | $1.11 | 2d | 1 | 0.75mi |
| 3 Wheeler Pl Palm Coast, FL | 2.0 | 2.0 | 1084 | $1,750 | $1.61 | 23d | 1 | 0.79mi |
| 23 Evolve PKWY Palm Coast, FL | 1.0–3.0 | 1.0–2.0 | 1004 | $1,960 | $1.95 | 2d | 30 | 0.93mi |
| 67 Rose Dr Unit A Palm Coast, FL | 3.0 | 2.0 | 1198 | $1,750 | $1.46 | 23d | 1 | 1.00mi |
| 35 Wood Arbor Ln Unit B Palm Coast, FL | 3.0 | 2.0 | 1475 | $1,800 | $1.22 | 23d | 1 | 1.00mi |
| 69 Rose Dr Unit B Palm Coast, FL | 3.0 | 2.0 | 1336 | $1,650 | $1.24 | 23d | 1 | 1.01mi |
| 129 Wellwood Ln Unit B Palm Coast, FL | 3.0 | 2.0 | 1287 | $1,650 | $1.28 | 23d | 1 | 1.03mi |
| 29 Wood Arbor Ln Unit B Palm Coast, FL | 3.0 | 2.0 | 1545 | $1,550 | $1.00 | 14d | 1 | 1.03mi |
| 11 Wheatfield Dr Palm Coast, FL | 4.0 | 2.0 | 2242 | $2,195 | $0.98 | 23d | 1 | 1.03mi |
| 7 Walton Pl Palm Coast, FL | 3.0 | 2.0 | 1929 | $1,975 | $1.02 | 14d | 1 | 1.04mi |
| 113 Whippoorwill Dr Unit NA Palm Coast, FL | 3.0 | 2.0 | 1580 | $2,100 | $1.33 | 23d | 1 | 1.04mi |
| 21 Rosepetal Ln Unit A Palm Coast, FL | 3.0 | 2.0 | 1200 | $1,800 | $1.50 | 23d | 1 | 1.07mi |
| 6 Rosedale Pl Palm Coast, FL | 3.0 | 2.0 | 1337 | $1,900 | $1.42 | 23d | 1 | 1.08mi |
| 116 Wellwood Ln Unit B Palm Coast, FL | 3.0 | 2.0 | 1217 | $1,475 | $1.21 | 23d | 1 | 1.09mi |
| 14 Wood Amber Ln Palm Coast, FL | 3.0 | 2.0 | 1655 | $1,750 | $1.06 | 23d | 1 | 1.09mi |
| 58 Whippoorwill Dr Palm Coast, FL | 3.0 | 2.0 | 1721 | $1,950 | $1.13 | 2d | 1 | 1.10mi |
| 64 Rockefeller Dr Palm Coast, FL | 3.0 | 2.0 | 1500 | $1,700 | $1.13 | 14d | 1 | 1.12mi |
| 19 Rosecroft Ln Palm Coast, FL | 3.0 | 2.5 | 1719 | $1,979 | $1.15 | 21d | 1 | 1.13mi |
| 6 Wood Amber Ln Unit A Palm Coast, FL | 3.0 | 2.0 | 1198 | $1,500 | $1.25 | 23d | 1 | 1.14mi |
| 59 Wellhaven Ln Unit B Palm Coast, FL | 3.0 | 2.0 | 1198 | $1,900 | $1.59 | 13d | 1 | 1.16mi |
| 35 Wellham Ln Palm Coast, FL | 3.0 | 2.0 | 1298 | $1,750 | $1.35 | 23d | 1 | 1.16mi |
| 10 Warner Pl Palm Coast, FL | 3.0 | 2.0 | 1481 | $1,850 | $1.25 | 23d | 1 | 1.17mi |
| 33 Rosecroft Ln Unit B Palm Coast, FL | 3.0 | 2.0 | 1211 | $1,750 | $1.45 | 2d | 1 | 1.18mi |
| 91 Rolling Sands Dr Unit B Palm Coast, FL | 4.0 | 2.0 | 1524 | $1,800 | $1.18 | 23d | 1 | 1.18mi |
| 107 Rolling Sands Dr Unit B Palm Coast, FL | 2.0 | 2.0 | 1132 | $1,500 | $1.33 | 23d | 1 | 1.20mi |
| 45 Wellham Ln Unit B Palm Coast, FL | 3.0 | 2.0 | 1505 | $1,850 | $1.23 | 2d | 1 | 1.21mi |
| 75 Wellwood Ln Unit A Palm Coast, FL | 3.0 | 2.0 | 1093 | $1,500 | $1.37 | 23d | 1 | 1.25mi |
| 75A Wellwood Ln Palm Coast, FL | 3.0 | 2.0 | 1093 | $1,500 | $1.37 | 23d | 1 | 1.25mi |
| 55 Brittany Ln Palm Coast, FL | 3.0 | 2.0 | 1281 | $1,850 | $1.44 | 18d | 1 | 1.35mi |
| 11 Roxton Ln Palm Coast, FL | 4.0 | 2.0 | 1617 | $1,949 | $1.21 | 23d | 1 | 1.41mi |
| 20 Bressler Ln Palm Coast, FL | 4.0 | 3.0 | 2141 | $2,060 | $0.96 | 23d | 1 | 1.41mi |
| 19 Roxbury Ln Palm Coast, FL | 3.0 | 2.0 | 1179 | $1,800 | $1.53 | 2d | 1 | 1.48mi |
Listing history 7 events
-
2026-05-14status Pending
-
2026-05-12$215,000 Active
-
2025-12-19status Pending
-
2025-12-19historical
-
2025-12-10price $235,000
-
2025-12-01$259,000 Active
-
1991-12-01soldstatus $120,300
ⓘ Source: listings_history table (triggers on properties + properties_extension) + one-shot
backfill from property_details.listing_events for pre-trigger history.
Tax reassessment forecast FL · Resets to sale price
- Current annual tax
- $523 · $44/mo
- Projected year-2 tax
- $1,784 · $149/mo
- Expected delta
- +$1,262/yr (+$105/mo · 241.2%)
ⓘ Screening estimate from a state-policy table — verify with the county assessor before closing.
Climate risk First Street
- Flood 1/10 Low FEMA zone X (unshaded) · 0% chance over 30 yrs
- Wildfire 3/10 Moderate
- Heat 9/10 Extreme 7 d/yr ≥106°F today · 20 d/yr by 30 yrs out
- Wind 10/10 Extreme 99% chance of damaging wind over 30 yrs
- Air quality 2/10 Low 2 unhealthy d/yr today · 2 by 30 yrs out
Nearby sold comps map
Loading sold comps map…
Walkable amenities ~0.75 mi
Loading nearby amenities…
Taxation est. · year 1
- Rental income
- $27,703
- − Mortgage interest
- −$12,043
- − Property taxes
- −$523
- − Insurance
- −$1,075
- − Repairs & maintenance
- −$2,216
- − Management
- −$2,216
- − Depreciation
- −$6,255
- Taxable income
- $3,375
- Est. tax owed @ 24.0%
- −$810
- After-tax cash flow
- $5,948/yr
For passive investors: Depreciation is non-cash, so a rental often shows a tax loss while cash-flowing — sheltering income. Rental losses are passive: they offset passive income freely, and up to $25,000/yr can offset ordinary (W-2) income if you actively participate and your MAGI is under $100k (phasing out to $0 by $150k); unused losses carry forward. On sale, claimed depreciation is recaptured at up to 25%, and gains may owe capital-gains tax (a 1031 exchange can defer both). Figures are a year-1 estimate at your 24.0% rate — not tax advice; consult a CPA.
Schools (NCES district)
- District
- Flagler
- NCES district ID
- 1200540
- Math proficiency
- 53% ▼ -9.00%
- Reading proficiency
- 56% ▼ -4.00%
- Median HH income
- $48,354
- Composite
- 46.35/100
- National rank
- #2464
- State rank
- #20 of 73 in FL
Livability — Palm Coast
- Score
- 69/100
- State rank
- #478
- US rank
- #8721
Category grades
Schools grade is shown separately in the Schools card above.
Census & demographics
- Census place
- Palm Coast, FL
- County
- Flagler County · 113,412 people
- City population
- 105,049
- Metro
- Deltona-Daytona Beach-Ormond Beach, FL
- Population (ZIP)
- 56,658
- Household income
- $76,399
- Rent vs Own
- Severe rent burden
- 1291.0
Population outlook (Flagler County) Hauer SSP2
- Today (2025)
- 123,474 people
- By 2030
- 131,864 · +6.8%
- By 2040
- 146,176 · +18.4%
- By 2050
- 157,398 · +27.5%
- By 2075
- 177,990 · +44.2%
- By 2100
- 183,381 · +48.5%
Race, ethnicity, and origin ACS 2023
- Neighborhood character
- Predominantly White (65%)
- Race & ethnicity
- White 65% Hispanic / Latino 14% Black 13% Two or more races 8% Asian 2%
- Hispanic origin (detail)
- Mexican 4% Puerto Rican 4% Cuban 2%
- Common ancestry
- Romanian 3% Russian 2% Slovak 2%
- Foreign-born
- 16% · Canada, Jamaica
- Languages at home
- 81% English-only · Spanish 9% Russian/Polish/Slavic 3% Other Indo-European 3%
Political lean MEDSL · Flagler
- 2024 margin
- Strong R (+28.2) · D 35.6% · R 63.8%
- 2008→2024 swing
- -29.8pp toward R · 2008: 1.6pp · 2024: -28.2pp
- All cycles
- 2024: R+28.2 2020: R+20.8 2016: R+20.6 2012: R+7.4 2008: D+1.6
Not yet ingested
- Civics
- —
Market trends
- HPI YoY
- ▼ -19.89%
- Current HPI
- 297.4942
- Rent YoY
- ▲ 1.18%
- Metro
- Deltona-Daytona Beach-Ormond Beach, FL
- State GDP YoY
- ▲ 3.28%
- F500 in state
- 36
Industry mix (Fortune 500 HQ in FL)
| Industry | F500 HQs | Revenue |
|---|---|---|
| Industrial Technology | 2 | $29B |
|
||
| Insurance | 2 | $17B |
|
||
| Retail | 1 | $60B |
|
||
| Technology Distribution | 1 | $58B |
|
||
| Homebuilding | 1 | $35B |
|
||
| Technology Manufacturing | 1 | $35B |
|
||
Price history
+78.7% since first listed7 events — show timeline
- 2026-05-14 Pending — Stellar MLS as Distributed by MLS Grid
- 2026-05-12 Listed $215,000 Stellar MLS as Distributed by MLS Grid
- 2025-12-19 Pending — Stellar MLS as Distributed by MLS Grid
- 2025-12-19 Listing Removed — Stellar MLS as Distributed by MLS Grid
- 2025-12-10 Price Changed $235,000 Stellar MLS as Distributed by MLS Grid
- 2025-12-01 Listed $259,000 Stellar MLS as Distributed by MLS Grid
- 1991-12-01 Sold (Public Records) $120,300 Public Records
Property tax history
+0.2%/yrLatest (2025): $523 · +5.7% YoY. Source: county tax records.
Cash-flow waterfall
monthlySold comps — $/sqft
last 12 mo · ≤1 miLoading sold comps…