 Triplex
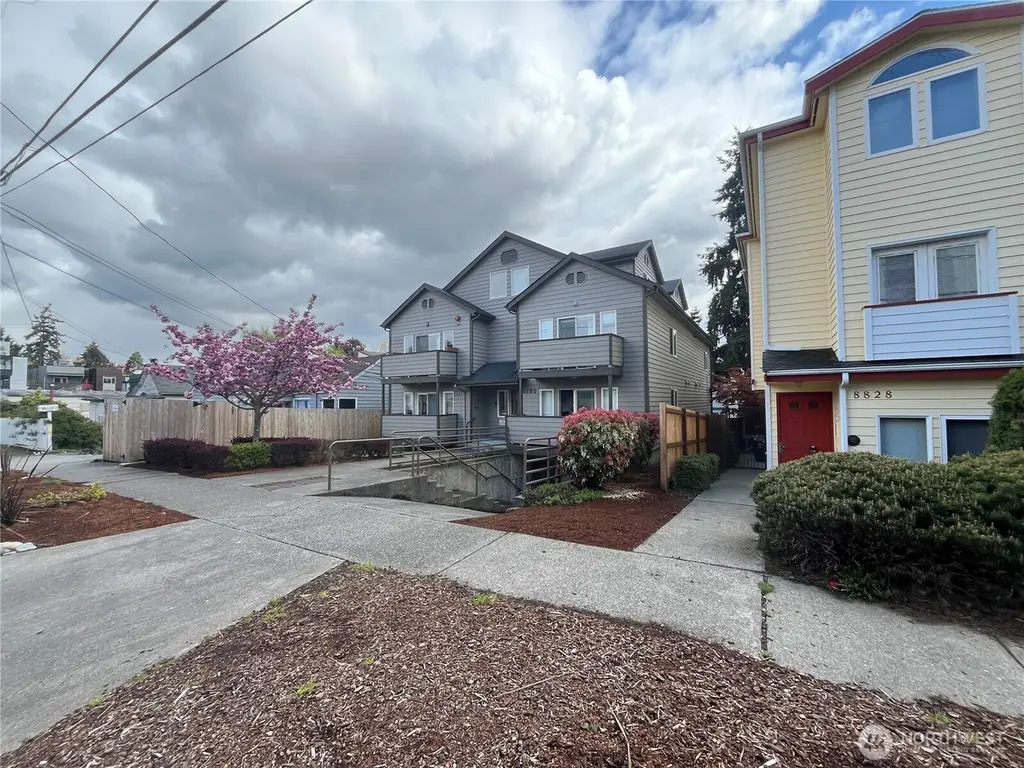
8830 Nesbit Ave N · Seattle, WA
Flood risk 1/10 · Minimal
- FEMA flood zone
- X (unshaded)
- Chance of flooding over 30 yrs
- 0.0%
- Est. flood insurance / yr
- $507 – $1,088
Fire risk 1/10 · Minimal
- Est. fire insurance / yr
- $604 – $1,122
Heat risk 3/10 · Minor
- Hot days now (above 86°F)
- 7 days/yr
- Hot days in 30 yrs
- 15 days/yr
Wind risk 1/10 · Minimal
- Chance of severe wind over 30 yrs
- —
Air-quality risk 7/10 · Major
- Unhealthy air days now
- 10 days/yr
- Unhealthy air days in 30 yrs
- 11 days/yr
Risk factors via First Street. Map © Google.
Why this score? — see what drove the D grade
The composite is a weighted blend of 9 inputs, each scored 0–100. Each bar is that input's sub-score; the figure is the points it added to the 100-point composite (weight × sub-score).
- ARV discount +15.0/15.0
- Cash flow +8.1/30.0
- Schools +6.1/10.0
- Livability +3.8/5.0
- Rent growth +3.1/5.0
- Condition / age +2.5/5.0
- DSCR +2.2/10.0
- 1% rule +2.1/10.0
- Appreciation +0.0/10.0
$1,400,000
🖨 Deal sheet (PDF) 📄 Offer letter ✓ Due diligence
Multi-family units
County records classify this as Multi-Family (5+ Unit). Listing-text estimate: 3 units. estimate disagrees with records
5+ unit building — per-unit beds/baths from public records are typically unavailable; the breakdown below (if shown) is an estimate from the listing text.
Listing remarks
Located in the up and coming neighborhood north of Green Lake. This offering contains 6 spacious apartments, including two, 2-story townhouse style units. The units contain washer/dryers and various other updates. The basement contains a secure parking garage with one space per unit. Located less than 2-blocks from major transit, near Green Lake, as well as Northgate shopping center and light rail station. The property offers a value add opportunity via full renovations, with some work already done for you. Easy building to maintain, has a refreshed landscape, new fence, all the decks and roof were replaced roughly 5-years ago. Rents are slightly below market, with room to increase.
Key facts
- Full renovations
- Washer dryers
- Refreshed landscape
Tags
Neighborhood map
What this means for you Summary
Snapshot
- This is a 3 × 2-bed/1-bath units multifamily listed at $1.40M.
Deal economics
- At list price, monthly cash flow is $-1k ($-16k/yr) — negative. Per door: $-450/mo.
- To cash-flow at today's rent, offer at most $1.16M (17.0% below list).
- To meet the 1% rule (rent ≥ 1% of price), the offer needs to be $992k (29.1% below list).
- Recommended offer: $992k (29.1% below list) — sets the bar for 1% rule.
- Cap rate 5.1% vs local median 1.6% in Seattle — top-decile yield for the area; either an underpriced asset or a hidden risk that comps aren't pricing in. Stress-test before assuming the spread holds.
Location & tenants
- Location reads 75/100 on livability (#166 in WA, #4,033 nationally) — a middle-class / working-renter tenant base. Strengths: amenities A+, commute A+, employment A+; Watch: crime F, cost of living F.
- Seattle Public Schools (urban): math 64% / reading 72% proficiency, ranked #19 of 291 in WA (top 6%) — acceptable for families but not a draw, mixed tenant base, ~2y average lease.
- Zoned schools: Hazel Wolf K-8 (720 students, 22% FRL); Robert Eagle Staff Middle School (676 students, 31% FRL); Ingraham High School (1,452 students, 33% FRL) — zoned schools at 29% FRL track the district average.
- Market conditions: Rents rising (+2.2%/yr); 361 active listings in the ZIP; high-income renter base; 10,555 units permitted in King County in 2024 (7,119 in 5+ unit buildings).
- At $9,923/mo this rent would consume 91% of the median local household income ($131k/yr) (locally 2586% of renters already pay >50% of income on rent) — very limited rent-growth headroom before tenants either downsize or default.
Forward outlook
- Local home prices are declining (-3.0%/yr); year-one equity from $10k of loan paydown is wiped out by about $42k of value loss. Plan a longer hold.
- King County population projected at +44% by 2050 — long-run rental-demand tailwind backs the buy-and-hold thesis.
Negotiation context
- It's been on market 76 days — a 6% lower offer ($1.32M) is reasonable based on typical stale-listing flexibility.
- Current owner paid $650k; list at $1.40M implies a 115% gain — meaningful room to come down on a strong offer.
Questions for the listing agent
- What do current leases actually rent for vs. the listed asking? Can we see a recent rent roll and the last 12 months of T-12 income?
- It's been on market 76 days. Have you received any prior offers? Is the seller open to a 29% concession, seller financing, or rate buy-down credit?
- Can we see the unit-by-unit rent roll, current vacancy, and any below-market leases? What's the average tenancy length?
- What capital expenditures (roof, boiler, parking lot, exteriors) have been made in the last 5 years, and what's planned in the next 2?
- Why hasn't it sold? Are there any deal-killer items the seller is aware of (foundation, flood, title, zoning, code violations)?
- Is there a deadline driving the sale (1031 exchange, divorce, estate, relocation)? That informs how much negotiation room exists.
- Schools are A-rated — typically a magnet for longer-tenancy family renters. What's the average tenant stay here, and is there a school-zone premium baked into asking?
- Crime grade is F in this area — have there been break-ins, vandalism, or insurance claims at this property in the last 3 years? What carrier currently insures it and at what premium?
- The area grade is low — what's the realistic commute time and amenity access for the typical tenant pool here? Any planned neighborhood developments (good or bad) we should know about?
- What's the average days-on-market for RENTAL listings here right now (not sales)? A rising rental-DOM trend means longer vacancies and softer asking-rent achievability than the comps imply.
- What's the recent tenant-quality profile in this submarket — average credit score on applications, eviction rate, late-payment / NSF rate, and stable-employment percentage? A property-management company in the area should have these aggregated.
- How much new apartment / multifamily construction is in the pipeline within 1–3 miles? Heavy new supply (>2% of stock underway) typically softens rents 12–24 months out; light construction supports rent growth.
Investment metrics
- 1% rule
- 0.71% ✗
- Cap rate
- 5.14%
- Cash-on-cash
- -4.14%
- DSCR
- 0.82
- GRM
- 11.8
CMA / ARV
- ARV (median comp)
- $1,991,400
- List price
- $1,400,000
- Delta
- -29.70%
- Verdict
- UNDERPRICED
- Comps
- 14 within 1.0 mi
Projected returns pro-forma
-3.0% appreciation · 2.2% rent growth · sell at horizon
- IRR
- -24.1%
- Equity multiple
- 0.18×
- Total profit
- $-320,968
- Equity at exit
- $208,745
- IRR
- -21.7%
- Equity multiple
- -0.08×
- Total profit
- $-422,877
- Equity at exit
- $121,046
Cash invested: $392,000 (down + closing). Projections, not guarantees.
Landlord ↔ Tenant lean methodology
- Overall (CITY)
- 0 Strongly Tenant-Friendly
- State Washington
- 28 Tenant-Leaning · D+8
- County
- — inherits STATE
- City Seattle
- 0 Strongly Tenant-Friendly · D+52
ZIP-level market 98103
- Rents YoY
- 2.2%
- Active inventory
- 361
- Price-to-rent
- 35.3×
Monthly cashflow live
- Estimated rent
- $9,923 high interval (Pro) →
- Mortgage (P&I)
- −$7,342
- Tax from tax record
- −$1,265 /mo · $15,179/yr
- Insurance
- −$583
- HOA
- −$0
- Vacancy / Maint / Mgmt
- −$2,084
- Net cashflow
- $-1,351
Break-even live
Sensitivity live
| Price | -10% $-558 | -5% $-955 | +0% $-1,351 | +5% $-1,747 | +10% $-2,143 |
|---|---|---|---|---|---|
| Rent | -10% $-2,135 | -5% $-1,743 | +0% $-1,351 | +5% $-959 | +10% $-567 |
| Rate | -1.0pp $-646 | -0.5pp $-995 | base $-1,351 | +0.5pp $-1,714 | +1.0pp $-2,083 |
3-unit breakdown (identical units grouped — click to expand)
| Units | Beds | Baths | Est. rent |
|---|---|---|---|
| 3× units | 2 | 1 | $9,924 |
| #1 | 2 | 1 | $3,308 |
| #2 | 2 | 1 | $3,308 |
| #3 | 2 | 1 | $3,308 |
| Total (3 units) | $9,923 | ||
UW: 25.0% down · 7.5% · 30yr · 1.5% tax · 5.0% vac · 8.0% maint · 8.0% mgmt
Financing live
Cash to close
- Down payment
- $350,000
- Closing costs
- $42,000
- Reserves months
- —
- Total cash needed
- —
Loan-product check · same deal, 3 products live
Conventional
25% down · 7.5% · 30yr
- Down + closing
- —
- Monthly P&I
- —
- Monthly cashflow
- —
- DSCR
- —
- Eligible?
- —
Personal DTI + credit; lowest rate.
DSCR
20% down · 8.5% · 30yr
- Down + closing
- —
- Monthly P&I
- —
- Monthly cashflow
- —
- DSCR
- —
- Eligible?
- —
No personal income docs; deal must DSCR.
Hard money
10% down · 12.0% · 12mo
- Down + closing
- —
- Monthly P&I
- —
- Monthly cashflow
- —
- DSCR
- —
- Eligible?
- —
Short-term bridge; refi at stabilization.
Listing history 25 events
-
2026-06-22days on market $1,400,000 Active 76 DOM
-
2026-06-21days on market $1,400,000 Active 75 DOM
-
2026-06-21days on market $1,400,000 Active 74 DOM
-
2026-06-19days on market $1,400,000 Active 73 DOM
-
2026-06-18days on market $1,400,000 Active 72 DOM
-
2026-06-17days on market $1,400,000 Active 71 DOM
-
2026-06-16days on market $1,400,000 Active 70 DOM
-
2026-06-15days on market $1,400,000 Active 69 DOM
-
2026-06-15days on market $1,400,000 Active 68 DOM
-
2026-06-13days on market $1,400,000 Active 67 DOM
-
2026-06-12days on market $1,400,000 Active 66 DOM
-
2026-06-10days on market $1,400,000 Active 64 DOM
-
2026-06-09days on market $1,400,000 Active 63 DOM
-
2026-06-08days on market $1,400,000 Active 62 DOM
-
2026-06-07days on market $1,400,000 Active 61 DOM
-
2026-06-07days on market $1,400,000 Active 60 DOM
-
2026-06-04days on market $1,400,000 Active 58 DOM
-
2026-06-03days on market $1,400,000 Active 57 DOM
-
2026-06-02days on market $1,400,000 Active 56 DOM
-
2026-06-01days on market $1,400,000 Active 55 DOM
-
2026-05-31days on market $1,400,000 Active 54 DOM
-
2026-04-07$1,400,000 Active
-
2004-09-15soldstatus $650,000
-
1994-08-02soldstatus $120,000
-
1989-09-07soldstatus $79,000
ⓘ Source: listings_history table (triggers on properties + properties_extension) + one-shot
backfill from property_details.listing_events for pre-trigger history.
Tax reassessment forecast WA · Resets to sale price
- Current annual tax
- $15,179 · $1,265/mo
- Projected year-2 tax
- $15,179 · $1,265/mo
- Expected delta
- $0/yr ($0/mo · 0.0%)
ⓘ Screening estimate from a state-policy table — verify with the county assessor before closing.
Climate risk First Street
- Flood 1/10 Low FEMA zone X (unshaded) · 0% chance over 30 yrs
- Wildfire 1/10 Low
- Heat 3/10 Moderate 7 d/yr ≥86°F today · 15 d/yr by 30 yrs out
- Wind 1/10 Low
- Air quality 7/10 Severe 10 unhealthy d/yr today · 11 by 30 yrs out
Nearby sold comps map
Loading sold comps map…
Walkable amenities ~0.75 mi
Loading nearby amenities…
Taxation est. · year 1
- Rental income
- $119,076
- − Mortgage interest
- −$78,422
- − Property taxes
- −$15,179
- − Insurance
- −$7,000
- − Repairs & maintenance
- −$9,526
- − Management
- −$9,526
- − Depreciation
- −$40,727
- Taxable loss
- −$41,304
- Est. tax savings @ 24.0%
- +$9,913
- After-tax cash flow
- $-6,297/yr
For passive investors: Depreciation is non-cash, so a rental often shows a tax loss while cash-flowing — sheltering income. Rental losses are passive: they offset passive income freely, and up to $25,000/yr can offset ordinary (W-2) income if you actively participate and your MAGI is under $100k (phasing out to $0 by $150k); unused losses carry forward. On sale, claimed depreciation is recaptured at up to 25%, and gains may owe capital-gains tax (a 1031 exchange can defer both). Figures are a year-1 estimate at your 24.0% rate — not tax advice; consult a CPA.
Schools (NCES district)
- District
- Seattle Public Schools
- NCES district ID
- 5307710
- Math proficiency
- 64% ▼ -1.00%
- Reading proficiency
- 72% ▬ 0.00%
- Median HH income
- $68,695
- Composite
- 60.76/100
- National rank
- #1649
- State rank
- #19 of 291 in WA
Livability — Seattle
- Score
- 75/100
- State rank
- #166
- US rank
- #4033
Category grades
Schools grade is shown separately in the Schools card above.
Census & demographics
- Census place
- Seattle, WA
- County
- King County · 2,251,916 people
- City population
- 706,262
- Metro
- Seattle-Tacoma-Bellevue, WA
- Population (ZIP)
- 52,671
- Household income
- $131,154
- Rent vs Own
- Severe rent burden
- 2586.0
Population outlook (King County) Hauer SSP2
- Today (2025)
- 2,576,485 people
- By 2030
- 2,803,316 · +8.8%
- By 2040
- 3,255,921 · +26.4%
- By 2050
- 3,706,444 · +43.9%
- By 2075
- 4,746,063 · +84.2%
- By 2100
- 5,407,730 · +109.9%
Race, ethnicity, and origin ACS 2023
- Neighborhood character
- Predominantly White (70%)
- Race & ethnicity
- White 70% Two or more races 11% Asian 11% Hispanic / Latino 8% Black 3%
- Hispanic origin (detail)
- Mexican 4%
- Common ancestry
- Italian 4% Portuguese 4% Romanian 3%
- Foreign-born
- 15% · Canada, China, South Korea
- Languages at home
- 83% English-only · Spanish 4% Other Indo-European 3% Chinese 2%
Political lean MEDSL · King
- 2024 margin
- Solid D (+51.7) · D 74.2% · R 22.5% · Other 3.4%
- 2008→2024 swing
- +9.6pp toward D · 2008: 42.1pp · 2024: 51.7pp
- All cycles
- 2024: D+51.7 2020: D+52.7 2016: D+50.4 2012: D+39.9 2008: D+42.1
Not yet ingested
- Civics
- —
Market trends
- HPI YoY
- ▼ -1970.58%
- Current HPI
- 314.4545
- Rent YoY
- ▲ 2.20%
- Metro
- Seattle-Tacoma-Bellevue, WA
- State GDP YoY
- ▲ 4.65%
- F500 in state
- 22
Industry mix (Fortune 500 HQ in WA)
| Industry | F500 HQs | Revenue |
|---|---|---|
| Retail | 2 | $269B |
|
||
| Technology / Retail | 1 | $638B |
|
||
| Technology | 1 | $245B |
|
||
| Telecommunications | 1 | $38B |
|
||
| Food / Beverage | 1 | $36B |
|
||
| Automotive / Trucks | 1 | $34B |
|
||
Price history
+1672.2% since first listed4 events — show timeline
- 2026-04-07 Listed $1,400,000 NWMLS as Distributed by MLS Grid
- 2004-09-15 Sold (Public Records) $650,000 Public Records
- 1994-08-02 Sold (Public Records) $120,000 Public Records
- 1989-09-07 Sold (Public Records) $79,000 Public Records
Property tax history
+4.4%/yrLatest (2025): $15,179 · -3.0% YoY. Source: county tax records.
Cash-flow waterfall
monthlySold comps — $/sqft
last 12 mo · ≤1 miLoading sold comps…