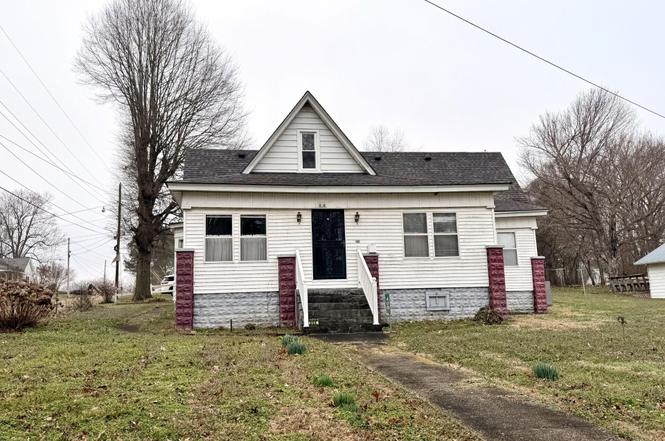
406 Maple Heights St · Kenton, TN
Flood risk 1/10 · Minimal
- FEMA flood zone
- X (unshaded)
- Chance of flooding over 30 yrs
- 0.0%
- Est. flood insurance / yr
- $507 – $1,088
Fire risk 1/10 · Minimal
- Est. fire insurance / yr
- $949 – $1,763
Heat risk 6/10 · Moderate
- Hot days now (above 109°F)
- 7 days/yr
- Hot days in 30 yrs
- 22 days/yr
Wind risk 4/10 · Minor
- Chance of severe wind over 30 yrs
- 9.0%
Air-quality risk 1/10 · Minimal
- Unhealthy air days now
- 0 days/yr
- Unhealthy air days in 30 yrs
- 0 days/yr
Risk factors via First Street. Map © Google.
Why this score? — see what drove the C+ grade
The composite is a weighted blend of 9 inputs, each scored 0–100. Each bar is that input's sub-score; the figure is the points it added to the 100-point composite (weight × sub-score).
- Cash flow +23.7/30.0
- DSCR +7.6/10.0
- ARV discount +7.5/15.0
- 1% rule +5.5/10.0
- Appreciation +5.3/10.0
- Schools +3.7/10.0
- Livability +2.9/5.0
- Rent growth +2.5/5.0
- Condition / age +2.5/5.0
$99,000
🖨 Deal sheet 📄 Offer letter ✓ Due diligence
Listing remarks
Step into timeless charm with this character-filled home in Kenton, TN! Featuring a roof that's only 4 years old, this well-loved property blends classic appeal with practical updates. Enjoy relaxing evenings on the screened-in back patio or unwind on the unique enclosed wraparound front and side porch — all under roof for year-round enjoyment. Upstairs offers versatile rooms perfect for storage, crafting, hobbies, or flex space to fit your needs. Situated on a spacious corner lot, the property also includes a detached garage and separate shop — ideal for projects, extra storage, or workspace. This one is full of personality and ready for its next chapter! Call Marty Lannom 731-
Key facts
- Separate shop
- Versatile rooms
- Spacious corner lot
Tags
Property features AI
Finance
- Financial info: Annual property tax amount reported
Exterior
- Parking: Two-car garage; One covered carport (additional parking space) — three parking spaces total
- Home design: Single-family residence; Two levels / Two stories
- Exterior features: Corner lot; Approximately 1 acre (lot dimensions ~115 m x 145 m irregular)
Interior
- Bedrooms: Two main-level bedrooms
- Bathrooms: One full bathroom (main level)
- Interior features: Three total rooms
Neighborhood map
What this means for you Summary
Snapshot
- This is a 2-bed/1.0-bath single-family listed at $99k.
Deal economics
- At list price, monthly cash flow is $189 ($2k/yr) — positive.
- The deal already cash-flows at list — no discount required.
- Meets the 1% rule at list price ($1k rent vs $99k).
- Recommended offer: $90k (9.0% below list) — sets the bar for market timing.
Location & tenants
- Location reads 58/100 on livability (#309 in TN) — a working-class tenant base; expect higher turnover. Strengths: cost of living A+, housing A+, crime B; Watch: health & safety C-, employment D, schools F.
- Gibson County Sp District (rural): math 47% / reading 39% proficiency, ranked #11 of 139 in TN (top 8%) — families likely to look elsewhere, expect single-tenant / working-renter base with shorter leases.
- Market conditions: 15 active listings in the ZIP; 155 units permitted in Gibson County in 2024 (0 in 5+ unit buildings).
Forward outlook
- In year one you build about $1k of equity ($684 loan paydown + $590 appreciation (0.6% local appreciation)).
- Gibson County population projected to shrink 8% by 2050 — rents likely to lag national; underwrite the cash flow, not the appreciation.
- At projected returns (0.6% appreciation + 3.0% rent growth), your $28k cash investment doubles in ~7 years — after that, you're playing with house money.
Negotiation context
- It's been on market 111 days — a 9% lower offer ($90k) is reasonable based on typical stale-listing flexibility.
Risks & watch-outs
- Watch-outs: built in 1900 — expect roof / HVAC / electrical / plumbing capex.
- Climate carrying-cost: extreme-heat days projected 7→22/yr by 2055 (HVAC capex compounding) — expect insurance premiums to compound above CPI over the hold.
Questions for the listing agent
- It's been on market 111 days. Have you received any prior offers? Is the seller open to a 9% concession, seller financing, or rate buy-down credit?
- Built in 1900 — when were the roof, HVAC, electrical panel, plumbing, and water heater last replaced?
- Why hasn't it sold? Are there any deal-killer items the seller is aware of (foundation, flood, title, zoning, code violations)?
- Is there a deadline driving the sale (1031 exchange, divorce, estate, relocation)? That informs how much negotiation room exists.
- Schools are F-rated, which usually means shorter tenancies and higher turnover. Who's the typical renter profile here, and what's been the actual vacancy rate?
- What's the average days-on-market for RENTAL listings here right now (not sales)? A rising rental-DOM trend means longer vacancies and softer asking-rent achievability than the comps imply.
- What's the recent tenant-quality profile in this submarket — average credit score on applications, eviction rate, late-payment / NSF rate, and stable-employment percentage? A property-management company in the area should have these aggregated.
- How much new for-sale + rental construction is in the pipeline within 1–3 miles? Heavy new supply typically softens prices + rents 12–24 months out; constrained supply supports both.
Investment metrics
- 1% rule
- 1.05% ✓
- Cap rate
- 8.59%
- Cash-on-cash
- 8.20%
- DSCR
- 1.36
- GRM
- 7.9
CMA / ARV
No comps found within radius.
Projected returns pro-forma
0.6% appreciation · 3.0% rent growth · sell at horizon
- IRR
- 8.7%
- Equity multiple
- 1.43×
- Total profit
- $11,956
- Equity at exit
- $31,734
- IRR
- 13.1%
- Equity multiple
- 2.52×
- Total profit
- $42,118
- Equity at exit
- $40,620
Cash invested: $27,720 (down + closing). Projections, not guarantees.
Landlord ↔ Tenant lean methodology
- Overall (STATE)
- 87 Strongly Landlord-Friendly
- State Tennessee
- 87 Strongly Landlord-Friendly · R+13
- County
- — inherits STATE
- City
- — inherits STATE
ZIP-level market 38233
- Home prices YoY
- 0.3%
- Active inventory
- 15
- Price-to-rent
- 7.9×
Monthly cashflow live
- Estimated rent
- $1,041 medium interval (Pro) →
- Mortgage (P&I)
- −$519
- Tax from tax record
- −$72 /mo · $868/yr
- Insurance
- −$41
- HOA
- −$0
- Vacancy / Maint / Mgmt
- −$219
- Net cashflow
- $189
Break-even live
UW: 25.0% down · 7.5% · 30yr · 1.5% tax · 5.0% vac · 8.0% maint · 8.0% mgmt
Financing live
Cash to close
- Down payment
- $24,750
- Closing costs
- $2,970
- Reserves months
- —
- Total cash needed
- —
Loan-product check · same deal, 3 products live
Conventional
25% down · 7.5% · 30yr
- Down + closing
- —
- Monthly P&I
- —
- Monthly cashflow
- —
- DSCR
- —
- Eligible?
- —
Personal DTI + credit; lowest rate.
DSCR
20% down · 8.5% · 30yr
- Down + closing
- —
- Monthly P&I
- —
- Monthly cashflow
- —
- DSCR
- —
- Eligible?
- —
No personal income docs; deal must DSCR.
Hard money
10% down · 12.0% · 12mo
- Down + closing
- —
- Monthly P&I
- —
- Monthly cashflow
- —
- DSCR
- —
- Eligible?
- —
Short-term bridge; refi at stabilization.
Listing history 15 events
-
2026-06-18days on market $99,000 Active 111 DOM
-
2026-06-17days on market $99,000 Active 110 DOM
-
2026-06-16days on market $99,000 Active 109 DOM
-
2026-06-15days on market $99,000 Active 108 DOM
-
2026-06-13days on market $99,000 Active 106 DOM
-
2026-06-12days on market $99,000 Active 105 DOM
-
2026-06-09days on market $99,000 Active 102 DOM
-
2026-06-08days on market $99,000 Active 101 DOM
-
2026-06-08days on market $99,000 Active 100 DOM
-
2026-06-07days on market $99,000 Active 99 DOM
-
2026-06-03days on market $99,000 Active 96 DOM
-
2026-06-02days on market $99,000 Active 95 DOM
-
2026-06-01days on market $99,000 Active 94 DOM
-
2026-05-31days on market $99,000 Active 93 DOM
-
2026-02-27$99,000 Active
ⓘ Source: listings_history table (triggers on properties + properties_extension) + one-shot
backfill from property_details.listing_events for pre-trigger history.
Tax reassessment forecast TN · Resets to sale price
- Current annual tax
- $868 · $72/mo
- Projected year-2 tax
- $868 · $72/mo
- Expected delta
- $0/yr ($0/mo · 0.0%)
ⓘ Screening estimate from a state-policy table — verify with the county assessor before closing.
Climate risk First Street
- Flood 1/10 Low FEMA zone X (unshaded) · 0% chance over 30 yrs
- Wildfire 1/10 Low
- Heat 6/10 Major 7 d/yr ≥109°F today · 22 d/yr by 30 yrs out
- Wind 4/10 Moderate 9% chance of damaging wind over 30 yrs
- Air quality 1/10 Low 0 unhealthy d/yr today · 0 by 30 yrs out
Nearby sold comps map
Loading sold comps map…
Walkable amenities ~0.75 mi
Loading nearby amenities…
Taxation est. · year 1
- Rental income
- $12,487
- − Mortgage interest
- −$5,546
- − Property taxes
- −$868
- − Insurance
- −$495
- − Repairs & maintenance
- −$999
- − Management
- −$999
- − Depreciation
- −$2,880
- Taxable income
- $701
- Est. tax owed @ 24.0%
- −$168
- After-tax cash flow
- $2,104/yr
For passive investors: Depreciation is non-cash, so a rental often shows a tax loss while cash-flowing — sheltering income. Rental losses are passive: they offset passive income freely, and up to $25,000/yr can offset ordinary (W-2) income if you actively participate and your MAGI is under $100k (phasing out to $0 by $150k); unused losses carry forward. On sale, claimed depreciation is recaptured at up to 25%, and gains may owe capital-gains tax (a 1031 exchange can defer both). Figures are a year-1 estimate at your 24.0% rate — not tax advice; consult a CPA.
Schools (NCES district)
- District
- Gibson County Sp District
- NCES district ID
- 4701400
- Math proficiency
- 47% ▼ -13.00%
- Reading proficiency
- 39% ▼ -5.00%
- Median HH income
- $47,868
- Composite
- 36.82/100
- National rank
- #4565
- State rank
- #11 of 139 in TN
Livability — Kenton
- Score
- 58/100
- State rank
- #309
- US rank
- #21028
Category grades
Schools grade is shown separately in the Schools card above.
Census & demographics
- Census place
- Kenton, TN
- Population (ZIP)
- 2,795
Population outlook (Gibson County) Hauer SSP2
- Today (2025)
- 48,793 people
- By 2030
- 48,221 · -1.2%
- By 2040
- 46,793 · -4.1%
- By 2050
- 44,909 · -8.0%
- By 2075
- 40,191 · -17.6%
- By 2100
- 33,574 · -31.2%
Race, ethnicity, and origin ACS 2023
- Neighborhood character
- Predominantly White (85%)
- Race & ethnicity
- White 85% Two or more races 9% Black 5%
- Common ancestry
- Slovak 2% Italian 1% Portuguese 1%
- Foreign-born
- 0%
- Languages at home
- 98% English-only · German/W. Germanic 1% Spanish 1%
Political lean MEDSL · Gibson
- 2024 margin
- Solid R (+52.0) · D 23.6% · R 75.5%
- 2008→2024 swing
- -23.2pp toward R · 2008: -28.8pp · 2024: -52.0pp
- All cycles
- 2024: R+52.0 2020: R+47.0 2016: R+43.8 2012: R+32.1 2008: R+28.8
Not yet ingested
- Civics
- —
Market trends
- HPI YoY
- ▲ 0.60%
- Current HPI
- 211.069
- Rent YoY
- —
- Metro
- —
- State GDP YoY
- ▲ 2.78%
- F500 in state
- 22
Industry mix (Fortune 500 HQ in TN)
| Industry | F500 HQs | Revenue |
|---|---|---|
| Healthcare | 3 | $91B |
|
||
| Retail | 3 | $72B |
|
||
| Transportation / Logistics | 1 | $88B |
|
||
| Paper / Packaging | 1 | $19B |
|
||
| Insurance | 1 | $13B |
|
||
| Energy | 1 | $12B |
|
||
Price history
1 event — show timeline
- 2026-02-27 Listed $99,000 CWTAR
Property tax history
+2.9%/yrLatest (2025): $868 · +2.5% YoY. Source: county tax records.
Cash-flow waterfall
monthlySold comps — $/sqft
last 12 mo · ≤1 miLoading sold comps…