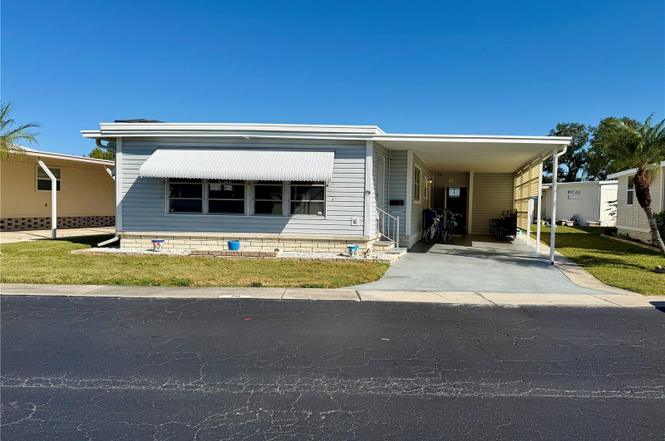
10399 67th Ave #78 · Bay Pines, FL
Flood risk 6/10 · Moderate
- FEMA flood zone
- X (unshaded)
- Chance of flooding over 30 yrs
- 0.55%
- Est. flood insurance / yr
- $507 – $1,088
Fire risk 1/10 · Minimal
- Est. fire insurance / yr
- $947 – $1,759
Heat risk 10/10 · Severe
- Hot days now (above 107°F)
- 5 days/yr
- Hot days in 30 yrs
- 18 days/yr
Wind risk 10/10 · Severe
- Chance of severe wind over 30 yrs
- 99.0%
Air-quality risk 3/10 · Minor
- Unhealthy air days now
- 2 days/yr
- Unhealthy air days in 30 yrs
- 2 days/yr
Risk factors via First Street. Map © Google.
Why this score? — see what drove the C grade
The composite is a weighted blend of 9 inputs, each scored 0–100. Each bar is that input's sub-score; the figure is the points it added to the 100-point composite (weight × sub-score).
- Cash flow +20.8/30.0
- ARV discount +7.5/15.0
- 1% rule +7.4/10.0
- DSCR +6.6/10.0
- Schools +4.3/10.0
- Livability +4.0/5.0
- Rent growth +2.5/5.0
- Condition / age +2.5/5.0
- Appreciation +0.0/10.0
$150,000
🖨 Deal sheet 📄 Offer letter ✓ Due diligence
Listing remarks
Welcome to this elegantly updated 2 bed, 2 bath, double-wide home featuring a bright open floor plan and abundant natural light throughout. Nestled in a peaceful 55+ waterfront community, this property offers the perfect blend of comfort, style, and coastal living. Enjoy tranquil mornings by the water at the community’s private park, complete with a gazebo, fire pit, and dock. At the clubhouse, you can take a refreshing swim, join a game of shuffleboard, work out in the gym, play a round of pool, or relax with a book in the library. The clubhouse is also available to rent for special gatherings, ideal for entertaining family and friends. This home has been thoughtfully remodeled with
Key facts
- Community gazebo
- Clubhouse
- Waterfront community
Tags
Neighborhood map
What this means for you Summary
Snapshot
- This is a 2-bed/2.0-bath manufactured listed at $150k.
Deal economics
- At list price, monthly cash flow is $205 ($2k/yr) — positive.
- The deal already cash-flows at list — no discount required.
- Meets the 1% rule at list price ($2k rent vs $150k).
- Recommended offer: $132k (12.0% below list) — sets the bar for market timing.
- Cap rate 7.9% vs local median 2.7% in Bay Pines — top-decile yield for the area; either an underpriced asset or a hidden risk that comps aren't pricing in. Stress-test before assuming the spread holds.
Location & tenants
- Location reads 81/100 on livability (#102 in FL, #1,559 nationally) — a professional / high-income tenant draw. Strengths: crime A+, housing A+, health & safety A+; Watch: amenities F.
- Pinellas (suburban): math 51% / reading 51% proficiency, ranked #31 of 73 in FL (top 42%) — acceptable for families but not a draw, mixed tenant base, ~2y average lease.
- Market conditions: Rents flat; 207 active listings in the ZIP; 31 comparable units currently listed for rent nearby; rentals at typical pace (median 18d on market — plan ~3-4 weeks tenant-placement turnaround); 2,676 units permitted in Pinellas County in 2024 (1,422 in 5+ unit buildings).
- This rent runs 30% of the median local income ($74k/yr) — at the standard rent-burdened threshold; future hikes will face affordability resistance.
Forward outlook
- Local home prices are declining (-3.0%/yr); year-one equity from $1k of loan paydown is wiped out by about $4k of value loss. Plan a longer hold.
- Pinellas County population projected at +14% by 2050 — modest demand growth; plan on rents tracking national, not racing it.
Negotiation context
- It's been on market 153 days — a 12% lower offer ($132k) is reasonable based on typical stale-listing flexibility.
- Current owner paid $75k; list at $150k implies a 100% gain — meaningful room to come down on a strong offer.
Risks & watch-outs
- Climate carrying-cost: major flood risk; severe wind risk, 99% chance of damaging wind over 30y; extreme-heat days projected 5→18/yr by 2055 (HVAC capex compounding) — expect insurance premiums to compound above CPI over the hold.
Questions for the listing agent
- It's been on market 153 days. Have you received any prior offers? Is the seller open to a 12% concession, seller financing, or rate buy-down credit?
- Built in 1973 — when were the roof, HVAC, electrical panel, plumbing, and water heater last replaced?
- What does the HOA fee cover, when was the last increase, and are there any pending special assessments or reserve-fund shortfalls?
- Why hasn't it sold? Are there any deal-killer items the seller is aware of (foundation, flood, title, zoning, code violations)?
- Is there a deadline driving the sale (1031 exchange, divorce, estate, relocation)? That informs how much negotiation room exists.
- What's the average days-on-market for RENTAL listings here right now (not sales)? A rising rental-DOM trend means longer vacancies and softer asking-rent achievability than the comps imply.
- What's the recent tenant-quality profile in this submarket — average credit score on applications, eviction rate, late-payment / NSF rate, and stable-employment percentage? A property-management company in the area should have these aggregated.
- How much new for-sale + rental construction is in the pipeline within 1–3 miles? Heavy new supply typically softens prices + rents 12–24 months out; constrained supply supports both.
Investment metrics
- 1% rule
- 1.24% ✓
- Cap rate
- 7.94%
- Cash-on-cash
- 5.87%
- DSCR
- 1.26
- GRM
- 6.7
CMA / ARV
No comps found within radius.
Projected returns pro-forma
-3.0% appreciation · 0.1% rent growth · sell at horizon
- IRR
- -11.1%
- Equity multiple
- 0.61×
- Total profit
- $-16,322
- Equity at exit
- $22,365
- IRR
- -7.6%
- Equity multiple
- 0.59×
- Total profit
- $-17,075
- Equity at exit
- $12,969
Cash invested: $42,000 (down + closing). Projections, not guarantees.
Landlord ↔ Tenant lean methodology
- Overall (STATE)
- 87 Strongly Landlord-Friendly
- State Florida
- 87 Strongly Landlord-Friendly · R+3
- County
- — inherits STATE
- City
- — inherits STATE
ZIP-level market 33772
- Rents YoY
- 0.1%
- Active inventory
- 207
- Price-to-rent
- 6.7×
Monthly cashflow live
- Estimated rent
- $1,856 high interval (Pro) →
- Mortgage (P&I)
- −$787
- Tax from tax record
- −$127 /mo · $1,521/yr
- Insurance
- −$62
- HOA
- −$285
- Vacancy / Maint / Mgmt
- −$390
- Net cashflow
- $205
Break-even live
UW: 25.0% down · 7.5% · 30yr · 1.5% tax · 5.0% vac · 8.0% maint · 8.0% mgmt
Financing live
Cash to close
- Down payment
- $37,500
- Closing costs
- $4,500
- Reserves months
- —
- Total cash needed
- —
Loan-product check · same deal, 3 products live
Conventional
25% down · 7.5% · 30yr
- Down + closing
- —
- Monthly P&I
- —
- Monthly cashflow
- —
- DSCR
- —
- Eligible?
- —
Personal DTI + credit; lowest rate.
DSCR
20% down · 8.5% · 30yr
- Down + closing
- —
- Monthly P&I
- —
- Monthly cashflow
- —
- DSCR
- —
- Eligible?
- —
No personal income docs; deal must DSCR.
Hard money
10% down · 12.0% · 12mo
- Down + closing
- —
- Monthly P&I
- —
- Monthly cashflow
- —
- DSCR
- —
- Eligible?
- —
Short-term bridge; refi at stabilization.
Rent comps 31 comps
| Address | Beds | Baths | Sqft | Rent | $/sqft | DOM | Units | Dist |
|---|---|---|---|---|---|---|---|---|
| 10405 Addison Way Seminole, FL | 1.0–3.0 | 1.0–2.0 | 1133 | $2,351 | $2.08 | 2d | 18 | 0.13mi |
| 10032 65th Ave N #24 Saint Petersburg, FL | 2.0 | 2.0 | 1010 | $1,650 | $1.63 | 24d | 1 | 0.19mi |
| 10530 68th Ave Seminole, FL | 2.0 | 1.0 | 1000 | $1,690 | $1.69 | 4d | 1 | 0.23mi |
| 10035 63rd Ave N #18 Saint Petersburg, FL | 2.0 | 1.0 | 1010 | $2,125 | $2.10 | 24d | 1 | 0.24mi |
| 10037 62nd Ter N #15 Saint Petersburg, FL | 2.0 | 1.0 | 790 | $1,400 | $1.77 | 17d | 1 | 0.29mi |
| 10037 62nd Ter St. Petersburg, FL | 1.0 | 1.0 | 790 | $1,500 | $1.90 | 24d | 1 | 0.29mi |
| 10036 63rd Ave N #23 Saint Petersburg, FL | 2.0 | 1.0 | 1010 | $1,550 | $1.53 | 16d | 1 | 0.29mi |
| 10038 62nd Ter N #17 Saint Petersburg, FL | 2.0 | 1.0 | 1010 | $1,400 | $1.39 | 2d | 1 | 0.33mi |
| 9950 62nd Ter N #305 Saint Petersburg, FL | 2.0 | 2.0 | 1120 | $1,450 | $1.29 | 24d | 1 | 0.39mi |
| 9860 62nd Ter N #1048 Saint Petersburg, FL | 2.0 | 2.0 | 1020 | $1,750 | $1.72 | 24d | 1 | 0.44mi |
| 10764 70th Ave Seminole, FL | 1.0–2.0 | 1.0–2.0 | 828 | $2,200 | $2.66 | 4d | 2 | 0.50mi |
| 11234 68th Ave Seminole, FL | 2.0 | 1.5 | 960 | $2,400 | $2.50 | 7d | 1 | 0.80mi |
| 5224 100th Way N Saint Petersburg, FL | 2.0 | 1.0 | 930 | $2,400 | $2.58 | 4d | 1 | 0.94mi |
| 9950 52nd Ter N Saint Petersburg, FL | 2.0 | 1.0 | 1090 | $2,200 | $2.02 | 24d | 1 | 0.96mi |
| 10532 51st Ter N Saint Petersburg, FL | 2.0 | 1.0 | 1093 | $1,800 | $1.65 | 17d | 1 | 1.00mi |
| 4652 Miramar Dr Madeira Beach, FL | 1.0–2.0 | 1.0–2.0 | 958 | $2,475 | $2.58 | 2d | 33 | 1.15mi |
| 8080 112th St #108 Seminole, FL | 1.0 | 1.0 | 874 | $1,700 | $1.95 | 24d | 1 | 1.15mi |
| 11201 80th Ave #303 Seminole, FL | 2.0 | 2.0 | 1000 | $1,800 | $1.80 | 24d | 1 | 1.17mi |
| 7770 Starkey Rd Seminole, FL | 2.0 | 1.0 | 1035 | $1,538 | $1.49 | 1d | 4 | 1.23mi |
| 4771 100th Way N Unit 204 St. Petersburg, FL | 1.0 | 1.0 | 550 | $1,549 | $2.82 | 24d | 1 | 1.25mi |
| 4771 100th Way N Unit 101 St. Petersburg, FL | 2.0 | 1.0 | 800 | $1,749 | $2.19 | 17d | 1 | 1.25mi |
| 9940 47th Ave N #320 Saint Petersburg, FL | 2.0 | 1.0 | 900 | $1,575 | $1.75 | 24d | 1 | 1.30mi |
| 8425 112th St #104 Seminole, FL | 1.0 | 1.0 | 608 | $1,300 | $2.14 | 4d | 1 | 1.33mi |
| 1 Boca Ciega Point Blvd #115 Saint Petersburg, FL | 2.0 | 2.0 | 920 | $1,900 | $2.07 | 2d | 1 | 1.33mi |
| 11100 86th Ave #101 Seminole, FL | 1.0 | 1.0 | 874 | $1,350 | $1.54 | 17d | 1 | 1.37mi |
| 7701 Starkey Rd Largo, FL | 1.0 | 1.0 | 615 | $1,600 | $2.60 | 14d | 5 | 1.37mi |
| 8450 112th St #103 Seminole, FL | 1.0 | 1.0 | 608 | $1,250 | $2.06 | 24d | 1 | 1.39mi |
| 8892 79th Pl Seminole, FL | 3.0 | 1.0 | 912 | $2,600 | $2.85 | 4d | 1 | 1.39mi |
| 11700 Park Blvd Seminole, FL | 2.0 | 2.0 | 1010 | $1,400 | $1.39 | 24d | 1 | 1.40mi |
| 8555 112th St #206 Seminole, FL | 1.0 | 1.0 | 638 | $1,250 | $1.96 | 4d | 1 | 1.41mi |
| 11200 86th Ave #202 Seminole, FL | 2.0 | 1.0 | 836 | $1,700 | $2.03 | 4d | 1 | 1.42mi |
HOA detail
- Monthly dues
- $285 · $3,420/yr
- Likely covers
- waterpoolgym
Listing history 6 events
-
2026-03-24status Pending
-
2026-03-02price $150,000
-
2025-11-10price $155,000
-
2025-10-22$160,000 Active
-
2005-06-01soldstatus $75,000
-
1999-03-01soldstatus $21,000
ⓘ Source: listings_history table (triggers on properties + properties_extension) + one-shot
backfill from property_details.listing_events for pre-trigger history.
Tax reassessment forecast FL · Resets to sale price
- Current annual tax
- $1,521 · $127/mo
- Projected year-2 tax
- $1,521 · $127/mo
- Expected delta
- $0/yr ($0/mo · 0.0%)
ⓘ Screening estimate from a state-policy table — verify with the county assessor before closing.
Climate risk First Street
- Flood 6/10 Major FEMA zone X (unshaded) · 55% chance over 30 yrs
- Wildfire 1/10 Low
- Heat 10/10 Extreme 5 d/yr ≥107°F today · 18 d/yr by 30 yrs out
- Wind 10/10 Extreme 99% chance of damaging wind over 30 yrs
- Air quality 3/10 Moderate 2 unhealthy d/yr today · 2 by 30 yrs out
Nearby sold comps map
Loading sold comps map…
Walkable amenities ~0.75 mi
Loading nearby amenities…
Taxation est. · year 1
- Rental income
- $22,273
- − Mortgage interest
- −$8,402
- − Property taxes
- −$1,521
- − Insurance
- −$750
- − Repairs & maintenance
- −$1,782
- − Management
- −$1,782
- − HOA
- −$3,420
- − Depreciation
- −$4,364
- Taxable income
- $252
- Est. tax owed @ 24.0%
- −$60
- After-tax cash flow
- $2,404/yr
For passive investors: Depreciation is non-cash, so a rental often shows a tax loss while cash-flowing — sheltering income. Rental losses are passive: they offset passive income freely, and up to $25,000/yr can offset ordinary (W-2) income if you actively participate and your MAGI is under $100k (phasing out to $0 by $150k); unused losses carry forward. On sale, claimed depreciation is recaptured at up to 25%, and gains may owe capital-gains tax (a 1031 exchange can defer both). Figures are a year-1 estimate at your 24.0% rate — not tax advice; consult a CPA.
Schools (NCES district)
- District
- Pinellas
- NCES district ID
- 1201560
- Math proficiency
- 51% ▼ -5.00%
- Reading proficiency
- 51% ▼ -3.00%
- Median HH income
- $46,270
- Composite
- 43.27/100
- National rank
- #3046
- State rank
- #31 of 73 in FL
Livability — Bay Pines
- Score
- 81/100
- State rank
- #102
- US rank
- #1559
Category grades
Schools grade is shown separately in the Schools card above.
Census & demographics
- Census place
- Bay Pines, FL
- County
- Pinellas County · 939,478 people
- City population
- 68
- Metro
- Tampa-St. Petersburg-Clearwater, FL
- Population (ZIP)
- 23,733
- Household income
- $73,586
- Rent vs Own
- Severe rent burden
- 720.0
Population outlook (Pinellas County) Hauer SSP2
- Today (2025)
- 1,027,532 people
- By 2030
- 1,063,586 · +3.5%
- By 2040
- 1,125,020 · +9.5%
- By 2050
- 1,168,637 · +13.7%
- By 2075
- 1,265,188 · +23.1%
- By 2100
- 1,260,357 · +22.7%
Race, ethnicity, and origin ACS 2023
- Neighborhood character
- Predominantly White (84%)
- Race & ethnicity
- White 84% Hispanic / Latino 8% Two or more races 7% Asian 3% Black 2%
- Hispanic origin (detail)
- Puerto Rican 2%
- Common ancestry
- Romanian 5% Lithuanian 3% Slovak 3%
- Foreign-born
- 10% · Canada, Vietnam, Jamaica
- Languages at home
- 89% English-only · Spanish 5% Other Indo-European 1% Russian/Polish/Slavic 1%
Political lean MEDSL · Pinellas
- 2024 margin
- Lean R (+5.2) · D 46.9% · R 52.1%
- 2008→2024 swing
- -13.5pp toward R · 2008: 8.3pp · 2024: -5.2pp
- All cycles
- 2024: R+5.2 2020: D+0.2 2016: R+1.1 2012: D+5.6 2008: D+8.3
Not yet ingested
- Civics
- —
Market trends
- HPI YoY
- ▼ -485.84%
- Current HPI
- 315.303
- Rent YoY
- ▲ 0.10%
- Metro
- Tampa-St. Petersburg-Clearwater, FL
- State GDP YoY
- ▲ 3.28%
- F500 in state
- 36
Industry mix (Fortune 500 HQ in FL)
| Industry | F500 HQs | Revenue |
|---|---|---|
| Industrial Technology | 2 | $29B |
|
||
| Insurance | 2 | $17B |
|
||
| Retail | 1 | $60B |
|
||
| Technology Distribution | 1 | $58B |
|
||
| Homebuilding | 1 | $35B |
|
||
| Technology Manufacturing | 1 | $35B |
|
||
Price history
+614.3% since first listed6 events — show timeline
- 2026-03-24 Pending — Stellar MLS as Distributed by MLS Grid
- 2026-03-02 Price Changed $150,000 Stellar MLS as Distributed by MLS Grid
- 2025-11-10 Price Changed $155,000 Stellar MLS as Distributed by MLS Grid
- 2025-10-22 Listed $160,000 Stellar MLS as Distributed by MLS Grid
- 2005-06-01 Sold (Public Records) $75,000 Public Records
- 1999-03-01 Sold (Public Records) $21,000 Public Records
Property tax history
+4.1%/yrLatest (2025): $1,521 · +261.5% YoY. Source: county tax records.
Cash-flow waterfall
monthlySold comps — $/sqft
last 12 mo · ≤1 miLoading sold comps…