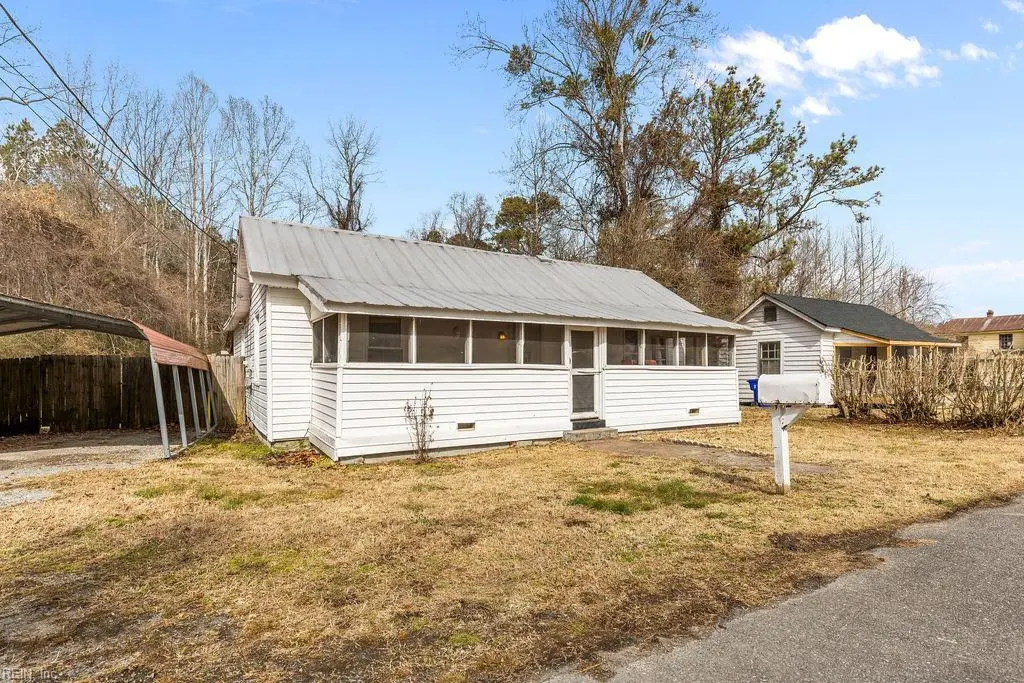
118 Sumner St · Suffolk, VA
Flood risk 1/10 · Minimal
- FEMA flood zone
- X (unshaded)
- Chance of flooding over 30 yrs
- 0.0%
- Est. flood insurance / yr
- $507 – $1,088
Fire risk 3/10 · Minor
- Est. fire insurance / yr
- $666 – $1,236
Heat risk 8/10 · Major
- Hot days now (above 108°F)
- 7 days/yr
- Hot days in 30 yrs
- 16 days/yr
Wind risk 8/10 · Major
- Chance of severe wind over 30 yrs
- 80.0%
Air-quality risk 2/10 · Minimal
- Unhealthy air days now
- 0 days/yr
- Unhealthy air days in 30 yrs
- 1 days/yr
Risk factors via First Street. Map © Google.
Why this score? — see what drove the B+ grade
The composite is a weighted blend of 9 inputs, each scored 0–100. Each bar is that input's sub-score; the figure is the points it added to the 100-point composite (weight × sub-score).
- Cash flow +30.0/30.0
- ARV discount +15.0/15.0
- 1% rule +10.0/10.0
- DSCR +10.0/10.0
- Schools +4.8/10.0
- Livability +3.9/5.0
- Rent growth +2.5/5.0
- Condition / age +2.5/5.0
- Appreciation +0.0/10.0
$183,900
🖨 Deal sheet 📄 Offer letter ✓ Due diligence
Listing remarks MLS
Welcome home to this private cottage, the last house on a quiet dead-end street, situated on a large lot in the Town of Whaleyville. Enjoy the quietness on the fully screened front porch. Inside you will find a large living room area with hard wood floors. The primary suite offers a large closet and a full bath. The kitchen is open to the dining area and includes a nice breakfast bar. The large backyard offers plenty of room for entertaining those family gatherings. Property is located less than one mile from Dollar General, Gas Station, Restaurant and Rec. Center. Come call this quiet oasis your own.
Key facts
- 0.3 acre lot
- Pool
- Built 1942
Neighborhood map
What this means for you Summary
Snapshot
- This is a 2-bed/2.0-bath single-family listed at $184k.
Deal economics
- At list price, monthly cash flow is $1k ($14k/yr) — positive.
- The deal already cash-flows at list — no discount required.
- Meets the 1% rule at list price ($3k rent vs $184k).
- Recommended offer: $173k (6.0% below list) — sets the bar for market timing.
- Cap rate 13.6% vs local median 3.5% in Suffolk — top-decile yield for the area; either an underpriced asset or a hidden risk that comps aren't pricing in. Stress-test before assuming the spread holds.
Location & tenants
- Location reads 77/100 on livability (#88 in VA, #2,896 nationally) — a middle-class / working-renter tenant base. Strengths: housing A+, health & safety A+, schools A; Watch: crime C-, commute F.
- Suffolk City Public School District (suburban): math 41% / reading 69% proficiency, ranked #72 of 131 in VA (top 55%) — acceptable for families but not a draw, mixed tenant base, ~2y average lease.
- Market conditions: 24 active listings in the ZIP; 680 units permitted in Suffolk city in 2024 (0 in 5+ unit buildings).
Forward outlook
- Local home prices are declining (-3.0%/yr); year-one equity from $1k of loan paydown is wiped out by about $6k of value loss. Plan a longer hold.
- Suffolk County population projected at +11% by 2050 — modest demand growth; plan on rents tracking national, not racing it.
- At projected returns (-3.0% appreciation + 3.0% rent growth), your $51k cash investment doubles in ~5 years — after that, you're playing with house money.
Negotiation context
- It's been on market 73 days — a 6% lower offer ($173k) is reasonable based on typical stale-listing flexibility.
- 5 sale attempts since 7y ago; this cycle's ask has dropped $11k (6%) from the opening price — seller is motivated, your offer sets the floor, not the list.
- Current owner paid $90k; list at $184k implies a 104% gain — meaningful room to come down on a strong offer.
Risks & watch-outs
- Watch-outs: built in 1942 — expect roof / HVAC / electrical / plumbing capex.
- Climate carrying-cost: severe wind risk, 80% chance of damaging wind over 30y; extreme-heat days projected 7→16/yr by 2055 (HVAC capex compounding) — expect insurance premiums to compound above CPI over the hold.
Questions for the listing agent
- It's been on market 73 days. Have you received any prior offers? Is the seller open to a 6% concession, seller financing, or rate buy-down credit?
- Built in 1942 — when were the roof, HVAC, electrical panel, plumbing, and water heater last replaced?
- Why hasn't it sold? Are there any deal-killer items the seller is aware of (foundation, flood, title, zoning, code violations)?
- Is there a deadline driving the sale (1031 exchange, divorce, estate, relocation)? That informs how much negotiation room exists.
- Schools are A-rated — typically a magnet for longer-tenancy family renters. What's the average tenant stay here, and is there a school-zone premium baked into asking?
- What's the average days-on-market for RENTAL listings here right now (not sales)? A rising rental-DOM trend means longer vacancies and softer asking-rent achievability than the comps imply.
- What's the recent tenant-quality profile in this submarket — average credit score on applications, eviction rate, late-payment / NSF rate, and stable-employment percentage? A property-management company in the area should have these aggregated.
- How much new for-sale + rental construction is in the pipeline within 1–3 miles? Heavy new supply typically softens prices + rents 12–24 months out; constrained supply supports both.
Investment metrics
- 1% rule
- 1.58% ✓
- Cap rate
- 13.64%
- Cash-on-cash
- 26.22%
- DSCR
- 2.17
- GRM
- 5.3
CMA / ARV
- ARV (median comp)
- $259,500
- List price
- $183,900
- Delta
- -29.13%
- Verdict
- UNDERPRICED
- Comps
- 4 within 1.0 mi
Show comp detail 3 sales within ~0.75 mi
| Address | Dist | Beds/Ba | Sqft | Sold | Price | $/sf | Match |
|---|---|---|---|---|---|---|---|
| 115 Robertson St | 0.09mi | 3/2.5 (+1) | 1,200 (+9%) | 3mo | $290,000 | $242 | 72 |
| 6328 Whaleyville Blvd | 0.38mi | 3/2.5 (+1) | 1,200 (+9%) | 1mo | $299,900 | $250 | 59 |
| 140 Lane St | 0.56mi | 2/1.0 | 1,008 (-8%) | 9mo | $165,000 | $164 | 48 |
Match score weights: distance 35% · size 25% · config 20% · recency 20%. Top-matched comps best support the ARV.
Projected returns pro-forma
-3.0% appreciation · 3.0% rent growth · sell at horizon
- IRR
- 20.0%
- Equity multiple
- 1.81×
- Total profit
- $41,846
- Equity at exit
- $27,420
- IRR
- 28.2%
- Equity multiple
- 3.50×
- Total profit
- $128,645
- Equity at exit
- $15,900
Cash invested: $51,492 (down + closing). Projections, not guarantees.
Landlord ↔ Tenant lean methodology
- Overall (STATE)
- 55 Moderately Landlord-Leaning
- State Virginia
- 55 Moderately Landlord-Leaning · D+2
- County
- — inherits STATE
- City
- — inherits STATE
ZIP-level market 23438
- Home prices YoY
- -34.4%
- Active inventory
- 24
- Price-to-rent
- 5.3×
Monthly cashflow live
- Estimated rent
- $2,906 medium interval (Pro) →
- Mortgage (P&I)
- −$964
- Tax from tax record
- −$130 /mo · $1,559/yr
- Insurance
- −$77
- HOA
- −$0
- Vacancy / Maint / Mgmt
- −$610
- Net cashflow
- $1,125
Break-even live
UW: 25.0% down · 7.5% · 30yr · 1.5% tax · 5.0% vac · 8.0% maint · 8.0% mgmt
Financing live
Cash to close
- Down payment
- $45,975
- Closing costs
- $5,517
- Reserves months
- —
- Total cash needed
- —
Loan-product check · same deal, 3 products live
Conventional
25% down · 7.5% · 30yr
- Down + closing
- —
- Monthly P&I
- —
- Monthly cashflow
- —
- DSCR
- —
- Eligible?
- —
Personal DTI + credit; lowest rate.
DSCR
20% down · 8.5% · 30yr
- Down + closing
- —
- Monthly P&I
- —
- Monthly cashflow
- —
- DSCR
- —
- Eligible?
- —
No personal income docs; deal must DSCR.
Hard money
10% down · 12.0% · 12mo
- Down + closing
- —
- Monthly P&I
- —
- Monthly cashflow
- —
- DSCR
- —
- Eligible?
- —
Short-term bridge; refi at stabilization.
Listing history 27 events
-
2026-06-18days on market $183,900 Active 73 DOM
-
2026-06-17days on market $183,900 Active 72 DOM
-
2026-06-16days on market $183,900 Active 71 DOM
-
2026-06-15days on market $183,900 Active 70 DOM
-
2026-06-13days on market $183,900 Active 68 DOM
-
2026-06-09days on market $183,900 Active 64 DOM
-
2026-06-08days on market $183,900 Active 63 DOM
-
2026-06-07days on market $183,900 Active 62 DOM
-
2026-06-03days on market $183,900 Active 58 DOM
-
2026-06-02days on market $183,900 Active 57 DOM
-
2026-06-01days on market $183,900 Active 56 DOM
-
2026-05-31days on market $183,900 Active 55 DOM
-
2026-05-16price $183,900 608-char remark
Show marketing remark (608 chars)
Welcome home to this private cottage, the last house on a quiet dead-end street, situated on a large lot in the Town of Whaleyville. Enjoy the quietness on the fully screened front porch. Inside you will find a large living room area with hard wood floors. The primary suite offers a large closet and a full bath. The kitchen is open to the dining area and includes a nice breakfast bar. The large backyard offers plenty of room for entertaining those family gatherings. Property is located less than one mile from Dollar General, Gas Station, Restaurant and Rec. Center. Come call this quiet oasis your own.
-
2026-04-04$195,000 Active 608-char remark
Show marketing remark (608 chars)
Welcome home to this private cottage, the last house on a quiet dead-end street, situated on a large lot in the Town of Whaleyville. Enjoy the quietness on the fully screened front porch. Inside you will find a large living room area with hard wood floors. The primary suite offers a large closet and a full bath. The kitchen is open to the dining area and includes a nice breakfast bar. The large backyard offers plenty of room for entertaining those family gatherings. Property is located less than one mile from Dollar General, Gas Station, Restaurant and Rec. Center. Come call this quiet oasis your own.
-
2026-04-03historical
-
2026-04-02status Under Contract
-
2026-04-01status Active
-
2026-03-24status Under Contract
-
2026-03-10historical Active Under Contract
-
2026-02-20$184,900 Active
-
2019-07-03soldstatus $90,000
-
2019-06-21soldstatus $90,000 Closed
-
2019-05-30status Pending
-
2019-05-21status Under Contract
-
2019-03-12$100,000 Active
-
2019-03-11$100,000 Active
-
2011-03-30soldstatus $50,000
ⓘ Source: listings_history table (triggers on properties + properties_extension) + one-shot
backfill from property_details.listing_events for pre-trigger history.
Tax reassessment forecast VA · Resets to sale price
- Current annual tax
- $1,559 · $130/mo
- Projected year-2 tax
- $1,559 · $130/mo
- Expected delta
- $0/yr ($0/mo · 0.0%)
ⓘ Screening estimate from a state-policy table — verify with the county assessor before closing.
Climate risk First Street
- Flood 1/10 Low FEMA zone X (unshaded) · 0% chance over 30 yrs
- Wildfire 3/10 Moderate
- Heat 8/10 Severe 7 d/yr ≥108°F today · 16 d/yr by 30 yrs out
- Wind 8/10 Severe 80% chance of damaging wind over 30 yrs
- Air quality 2/10 Low 0 unhealthy d/yr today · 1 by 30 yrs out
Nearby sold comps map
Loading sold comps map…
Walkable amenities ~0.75 mi
Loading nearby amenities…
Taxation est. · year 1
- Rental income
- $34,878
- − Mortgage interest
- −$10,301
- − Property taxes
- −$1,559
- − Insurance
- −$920
- − Repairs & maintenance
- −$2,790
- − Management
- −$2,790
- − Depreciation
- −$5,350
- Taxable income
- $11,168
- Est. tax owed @ 24.0%
- −$2,680
- After-tax cash flow
- $10,822/yr
For passive investors: Depreciation is non-cash, so a rental often shows a tax loss while cash-flowing — sheltering income. Rental losses are passive: they offset passive income freely, and up to $25,000/yr can offset ordinary (W-2) income if you actively participate and your MAGI is under $100k (phasing out to $0 by $150k); unused losses carry forward. On sale, claimed depreciation is recaptured at up to 25%, and gains may owe capital-gains tax (a 1031 exchange can defer both). Figures are a year-1 estimate at your 24.0% rate — not tax advice; consult a CPA.
Schools (NCES district)
- District
- Suffolk City Public School District
- NCES district ID
- 5103710
- Math proficiency
- 41% ▼ -43.00%
- Reading proficiency
- 69% ▼ -8.00%
- Median HH income
- $65,573
- Composite
- 48.31/100
- National rank
- #2151
- State rank
- #72 of 131 in VA
Livability — Suffolk
- Score
- 77/100
- State rank
- #88
- US rank
- #2896
Category grades
Schools grade is shown separately in the Schools card above.
Census & demographics
- Census place
- Suffolk, VA
- City population
- 88,108
- Population (ZIP)
- 1,620
Population outlook (Suffolk County) Hauer SSP2
- Today (2025)
- 95,269 people
- By 2030
- 98,269 · +3.1%
- By 2040
- 103,177 · +8.3%
- By 2050
- 105,777 · +11.0%
- By 2075
- 110,963 · +16.5%
- By 2100
- 103,711 · +8.9%
Race, ethnicity, and origin ACS 2023
- Neighborhood character
- Predominantly White (83%)
- Race & ethnicity
- White 83% Two or more races 6% Asian 5% Black 4% Hispanic / Latino 4%
- Common ancestry
- Slovak 3% Lithuanian 1% Iranian 1%
- Foreign-born
- 4% · Canada
- Languages at home
- 94% English-only · Other Indo-European 3% Spanish 2%
Political lean MEDSL · Suffolk
- 2024 margin
- D (+15.9) · D 57.4% · R 41.5% · Other 1.2%
- 2008→2024 swing
- +2.7pp toward D · 2008: 13.2pp · 2024: 15.9pp
- All cycles
- 2024: D+15.9 2020: D+17.3 2016: D+13.8 2012: D+15.1 2008: D+13.2
Not yet ingested
- Civics
- —
Market trends
- HPI YoY
- ▼ -84.36%
- Current HPI
- 160.6199
- Rent YoY
- —
- Metro
- —
- State GDP YoY
- ▲ 2.40%
- F500 in state
- 50
Industry mix (Fortune 500 HQ in VA)
| Industry | F500 HQs | Revenue |
|---|---|---|
| Aerospace / Defense | 4 | $236B |
|
||
| Technology / Defense | 3 | $32B |
|
||
| Financial Services | 2 | $176B |
|
||
| Utilities | 2 | $27B |
|
||
| Insurance | 2 | $25B |
|
||
| Technology | 2 | $15B |
|
||
Price history
+267.8% since first listed15 events — show timeline
- 2026-05-16 Price Changed $183,900 REINMLS
- 2026-04-04 Listed $195,000 REINMLS
- 2026-04-03 Listing Removed — REINMLS
- 2026-04-02 Pending — REINMLS
- 2026-04-01 Relisted — REINMLS
- 2026-03-24 Pending — REINMLS
- 2026-03-10 Contingent — REINMLS
- 2026-02-20 Listed $184,900 REINMLS
- 2019-07-03 Sold (Public Records) $90,000 Public Records
- 2019-06-21 Sold (MLS) $90,000 BRIGHT MLS
- 2019-05-30 Pending — BRIGHT MLS
- 2019-05-21 Pending — REINMLS
- 2019-03-12 Listed $100,000 BRIGHT MLS
- 2019-03-11 Listed $100,000 REINMLS
- 2011-03-30 Sold (Public Records) $50,000 Public Records
Property tax history
+4.6%/yrLatest (2025): $1,559 · +3.0% YoY. Source: county tax records.
Cash-flow waterfall
monthlySold comps — $/sqft
last 12 mo · ≤1 miLoading sold comps…