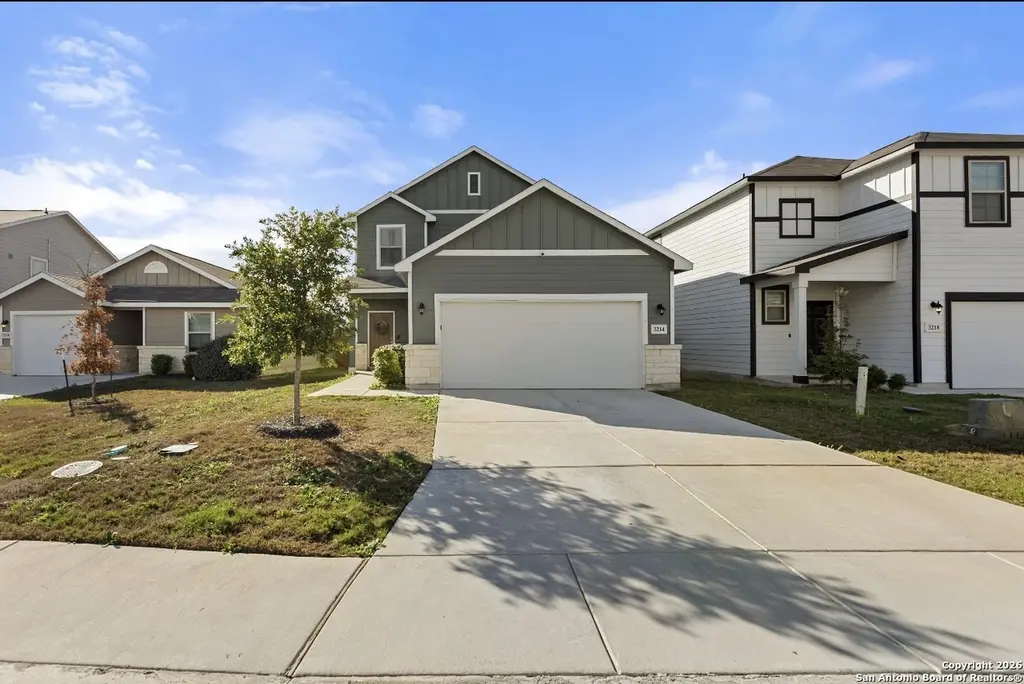
3214 Rancho Grande · San Antonio, TX
Flood risk 1/10 · Minimal
- FEMA flood zone
- X (unshaded)
- Chance of flooding over 30 yrs
- 0.0%
- Est. flood insurance / yr
- $507 – $1,088
Fire risk 5/10 · Moderate
- Est. fire insurance / yr
- $1,222 – $2,270
Heat risk 8/10 · Major
- Hot days now (above 109°F)
- 7 days/yr
- Hot days in 30 yrs
- 22 days/yr
Wind risk 8/10 · Major
- Chance of severe wind over 30 yrs
- 80.0%
Air-quality risk 2/10 · Minimal
- Unhealthy air days now
- 0 days/yr
- Unhealthy air days in 30 yrs
- 1 days/yr
Risk factors via First Street. Map © Google.
Why this score? — see what drove the D- grade
The composite is a weighted blend of 9 inputs, each scored 0–100. Each bar is that input's sub-score; the figure is the points it added to the 100-point composite (weight × sub-score).
- Appreciation +10.0/10.0
- ARV discount +9.8/15.0
- Cash flow +4.7/30.0
- Livability +4.0/5.0
- Rent growth +2.7/5.0
- Condition / age +2.5/5.0
- Schools +2.2/10.0
- 1% rule +1.8/10.0
- DSCR +0.0/10.0
$295,000
🖨 Deal sheet 📄 Offer letter ✓ Due diligence
Listing remarks MLS
Welcome to 3214 Rancho Grande, a charming home located on San Antonio's South Side with easy access to downtown, major highways, and local amenities. This property offers a functional layout with comfortable living spaces, making it a great option for homeowners or investors alike.The home features a spacious living area, well-sized bedrooms, and a practical kitchen setup ideal for everyday living or entertaining. Outside, enjoy a generous yard with room to relax, garden, or customize to your needs. Conveniently located near schools, shopping, and dining, this property combines value and location.Whether you're looking for a primary residence or an investment opportunity, 3214 Rancho Grande presents strong potential in a growing area of San Antonio. OPEN HOUSE THIS SUNDAY MAY 9TH FROM 12pm-3pm !! Come by and see your next home. A RAFFLE WILL BE HELD AT THE OPEN HOUSE !!
Key facts
- Generous yard
- Spacious living area
- Local amenities
Tags
Neighborhood map
What this means for you Summary
Snapshot
- This is a 4-bed/3.0-bath single-family listed at $295k.
Deal economics
- At list price, monthly cash flow is $-740 ($-9k/yr) — negative.
- To cash-flow at today's rent, offer at most $164k (44.3% below list).
- To meet the 1% rule (rent ≥ 1% of price), the offer needs to be $200k (32.1% below list).
- Recommended offer: $164k (44.3% below list) — sets the bar for cash-flow.
Location & tenants
- Location reads 80/100 on livability (#31 in TX, #1,616 nationally) — a professional / high-income tenant draw. Strengths: amenities A+, commute A+, cost of living A+; Watch: schools C-, crime F.
- Southwest ISD (rural): math 21% / reading 31% proficiency, ranked #701 of 826 in TX (top 85%) — low school quality limits family demand, transient renter base, plan for 1-2y turnover; 75% free/reduced lunch — lower-income household profile, screen leases tightly.
- Market conditions: Rents flat; 274 active listings in the ZIP; 27 comparable units currently listed for rent nearby; rentals lingering (median 44d on market — plan ~5-8 weeks vacancy on turnover, expect pricing pressure); 56% of comp listings sitting > 30 days — soft ceiling on asking rent; 8,308 units permitted in Bexar County in 2024 (2,506 in 5+ unit buildings).
- This rent runs 40% of the median local income ($60k/yr) — at the standard rent-burdened threshold; future hikes will face affordability resistance.
Forward outlook
- In year one you build about $32k of equity ($2k loan paydown + $30k appreciation (10.0% local appreciation)).
- Bexar County population projected at +50% by 2050 — long-run rental-demand tailwind backs the buy-and-hold thesis.
- By year 2, paydown + projected appreciation supports a ~$51k cash-out refi (75% LTV) — recoverable capital for the next deal without selling this one.
Negotiation context
- It's been on market 166 days — a 12% lower offer ($260k) is reasonable based on typical stale-listing flexibility.
- 2 sale attempts with the ask held roughly flat each time — persistent listings suggest the price (not the market) is what's stuck; bring a comps-based counter.
Risks & watch-outs
- Watch-outs: property tax is 2.5% of price.
- Climate carrying-cost: severe wind risk, 80% chance of damaging wind over 30y; moderate wildfire risk; extreme-heat days projected 7→22/yr by 2055 (HVAC capex compounding) — expect insurance premiums to compound above CPI over the hold.
Questions for the listing agent
- What do current leases actually rent for vs. the listed asking? Can we see a recent rent roll and the last 12 months of T-12 income?
- It's been on market 166 days. Have you received any prior offers? Is the seller open to a 44% concession, seller financing, or rate buy-down credit?
- Property tax is high relative to price — has the assessment been appealed recently, and will the sale trigger a re-assessment?
- What does the HOA fee cover, when was the last increase, and are there any pending special assessments or reserve-fund shortfalls?
- Why hasn't it sold? Are there any deal-killer items the seller is aware of (foundation, flood, title, zoning, code violations)?
- Is there a deadline driving the sale (1031 exchange, divorce, estate, relocation)? That informs how much negotiation room exists.
- Crime grade is F in this area — have there been break-ins, vandalism, or insurance claims at this property in the last 3 years? What carrier currently insures it and at what premium?
- The area grade is low — what's the realistic commute time and amenity access for the typical tenant pool here? Any planned neighborhood developments (good or bad) we should know about?
- What's the average days-on-market for RENTAL listings here right now (not sales)? A rising rental-DOM trend means longer vacancies and softer asking-rent achievability than the comps imply.
- What's the recent tenant-quality profile in this submarket — average credit score on applications, eviction rate, late-payment / NSF rate, and stable-employment percentage? A property-management company in the area should have these aggregated.
- How much new for-sale + rental construction is in the pipeline within 1–3 miles? Heavy new supply typically softens prices + rents 12–24 months out; constrained supply supports both.
Investment metrics
- 1% rule
- 0.68% ✗
- Cap rate
- 3.28%
- Cash-on-cash
- -10.75%
- DSCR
- 0.52
- GRM
- 12.3
CMA / ARV
- ARV (median comp)
- $311,063
- List price
- $295,000
- Delta
- -5.16%
- Verdict
- FAIR
- Comps
- 20 within 1.0 mi
Show comp detail 12 sales within ~0.75 mi
| Address | Dist | Beds/Ba | Sqft | Sold | Price | $/sf | Match |
|---|---|---|---|---|---|---|---|
| 3263 Old Almonte | 0.08mi | 4/2.5 | 2,711 (+13%) | 2mo | $299,000 | $110 | 71 |
| 10406 Labrado | 0.09mi | 3/2.5 (-1) | 2,088 (-13%) | 2mo | $260,000 | $125 | 66 |
| 10015 Rancho Real | 0.25mi | 4/2.5 | 2,188 (-9%) | 7mo | $275,000 | $126 | 66 |
| 2523 Rambo Dr | 0.71mi | 4/3.0 | 2,396 (+0%) | 6mo | $329,790 | $138 | 61 |
| 3247 Old Almonte | 0.06mi | 5/3.0 (+1) | 2,743 (+15%) | 11mo | $289,990 | $106 | 59 |
| 10410 Espada Pass | 0.32mi | 4/2.0 | 2,708 (+13%) | 7mo | $286,752 | $106 | 54 |
| 2522 Rambo Dr | 0.74mi | 4/2.5 | 2,260 (-6%) | 1mo | $314,990 | $139 | 53 |
| 2507 Rambo Dr | 0.74mi | 4/2.5 | 2,260 (-6%) | 3mo | $319,990 | $142 | 52 |
| 2527 Rambo Dr | 0.71mi | 4/2.5 | 2,511 (+5%) | 7mo | $335,375 | $134 | 51 |
| 3203 Coconino Dr | 0.68mi | 4/3.0 | 2,134 (-11%) | 1mo | $205,000 | $96 | 50 |
| 10323 Liberty Grv | 0.73mi | 4/2.5 | 2,111 (-12%) | 1mo | $306,255 | $145 | 44 |
| 2442 Redlove Dr | 0.74mi | 4/2.5 | 2,125 (-11%) | 8mo | $279,990 | $132 | 38 |
Match score weights: distance 35% · size 25% · config 20% · recency 20%. Top-matched comps best support the ARV.
Projected returns pro-forma
10.0% appreciation · 0.83% rent growth · sell at horizon
- IRR
- 16.2%
- Equity multiple
- 2.32×
- Total profit
- $109,441
- Equity at exit
- $265,759
- IRR
- 15.2%
- Equity multiple
- 5.26×
- Total profit
- $351,836
- Equity at exit
- $573,120
Cash invested: $82,600 (down + closing). Projections, not guarantees.
Landlord ↔ Tenant lean methodology
- Overall (STATE)
- 87 Strongly Landlord-Friendly
- State Texas
- 87 Strongly Landlord-Friendly · R+5
- County
- — inherits STATE
- City
- — inherits STATE
ZIP-level market 78224
- Home prices YoY
- 12.4%
- Rents YoY
- 0.8%
- Active inventory
- 274
- Price-to-rent
- 12.3×
Monthly cashflow live
- Estimated rent
- $2,002 high interval (Pro) →
- Mortgage (P&I)
- −$1,547
- Tax from tax record
- −$622 /mo · $7,461/yr
- Insurance
- −$123
- HOA
- −$30
- Vacancy / Maint / Mgmt
- −$420
- Net cashflow
- $-740
Break-even live
UW: 25.0% down · 7.5% · 30yr · 1.5% tax · 5.0% vac · 8.0% maint · 8.0% mgmt
Financing live
Cash to close
- Down payment
- $73,750
- Closing costs
- $8,850
- Reserves months
- —
- Total cash needed
- —
Loan-product check · same deal, 3 products live
Conventional
25% down · 7.5% · 30yr
- Down + closing
- —
- Monthly P&I
- —
- Monthly cashflow
- —
- DSCR
- —
- Eligible?
- —
Personal DTI + credit; lowest rate.
DSCR
20% down · 8.5% · 30yr
- Down + closing
- —
- Monthly P&I
- —
- Monthly cashflow
- —
- DSCR
- —
- Eligible?
- —
No personal income docs; deal must DSCR.
Hard money
10% down · 12.0% · 12mo
- Down + closing
- —
- Monthly P&I
- —
- Monthly cashflow
- —
- DSCR
- —
- Eligible?
- —
Short-term bridge; refi at stabilization.
Rent comps 27 comps
| Address | Beds | Baths | Sqft | Rent | $/sqft | DOM | Units | Dist |
|---|---|---|---|---|---|---|---|---|
| 3322 Rancho Grande San Antonio, TX | 4.0 | 2.5 | 2094 | $1,895 | $0.90 | 11d | 1 | 0.17mi |
| 10119 Jardin Verde San Antonio, TX | 3.0 | 2.5 | 1944 | $1,750 | $0.90 | 43d | 1 | 0.22mi |
| 3331 Rosita Way San Antonio, TX | 3.0 | 2.5 | 1848 | $1,800 | $0.97 | 43d | 1 | 0.33mi |
| 3434 Hacienda Way San Antonio, TX | 4.0 | 2.5 | 2141 | $1,900 | $0.89 | 16d | 1 | 0.35mi |
| 3434 Hacienda Way San Antonio, TX | 4.0 | 2.5 | 2141 | $2,000 | $0.93 | 21d | 1 | 0.35mi |
| 3523 Rancho Grande San Antonio, TX | 4.0 | 3.0 | 2393 | $2,000 | $0.84 | 1d | 1 | 0.42mi |
| 2434 Dry Moss Way San Antonio, TX | 4.0 | 2.5 | 2417 | $2,500 | $1.03 | 1d | 1 | 0.76mi |
| 2343 Applewhite Mdw San Antonio, TX | 4.0 | 2.5 | 1798 | $1,795 | $1.00 | 23d | 1 | 0.85mi |
| 2318 Applewhite Mdw San Antonio, TX | 4.0 | 2.5 | 1798 | $1,795 | $1.00 | 23d | 1 | 0.90mi |
| 2307 Applewhite Mdw San Antonio, TX | 4.0 | 2.5 | 1798 | $1,750 | $0.97 | 43d | 1 | 0.92mi |
| 2242 Fishing Trl San Antonio, TX | 4.0 | 2.5 | 1917 | $1,785 | $0.93 | 43d | 1 | 1.01mi |
| 2235 Fishing Trl San Antonio, TX | 4.0 | 2.5 | 1847 | $1,755 | $0.95 | 43d | 1 | 1.01mi |
| 2230 Fishing Trl San Antonio, TX | 4.0 | 2.5 | 1847 | $1,755 | $0.95 | 23d | 1 | 1.04mi |
| 2226 Fishing Trl San Antonio, TX | 3.0 | 2.5 | 1777 | $1,650 | $0.93 | 23d | 1 | 1.05mi |
| 2222 Fishing Trl San Antonio, TX | 4.0 | 2.5 | 1917 | $1,785 | $0.93 | 23d | 1 | 1.06mi |
| 9427 Somers Bnd San Antonio, TX | 3.0 | 2.5 | 1950 | $1,650 | $0.85 | 43d | 1 | 1.07mi |
| 2115 Bigmouth Rod San Antonio, TX | 4.0 | 2.5 | 1847 | $1,755 | $0.95 | 43d | 1 | 1.10mi |
| 2111 Bigmouth Rod San Antonio, TX | 4.0 | 2.5 | 1917 | $1,700 | $0.89 | 43d | 1 | 1.11mi |
| 2107 Bigmouth Rod San Antonio, TX | 3.0 | 2.5 | 1777 | $1,675 | $0.94 | 43d | 1 | 1.12mi |
| 9419 Trap Rock Dr San Antonio, TX | 4.0 | 2.5 | 2126 | $1,750 | $0.82 | 4d | 1 | 1.12mi |
| 10719 Butterfly Pass San Antonio, TX | 3.0 | 2.5 | 1645 | $1,640 | $1.00 | 43d | 1 | 1.23mi |
| 10723 Butterfly Pass San Antonio, TX | 4.0 | 2.5 | 1687 | $1,675 | $0.99 | 43d | 1 | 1.23mi |
| 10523 Goose Way San Antonio, TX | 4.0 | 2.5 | 1917 | $1,785 | $0.93 | 43d | 1 | 1.23mi |
| 10710 Butterfly Pass San Antonio, TX | 4.0 | 2.5 | 1917 | $1,785 | $0.93 | 43d | 1 | 1.25mi |
| 10723 Goose Way San Antonio, TX | 4.0 | 2.5 | 1917 | $1,785 | $0.93 | 43d | 1 | 1.27mi |
| 1347 Neria LOOP San Antonio, TX | 4.0 | 2.5 | 2173 | $1,699 | $0.78 | 43d | 1 | 1.45mi |
| 10811 Soupe CV San Antonio, TX | 4.0 | 2.5 | 2173 | $1,995 | $0.92 | 2d | 1 | 1.45mi |
HOA detail
- Monthly dues
- $30 · $360/yr
Listing history 19 events
-
2026-06-18days on market $295,000 Active 166 DOM
-
2026-06-17days on market $295,000 Active 165 DOM
-
2026-06-16days on market $295,000 Active 164 DOM
-
2026-06-15days on market $295,000 Active 163 DOM
-
2026-06-13days on market $295,000 Active 161 DOM
-
2026-06-09days on market $295,000 Active 157 DOM
-
2026-06-08days on market $295,000 Active 156 DOM
-
2026-06-07days on market $295,000 Active 155 DOM
-
2026-06-04days on market $295,000 Active 152 DOM
-
2026-06-03days on market $295,000 Active 151 DOM
-
2026-06-02days on market $295,000 Active 150 DOM
-
2026-06-01days on market $295,000 Active 149 DOM
-
2026-05-31days on market $295,000 Active 148 DOM
-
2026-04-22price $295,000 882-char remark
Show marketing remark (882 chars)
Welcome to 3214 Rancho Grande, a charming home located on San Antonio's South Side with easy access to downtown, major highways, and local amenities. This property offers a functional layout with comfortable living spaces, making it a great option for homeowners or investors alike.The home features a spacious living area, well-sized bedrooms, and a practical kitchen setup ideal for everyday living or entertaining. Outside, enjoy a generous yard with room to relax, garden, or customize to your needs. Conveniently located near schools, shopping, and dining, this property combines value and location.Whether you're looking for a primary residence or an investment opportunity, 3214 Rancho Grande presents strong potential in a growing area of San Antonio. OPEN HOUSE THIS SUNDAY MAY 9TH FROM 12pm-3pm !! Come by and see your next home. A RAFFLE WILL BE HELD AT THE OPEN HOUSE !!
-
2026-04-20status Back on Market 882-char remark
Show marketing remark (882 chars)
Welcome to 3214 Rancho Grande, a charming home located on San Antonio's South Side with easy access to downtown, major highways, and local amenities. This property offers a functional layout with comfortable living spaces, making it a great option for homeowners or investors alike.The home features a spacious living area, well-sized bedrooms, and a practical kitchen setup ideal for everyday living or entertaining. Outside, enjoy a generous yard with room to relax, garden, or customize to your needs. Conveniently located near schools, shopping, and dining, this property combines value and location.Whether you're looking for a primary residence or an investment opportunity, 3214 Rancho Grande presents strong potential in a growing area of San Antonio. OPEN HOUSE THIS SUNDAY MAY 9TH FROM 12pm-3pm !! Come by and see your next home. A RAFFLE WILL BE HELD AT THE OPEN HOUSE !!
-
2026-04-09historical Active Option 882-char remark
Show marketing remark (882 chars)
Welcome to 3214 Rancho Grande, a charming home located on San Antonio's South Side with easy access to downtown, major highways, and local amenities. This property offers a functional layout with comfortable living spaces, making it a great option for homeowners or investors alike.The home features a spacious living area, well-sized bedrooms, and a practical kitchen setup ideal for everyday living or entertaining. Outside, enjoy a generous yard with room to relax, garden, or customize to your needs. Conveniently located near schools, shopping, and dining, this property combines value and location.Whether you're looking for a primary residence or an investment opportunity, 3214 Rancho Grande presents strong potential in a growing area of San Antonio. OPEN HOUSE THIS SUNDAY MAY 9TH FROM 12pm-3pm !! Come by and see your next home. A RAFFLE WILL BE HELD AT THE OPEN HOUSE !!
-
2026-03-13price $299,999 882-char remark
Show marketing remark (882 chars)
Welcome to 3214 Rancho Grande, a charming home located on San Antonio's South Side with easy access to downtown, major highways, and local amenities. This property offers a functional layout with comfortable living spaces, making it a great option for homeowners or investors alike.The home features a spacious living area, well-sized bedrooms, and a practical kitchen setup ideal for everyday living or entertaining. Outside, enjoy a generous yard with room to relax, garden, or customize to your needs. Conveniently located near schools, shopping, and dining, this property combines value and location.Whether you're looking for a primary residence or an investment opportunity, 3214 Rancho Grande presents strong potential in a growing area of San Antonio. OPEN HOUSE THIS SUNDAY MAY 9TH FROM 12pm-3pm !! Come by and see your next home. A RAFFLE WILL BE HELD AT THE OPEN HOUSE !!
-
2026-03-04price $307,000 882-char remark
Show marketing remark (882 chars)
Welcome to 3214 Rancho Grande, a charming home located on San Antonio's South Side with easy access to downtown, major highways, and local amenities. This property offers a functional layout with comfortable living spaces, making it a great option for homeowners or investors alike.The home features a spacious living area, well-sized bedrooms, and a practical kitchen setup ideal for everyday living or entertaining. Outside, enjoy a generous yard with room to relax, garden, or customize to your needs. Conveniently located near schools, shopping, and dining, this property combines value and location.Whether you're looking for a primary residence or an investment opportunity, 3214 Rancho Grande presents strong potential in a growing area of San Antonio. OPEN HOUSE THIS SUNDAY MAY 9TH FROM 12pm-3pm !! Come by and see your next home. A RAFFLE WILL BE HELD AT THE OPEN HOUSE !!
-
2026-01-03$307,500 New 882-char remark
Show marketing remark (882 chars)
Welcome to 3214 Rancho Grande, a charming home located on San Antonio's South Side with easy access to downtown, major highways, and local amenities. This property offers a functional layout with comfortable living spaces, making it a great option for homeowners or investors alike.The home features a spacious living area, well-sized bedrooms, and a practical kitchen setup ideal for everyday living or entertaining. Outside, enjoy a generous yard with room to relax, garden, or customize to your needs. Conveniently located near schools, shopping, and dining, this property combines value and location.Whether you're looking for a primary residence or an investment opportunity, 3214 Rancho Grande presents strong potential in a growing area of San Antonio. OPEN HOUSE THIS SUNDAY MAY 9TH FROM 12pm-3pm !! Come by and see your next home. A RAFFLE WILL BE HELD AT THE OPEN HOUSE !!
ⓘ Source: listings_history table (triggers on properties + properties_extension) + one-shot
backfill from property_details.listing_events for pre-trigger history.
Tax reassessment forecast TX · Resets to sale price
- Current annual tax
- $7,461 · $622/mo
- Projected year-2 tax
- $7,461 · $622/mo
- Expected delta
- $0/yr ($0/mo · 0.0%)
ⓘ Screening estimate from a state-policy table — verify with the county assessor before closing.
Climate risk First Street
- Flood 1/10 Low FEMA zone X (unshaded) · 0% chance over 30 yrs
- Wildfire 5/10 Major
- Heat 8/10 Severe 7 d/yr ≥109°F today · 22 d/yr by 30 yrs out
- Wind 8/10 Severe 80% chance of damaging wind over 30 yrs
- Air quality 2/10 Low 0 unhealthy d/yr today · 1 by 30 yrs out
Nearby sold comps map
Loading sold comps map…
Walkable amenities ~0.75 mi
Loading nearby amenities…
Taxation est. · year 1
- Rental income
- $24,021
- − Mortgage interest
- −$16,525
- − Property taxes
- −$7,461
- − Insurance
- −$1,475
- − Repairs & maintenance
- −$1,922
- − Management
- −$1,922
- − HOA
- −$360
- − Depreciation
- −$8,582
- Taxable loss
- −$14,225
- Est. tax savings @ 24.0%
- +$3,414
- After-tax cash flow
- $-5,470/yr
For passive investors: Depreciation is non-cash, so a rental often shows a tax loss while cash-flowing — sheltering income. Rental losses are passive: they offset passive income freely, and up to $25,000/yr can offset ordinary (W-2) income if you actively participate and your MAGI is under $100k (phasing out to $0 by $150k); unused losses carry forward. On sale, claimed depreciation is recaptured at up to 25%, and gains may owe capital-gains tax (a 1031 exchange can defer both). Figures are a year-1 estimate at your 24.0% rate — not tax advice; consult a CPA.
Schools (NCES district)
- District
- Southwest ISD
- NCES district ID
- 4840950
- Math proficiency
- 21% ▼ -21.00%
- Reading proficiency
- 31% ▼ -5.00%
- Median HH income
- $43,362
- Composite
- 22.22/100
- National rank
- #8153
- State rank
- #701 of 826 in TX
Livability — San Antonio
- Score
- 80/100
- State rank
- #31
- US rank
- #1616
Category grades
Schools grade is shown separately in the Schools card above.
Census & demographics
- Census place
- San Antonio, TX
- County
- Bexar County · 1,990,555 people
- City population
- 1,806,925
- Metro
- San Antonio-New Braunfels, TX
- Population (ZIP)
- 22,232
- Household income
- $59,891
- Rent vs Own
- Severe rent burden
- 721.0
Population outlook (Bexar County) Hauer SSP2
- Today (2025)
- 2,336,851 people
- By 2030
- 2,560,728 · +9.6%
- By 2040
- 3,020,569 · +29.3%
- By 2050
- 3,493,522 · +49.5%
- By 2075
- 4,668,459 · +99.8%
- By 2100
- 5,533,242 · +136.8%
Race, ethnicity, and origin ACS 2023
- Neighborhood character
- Predominantly Hispanic (90%)
- Race & ethnicity
- Hispanic / Latino 90% Two or more races 24% White 6% Native American 2% Asian 2%
- Hispanic origin (detail)
- Mexican 75%
- Common ancestry
- Italian 1%
- Foreign-born
- 18% · Canada, Vietnam, China
- Languages at home
- 44% English-only · Spanish 55% Chinese 1%
Political lean MEDSL · Bexar
- 2024 margin
- Lean D (+9.8) · D 54.3% · R 44.6% · Other 1.1%
- 2008→2024 swing
- +4.2pp toward D · 2008: 5.6pp · 2024: 9.8pp
- All cycles
- 2024: D+9.8 2020: D+18.2 2016: D+13.5 2012: D+4.6 2008: D+5.6
Not yet ingested
- Civics
- —
Market trends
- HPI YoY
- ▲ 29.95%
- Current HPI
- 272.0709
- Rent YoY
- ▲ 0.83%
- Metro
- San Antonio-New Braunfels, TX
- State GDP YoY
- ▲ 3.95%
- F500 in state
- 110
Industry mix (Fortune 500 HQ in TX)
| Industry | F500 HQs | Revenue |
|---|---|---|
| Energy | 16 | $1,198B |
|
||
| Technology | 5 | $198B |
|
||
| Engineering / Construction | 4 | $72B |
|
||
| Energy Services | 3 | $60B |
|
||
| Utilities | 3 | $41B |
|
||
| Healthcare | 2 | $330B |
|
||
Price history
-4.1% since first listed6 events — show timeline
- 2026-04-22 Price Changed $295,000 LERA
- 2026-04-20 Relisted — LERA
- 2026-04-09 Contingent — LERA
- 2026-03-13 Price Changed $299,999 LERA
- 2026-03-04 Price Changed $307,000 LERA
- 2026-01-03 Listed $307,500 LERA
Property tax history
+60.3%/yrLatest (2025): $7,461 · -3.3% YoY. Source: county tax records.
Cash-flow waterfall
monthlySold comps — $/sqft
last 12 mo · ≤1 miLoading sold comps…