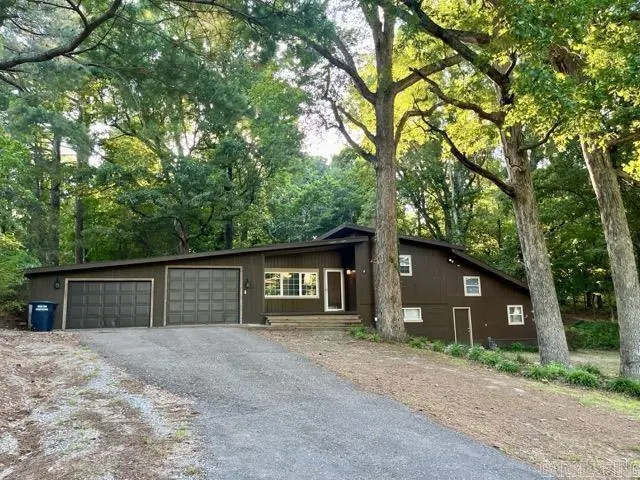
765 S 14th Ave · Piggott, AR
Flood risk 1/10 · Minimal
- FEMA flood zone
- X (unshaded)
- Chance of flooding over 30 yrs
- 0.0%
- Est. flood insurance / yr
- $507 – $1,088
Fire risk 3/10 · Minor
- Est. fire insurance / yr
- $1,499 – $2,785
Heat risk 5/10 · Moderate
- Hot days now (above 109°F)
- 7 days/yr
- Hot days in 30 yrs
- 19 days/yr
Wind risk 3/10 · Minor
- Chance of severe wind over 30 yrs
- 6.0%
Air-quality risk 2/10 · Minimal
- Unhealthy air days now
- 0 days/yr
- Unhealthy air days in 30 yrs
- 1 days/yr
Risk factors via First Street. Map © Google.
Why this score? — see what drove the C- grade
The composite is a weighted blend of 9 inputs, each scored 0–100. Each bar is that input's sub-score; the figure is the points it added to the 100-point composite (weight × sub-score).
- Cash flow +15.0/30.0
- Appreciation +10.0/10.0
- ARV discount +7.5/15.0
- 1% rule +5.0/10.0
- DSCR +5.0/10.0
- Livability +3.5/5.0
- Rent growth +2.5/5.0
- Schools +2.5/10.0
- Condition / age +2.5/5.0
$1
🖨 Deal sheet 📄 Offer letter ✓ Due diligence
Listing remarks
Situated on 1.87± acres at the end of a road, this 3 bedroom, 2 bath split-level Mid-Century style home offers approximately 2,573 square feet of living space surrounded by mature trees and an established yard. The home features wood flooring, a fireplace, and a versatile flex room that may be used as additional living space, a primary bedroom, potential mother-in-law quarters, a game room, or other use to suit a buyer's needs. An additional kitchen area provides added functionality and flexibility. A large laundry/utility room includes a laundry chute, and all kitchen appliances currently in the home will convey with the property. Outdoor features include a back deck, above-ground p
Key facts
- Wood flooring
- Flex room
- Fireplace
Tags
Property features AI
Finance
- Other: Approximately 1.87 acres (courthouse source); Approximate finished area recorded (courthouse source)
Exterior
- Parking: Attached garage for 2 cars
- Utilities: Public sewer; Public water; Electric service (municipal plus Entergy); Natural gas
- Home design: Wood exterior
- Construction: Wood construction; Rolled roofing; 3-tab shingle roofing; Piers foundation
- Exterior features: Deck; Porch; Above-ground pool; Guttering; Paved road access; Sloped and level lot areas; Located inside city limits
Interior
- Kitchen: Free-standing stove; Gas range; Microwave; Dishwasher; Disposal
- Flooring: Carpet; Wood flooring; Tile flooring
- Bathrooms: Two full bathrooms
- Heating & cooling: Central gas heat; Central electric cooling
- Interior features: Laundry chute; Balcony/loft; Built-in features; Ceiling fans; Gas-log fireplace; Sheetrock walls/ceilings; Other wall/ceiling finishes
- Laundry & utility: Laundry room; Laundry chute
Neighborhood map
What this means for you Summary
Snapshot
- This is a 3-bed/2.0-bath single-family listed at $1.
Deal economics
- At list price, monthly cash flow is $824 ($10k/yr) — positive.
- The deal already cash-flows at list — no discount required.
- Meets the 1% rule at list price ($1k rent vs $1).
- Cap rate 988316.4% vs local median 4.4% in Piggott — top-decile yield for the area; either an underpriced asset or a hidden risk that comps aren't pricing in. Stress-test before assuming the spread holds.
Location & tenants
- Location reads 70/100 on livability (#50 in AR) — a middle-class / working-renter tenant base. Strengths: crime A+, cost of living A+, housing A+; Watch: schools F, amenities F, commute F.
- Piggott School District (town): math 32% / reading 28% proficiency, ranked #157 of 238 in AR (top 66%) — families likely to look elsewhere, expect single-tenant / working-renter base with shorter leases.
- Market conditions: 71 active listings in the ZIP; 4 units permitted in Clay County in 2024 (0 in 5+ unit buildings).
Forward outlook
- Clay County population projected at -24% by 2050 — secular population decline; favor cash flow + early exit over multi-decade hold.
- At projected returns (10.0% appreciation + 3.0% rent growth), your $0 cash investment doubles in ~1 year — after that, you're playing with house money.
Negotiation context
- It's been on market 15 days — a 2% lower offer ($0) is reasonable based on typical stale-listing flexibility.
Risks & watch-outs
- Climate carrying-cost: extreme-heat days projected 7→19/yr by 2055 (HVAC capex compounding) — expect insurance premiums to compound above CPI over the hold.
Questions for the listing agent
- Is there a deadline driving the sale (1031 exchange, divorce, estate, relocation)? That informs how much negotiation room exists.
- Schools are F-rated, which usually means shorter tenancies and higher turnover. Who's the typical renter profile here, and what's been the actual vacancy rate?
- What's the average days-on-market for RENTAL listings here right now (not sales)? A rising rental-DOM trend means longer vacancies and softer asking-rent achievability than the comps imply.
- What's the recent tenant-quality profile in this submarket — average credit score on applications, eviction rate, late-payment / NSF rate, and stable-employment percentage? A property-management company in the area should have these aggregated.
- How much new for-sale + rental construction is in the pipeline within 1–3 miles? Heavy new supply typically softens prices + rents 12–24 months out; constrained supply supports both.
Investment metrics
- 1% rule
- 104253.00% ✓
- Cap rate
- 988316.44%
- Cash-on-cash
- 3529679.10%
- DSCR
- 157051.86
- GRM
- 0.0
CMA / ARV
- ARV (on-the-fly)
- $210,986
- Comps found
- 7
Show comp detail 7 sales within ~0.75 mi
| Address | Dist | Beds/Ba | Sqft | Sold | Price | $/sf | Match |
|---|---|---|---|---|---|---|---|
| 691 Crestline Dr | 0.36mi | 4/2.0 (+1) | 2,770 (+8%) | 3mo | $205,000 | $74 | 63 |
| 1560 Heritage Park Rd | 0.52mi | 3/2.0 | 2,434 (-5%) | 20mo | $260,000 | $107 | 50 |
| 305 N 8th Ave | 0.70mi | 4/2.0 (+1) | 2,380 (-8%) | 2mo | $195,000 | $82 | 48 |
| 1304 Hillcrest Dr | 0.38mi | 4/3.0 (+1) | 2,400 (-7%) | 19mo | $230,500 | $96 | 46 |
| 1848 S 12th Ave | 0.69mi | 3/2.5 | 2,448 (-5%) | 17mo | $294,000 | $120 | 44 |
| 1887 Heritage Park Rd | 0.63mi | 3/2.5 | 2,226 (-14%) | 8mo | $70,000 | $31 | 40 |
| 1268 Fair Dr | 0.49mi | 4/2.0 (+1) | 2,330 (-9%) | 22mo | $179,900 | $77 | 38 |
Match score weights: distance 35% · size 25% · config 20% · recency 20%. Top-matched comps best support the ARV.
Projected returns pro-forma
10.0% appreciation · 3.0% rent growth · sell at horizon
- IRR
- —
- Equity multiple
- 187398.40×
- Total profit
- $52,471
- Equity at exit
- $1
- IRR
- —
- Equity multiple
- 404644.88×
- Total profit
- $113,300
- Equity at exit
- $2
Cash invested: $0 (down + closing). Projections, not guarantees.
Landlord ↔ Tenant lean methodology
- Overall (STATE)
- 92 Strongly Landlord-Friendly
- State Arkansas
- 92 Strongly Landlord-Friendly · R+14
- County
- — inherits STATE
- City
- — inherits STATE
ZIP-level market 72454
- Home prices YoY
- 3.4%
- Active inventory
- 71
Monthly cashflow live
- Estimated rent
- $1,043 medium interval (Pro) →
- Mortgage (P&I)
- −$0
- Tax est. 1.5%
- −$0 /mo · $0/yr
- Insurance
- −$0
- HOA
- −$0
- Vacancy / Maint / Mgmt
- −$219
- Net cashflow
- $824
Break-even live
UW: 25.0% down · 7.5% · 30yr · 1.5% tax · 5.0% vac · 8.0% maint · 8.0% mgmt
Financing live
Cash to close
- Down payment
- $0
- Closing costs
- $0
- Reserves months
- —
- Total cash needed
- —
Loan-product check · same deal, 3 products live
Conventional
25% down · 7.5% · 30yr
- Down + closing
- —
- Monthly P&I
- —
- Monthly cashflow
- —
- DSCR
- —
- Eligible?
- —
Personal DTI + credit; lowest rate.
DSCR
20% down · 8.5% · 30yr
- Down + closing
- —
- Monthly P&I
- —
- Monthly cashflow
- —
- DSCR
- —
- Eligible?
- —
No personal income docs; deal must DSCR.
Hard money
10% down · 12.0% · 12mo
- Down + closing
- —
- Monthly P&I
- —
- Monthly cashflow
- —
- DSCR
- —
- Eligible?
- —
Short-term bridge; refi at stabilization.
Listing history 12 events
-
2026-06-19days on market $1 Active 15 DOM
-
2026-06-18days on market $1 Active 14 DOM
-
2026-06-17days on market $1 Active 13 DOM
-
2026-06-16days on market $1 Active 12 DOM
-
2026-06-15days on market $1 Active 11 DOM
-
2026-06-14days on market $1 Active 9 DOM
-
2026-06-12statusdays on market $1 Active 8 DOM
-
2026-06-09days on market $1 New Listing 5 DOM
-
2026-06-08days on market $1 New Listing 4 DOM
-
2026-06-07days on market $1 New Listing 3 DOM
-
2026-06-05remarks 692-char remark
-
2026-06-05$1 New Listing 1 DOM
ⓘ Source: listings_history table (triggers on properties + properties_extension) + one-shot
backfill from property_details.listing_events for pre-trigger history.
Climate risk First Street
- Flood 1/10 Low FEMA zone X (unshaded) · 0% chance over 30 yrs
- Wildfire 3/10 Moderate
- Heat 5/10 Major 7 d/yr ≥109°F today · 19 d/yr by 30 yrs out
- Wind 3/10 Moderate 6% chance of damaging wind over 30 yrs
- Air quality 2/10 Low 0 unhealthy d/yr today · 1 by 30 yrs out
Nearby sold comps map
Loading sold comps map…
Walkable amenities ~0.75 mi
Loading nearby amenities…
Taxation est. · year 1
- Rental income
- $12,510
- − Mortgage interest
- −$0
- − Property taxes
- −$0
- − Insurance
- −$0
- − Repairs & maintenance
- −$1,001
- − Management
- −$1,001
- − Depreciation
- −$0
- Taxable income
- $10,509
- Est. tax owed @ 24.0%
- −$2,522
- After-tax cash flow
- $7,361/yr
For passive investors: Depreciation is non-cash, so a rental often shows a tax loss while cash-flowing — sheltering income. Rental losses are passive: they offset passive income freely, and up to $25,000/yr can offset ordinary (W-2) income if you actively participate and your MAGI is under $100k (phasing out to $0 by $150k); unused losses carry forward. On sale, claimed depreciation is recaptured at up to 25%, and gains may owe capital-gains tax (a 1031 exchange can defer both). Figures are a year-1 estimate at your 24.0% rate — not tax advice; consult a CPA.
Schools (NCES district)
- District
- Piggott School District
- NCES district ID
- 0511370
- Math proficiency
- 32% ▼ -15.00%
- Reading proficiency
- 28% ▼ -10.00%
- Median HH income
- $33,336
- Composite
- 24.63/100
- National rank
- #7628
- State rank
- #157 of 238 in AR
Livability — Piggott
- Score
- 70/100
- State rank
- #50
- US rank
- #7358
Category grades
Schools grade is shown separately in the Schools card above.
Census & demographics
- Census place
- Piggott, AR
- Population (ZIP)
- 4,699
Population outlook (Clay County) Hauer SSP2
- Today (2025)
- 13,564 people
- By 2030
- 12,834 · -5.4%
- By 2040
- 11,498 · -15.2%
- By 2050
- 10,325 · -23.9%
- By 2075
- 8,228 · -39.3%
- By 2100
- 6,675 · -50.8%
Race, ethnicity, and origin ACS 2023
- Neighborhood character
- Predominantly White (94%)
- Race & ethnicity
- White 94% Two or more races 5% Hispanic / Latino 2%
- Common ancestry
- Slovak 1% Serbian 1% Italian 1%
- Foreign-born
- 1%
- Languages at home
- 99% English-only · German/W. Germanic 1%
Political lean MEDSL · Clay
- 2024 margin
- Solid R (+61.6) · D 18.3% · R 79.9% · Other 1.9%
- 2008→2024 swing
- -47.3pp toward R · 2008: -14.3pp · 2024: -61.6pp
- All cycles
- 2024: R+61.6 2020: R+60.3 2016: R+29.8 2012: R+29.1 2008: R+14.3
Not yet ingested
- Civics
- —
Market trends
- HPI YoY
- ▲ 11.57%
- Current HPI
- 355.7877
- Rent YoY
- —
- Metro
- —
- State GDP YoY
- ▲ 3.80%
- F500 in state
- 10
Industry mix (Fortune 500 HQ in AR)
| Industry | F500 HQs | Revenue |
|---|---|---|
| Retail | 1 | $681B |
|
||
| Food / Agriculture | 1 | $53B |
|
||
| Retail / Energy | 1 | $22B |
|
||
| Transportation / Logistics | 1 | $12B |
|
||
| Energy | 1 | $4B |
|
||
Price history
2 events — show timeline
- 2026-06-03 Listed $1 CARMLS
- 2013-11-12 Sold (Public Records) $81,000 Public Records
Property tax history
-3.3%/yrLatest (2025): $390 · -12.8% YoY. Source: county tax records.
Cash-flow waterfall
monthlySold comps — $/sqft
last 12 mo · ≤1 miLoading sold comps…