6403 Old Westham Dr N · Suffolk, VA
Flood risk 3/10 · Minor
- FEMA flood zone
- X (unshaded)
- Chance of flooding over 30 yrs
- 0.07%
- Est. flood insurance / yr
- $507 – $1,088
Fire risk 2/10 · Minimal
- Est. fire insurance / yr
- $666 – $1,236
Heat risk 9/10 · Severe
- Hot days now (above 106°F)
- 7 days/yr
- Hot days in 30 yrs
- 16 days/yr
Wind risk 8/10 · Major
- Chance of severe wind over 30 yrs
- 80.0%
Air-quality risk 2/10 · Minimal
- Unhealthy air days now
- 1 days/yr
- Unhealthy air days in 30 yrs
- 3 days/yr
Risk factors via First Street. Map © Google.
Why this score? — see what drove the C- grade
The composite is a weighted blend of 9 inputs, each scored 0–100. Each bar is that input's sub-score; the figure is the points it added to the 100-point composite (weight × sub-score).
- ARV discount +15.0/15.0
- Cash flow +11.9/30.0
- Rent growth +5.0/5.0
- Schools +4.8/10.0
- Livability +3.9/5.0
- 1% rule +3.6/10.0
- DSCR +3.5/10.0
- Condition / age +2.5/5.0
- Appreciation +0.0/10.0
$309,900
🖨 Deal sheet (PDF) 📄 Offer letter ✓ Due diligence
Listing remarks
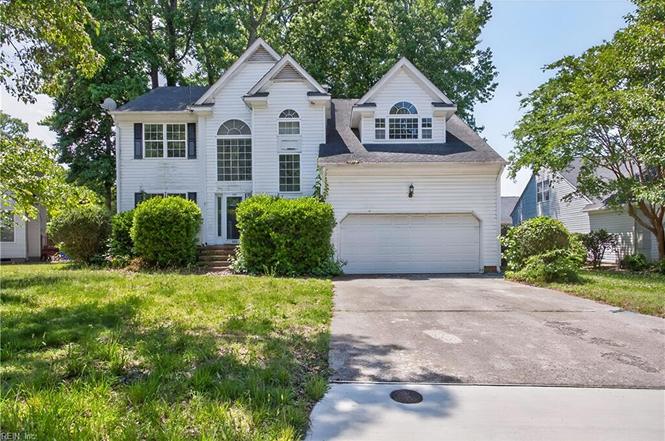
3-4 Bedroom, 2.5 bath Home on cul-de-sac in wonderful Suffolk neighborhood! A two story foyer welcomes you into this diamond in the rough. Great bones and in need of a total rehab. A formal living room, dining room, roomy family room with a cozy gas fireplace to set the stage for those winter nights. A spacious eat-in kitchen w/ center island and a half bath finish off the first floor. Upstairs awaits the oversized primary suite with a unique 3 sided fireplace and private bath. Two other bedrooms down the hall can accommodate guests, children or be your home office or hobby room! Upgraded features to include tray ceilings, crown molding, central vac, 2 zone HVAC & sprinkler system. Ca
Key facts
- Cozy gas fireplace
- Private bath
- Two story foyer
Tags
Property features AI
Finance
- Other: Property listed as fixer upper
- HOA & community: HOA present (Burbage Grant HOA); POA/HOA amenities: clubhouse, ground maintenance, playgrounds, pool; Association fee: $45 monthly
Exterior
- Parking: Attached 2-car garage (approx. 420 sq ft)
- Utilities: City/County sewer
- Home design: Detached single-family home; Transitional style; Two stories; Two living levels; Crawlspace foundation
- Construction: Vinyl exterior; Asphalt shingle roof; Crawl foundation
- Exterior features: Patio; Vinyl siding; Lot approximately 0.27 acre; Lot dimensions: 78' x 138' x 83' x 137'
Interior
- Kitchen: Kitchen (appliances not specified)
- Bedrooms: Master bedroom with ensuite (second level); Additional bedroom on second level
- Bathrooms: Two full bathrooms; One half bathroom
- Interior features: Gas fireplace; Fireplace in master bedroom; Foyer; Screened porch; Utility room
- Laundry & utility: Washer hookup; Dryer hookup; Utility room on first level
Neighborhood map
What this means for you Summary
Snapshot
- This is a 4-bed/2.5-bath single-family listed at $310k.
Deal economics
- At list price, monthly cash flow is $-78 ($-932/yr) — negative.
- To cash-flow at today's rent, offer at most $296k (4.4% below list).
- To meet the 1% rule (rent ≥ 1% of price), the offer needs to be $266k (14.0% below list).
- Recommended offer: $266k (14.0% below list) — sets the bar for 1% rule.
- Cap rate 6.0% vs local median 3.5% in Suffolk — top-decile yield for the area; either an underpriced asset or a hidden risk that comps aren't pricing in. Stress-test before assuming the spread holds.
Location & tenants
- Location reads 77/100 on livability (#88 in VA, #2,896 nationally) — a middle-class / working-renter tenant base. Strengths: housing A+, health & safety A+, employment A-; Watch: crime C-, commute F.
- Suffolk City Public School District (suburban): math 41% / reading 69% proficiency, ranked #72 of 131 in VA (top 55%) — acceptable for families but not a draw, mixed tenant base, ~2y average lease.
- Zoned schools: Northern Shores Elementary (math 61% / reading 76%, grade B+, #357 of 1,108 statewide, top 33%, 822 students, 65% FRL); John Yeates Middle (math 60% / reading 83%, grade A, #72 of 342 statewide, top 22%, 506 students, 64% FRL); Nansemond River High (math 44% / reading 87%, grade B, #204 of 319 statewide, top 65%, 1,698 students, 64% FRL) — zoned schools average 64% FRL vs 39% district-wide (25 pts higher); higher-poverty schools than district average — tighter screening recommended.
- Zoned-school proficiency averages 68% at this address vs 55% district-wide (+14 pts) — the actual schools serving this property are materially stronger than the Suffolk City Public School District average implies; a family-tenant draw the district grade alone would hide.
- Market conditions: Rents rising fast (+10.6%/yr); 518 active listings in the ZIP; 5 comparable units currently listed for rent nearby; rentals lingering (median 46d on market — plan ~5-8 weeks vacancy on turnover, expect pricing pressure); 60% of comp listings sitting > 30 days — soft ceiling on asking rent; high-income renter base; 680 units permitted in Suffolk city in 2024 (0 in 5+ unit buildings).
Forward outlook
- Local home prices are declining (-3.0%/yr); year-one equity from $2k of loan paydown is wiped out by about $9k of value loss. Plan a longer hold.
- Suffolk County population projected at +11% by 2050 — modest demand growth; plan on rents tracking national, not racing it.
Negotiation context
- Only 8 days on market — expect competitive offers; lowballing is unlikely to land.
Risks & watch-outs
- Climate carrying-cost: severe wind risk, 80% chance of damaging wind over 30y; extreme-heat days projected 7→16/yr by 2055 (HVAC capex compounding) — expect insurance premiums to compound above CPI over the hold.
Questions for the listing agent
- What do current leases actually rent for vs. the listed asking? Can we see a recent rent roll and the last 12 months of T-12 income?
- What does the HOA fee cover, when was the last increase, and are there any pending special assessments or reserve-fund shortfalls?
- Is there a deadline driving the sale (1031 exchange, divorce, estate, relocation)? That informs how much negotiation room exists.
- Schools are A-rated — typically a magnet for longer-tenancy family renters. What's the average tenant stay here, and is there a school-zone premium baked into asking?
- What's the average days-on-market for RENTAL listings here right now (not sales)? A rising rental-DOM trend means longer vacancies and softer asking-rent achievability than the comps imply.
- What's the recent tenant-quality profile in this submarket — average credit score on applications, eviction rate, late-payment / NSF rate, and stable-employment percentage? A property-management company in the area should have these aggregated.
- How much new for-sale + rental construction is in the pipeline within 1–3 miles? Heavy new supply typically softens prices + rents 12–24 months out; constrained supply supports both.
Investment metrics
- 1% rule
- 0.86% ✗
- Cap rate
- 5.99%
- Cash-on-cash
- -1.07%
- DSCR
- 0.95
- GRM
- 9.7
CMA / ARV
- ARV (on-the-fly)
- $478,316
- Comps found
- 12
Show comp detail 12 sales within ~0.75 mi
| Address | Dist | Beds/Ba | Sqft | Sold | Price | $/sf | Match |
|---|---|---|---|---|---|---|---|
| 6303 S Oaken Gate Dr | 0.17mi | 4/2.5 | 2,470 (+2%) | 2mo | $480,000 | $194 | 87 |
| 6215 Calvert Ct | 0.17mi | 4/2.5 | 2,374 (-2%) | 3mo | $445,000 | $187 | 86 |
| 6418 Wet Marsh Ct | 0.13mi | 4/2.5 | 2,292 (-6%) | 1mo | $470,000 | $205 | 84 |
| 6404 Pelican Cres | 0.22mi | 4/2.5 | 2,171 (-11%) | 1mo | $404,000 | $186 | 71 |
| 6750 Burbage Landing Cir | 0.63mi | 4/2.5 | 2,478 (+2%) | 3mo | $579,000 | $234 | 65 |
| 6322 Townsend Pl | 0.52mi | 4/2.5 | 2,573 (+6%) | 2mo | $470,000 | $183 | 64 |
| 6322 Pelican Cres S | 0.35mi | 4/2.5 | 2,177 (-10%) | 3mo | $475,000 | $218 | 64 |
| 2 Shoal Ct | 0.57mi | 4/2.5 | 2,300 (-5%) | 3mo | $415,000 | $180 | 62 |
| 6302 Amberly Ct | 0.33mi | 3/2.5 (-1) | 2,161 (-11%) | 4mo | $425,000 | $197 | 58 |
| 5109 Hoffler St | 0.70mi | 4/3.0 | 2,552 (+5%) | 3mo | $505,000 | $198 | 54 |
| 5043 Bay Cir | 0.70mi | 4/2.5 | 2,195 (-10%) | 2mo | $480,000 | $219 | 49 |
| 10 Catamaran Ct | 0.66mi | 4/2.0 | 2,100 (-14%) | 4mo | $385,000 | $183 | 41 |
Match score weights: distance 35% · size 25% · config 20% · recency 20%. Top-matched comps best support the ARV.
Projected returns pro-forma
-3.0% appreciation · 8.0% rent growth · sell at horizon
- IRR
- -12.5%
- Equity multiple
- 0.53×
- Total profit
- $-41,014
- Equity at exit
- $46,207
- IRR
- 2.9%
- Equity multiple
- 1.26×
- Total profit
- $22,277
- Equity at exit
- $26,794
Cash invested: $86,772 (down + closing). Projections, not guarantees.
Landlord ↔ Tenant lean methodology
- Overall (STATE)
- 55 Moderately Landlord-Leaning
- State Virginia
- 55 Moderately Landlord-Leaning · D+2
- County
- — inherits STATE
- City
- — inherits STATE
ZIP-level market 23435
- Rents YoY
- 10.6%
- Active inventory
- 518
- Price-to-rent
- 9.7×
Monthly cashflow live
- Estimated rent
- $2,665 high interval (Pro) →
- Mortgage (P&I)
- −$1,625
- Tax from tax record
- −$383 /mo · $4,601/yr
- Insurance
- −$129
- HOA
- −$45
- Vacancy / Maint / Mgmt
- −$560
- Net cashflow
- $-78
Break-even live
Sensitivity live
| Price | -10% $98 | -5% $10 | +0% $-78 | +5% $-165 | +10% $-253 |
|---|---|---|---|---|---|
| Rent | -10% $-288 | -5% $-183 | +0% $-78 | +5% $28 | +10% $133 |
| Rate | -1.0pp $78 | -0.5pp $1 | base $-78 | +0.5pp $-158 | +1.0pp $-240 |
UW: 25.0% down · 7.5% · 30yr · 1.5% tax · 5.0% vac · 8.0% maint · 8.0% mgmt
Financing live
Cash to close
- Down payment
- $77,475
- Closing costs
- $9,297
- Reserves months
- —
- Total cash needed
- —
Loan-product check · same deal, 3 products live
Conventional
25% down · 7.5% · 30yr
- Down + closing
- —
- Monthly P&I
- —
- Monthly cashflow
- —
- DSCR
- —
- Eligible?
- —
Personal DTI + credit; lowest rate.
DSCR
20% down · 8.5% · 30yr
- Down + closing
- —
- Monthly P&I
- —
- Monthly cashflow
- —
- DSCR
- —
- Eligible?
- —
No personal income docs; deal must DSCR.
Hard money
10% down · 12.0% · 12mo
- Down + closing
- —
- Monthly P&I
- —
- Monthly cashflow
- —
- DSCR
- —
- Eligible?
- —
Short-term bridge; refi at stabilization.
Rent comps 5 comps
| Address | Beds | Baths | Sqft | Rent | $/sqft | DOM | Units | Dist |
|---|---|---|---|---|---|---|---|---|
| 171 Graystone Trce Suffolk, VA | 3.0 | 2.5 | 1824 | $2,495 | $1.37 | 0d | 1 | 0.48mi |
| 159 Stoney Ridge Ave Suffolk, VA | 4.0 | 2.5 | 2325 | $2,650 | $1.14 | 9d | 1 | 0.52mi |
| 4029 Ketch Dr Portsmouth, VA | 3.0 | 2.5 | 1582 | $1,950 | $1.23 | 45d | 1 | 0.70mi |
| 8233 Lee Hall Ave Suffolk, VA | 4.0 | 2.5 | 1644 | $2,600 | $1.58 | 45d | 1 | 0.84mi |
| 3808 Sugar Creek Cir Portsmouth, VA | 3.0 | 2.5 | 1584 | $2,345 | $1.48 | 45d | 1 | 0.98mi |
HOA detail
- Monthly dues
- $45 · $540/yr
- Likely covers
- gas
Listing history 6 events
-
2026-06-21days on market $309,900 Active 8 DOM
-
2026-06-18days on market $309,900 Active 5 DOM
-
2026-06-17days on market $309,900 Active 4 DOM
-
2026-06-16days on market $309,900 Active 3 DOM
-
2026-06-15remarks 695-char remark
-
2026-06-15$309,900 Active 2 DOM
ⓘ Source: listings_history table (triggers on properties + properties_extension) + one-shot
backfill from property_details.listing_events for pre-trigger history.
Tax reassessment forecast VA · Resets to sale price
- Current annual tax
- $4,601 · $383/mo
- Projected year-2 tax
- $4,601 · $383/mo
- Expected delta
- $0/yr ($0/mo · 0.0%)
ⓘ Screening estimate from a state-policy table — verify with the county assessor before closing.
Climate risk First Street
- Flood 3/10 Moderate FEMA zone X (unshaded) · 7% chance over 30 yrs
- Wildfire 2/10 Low
- Heat 9/10 Extreme 7 d/yr ≥106°F today · 16 d/yr by 30 yrs out
- Wind 8/10 Severe 80% chance of damaging wind over 30 yrs
- Air quality 2/10 Low 1 unhealthy d/yr today · 3 by 30 yrs out
Nearby sold comps map
Loading sold comps map…
Walkable amenities ~0.75 mi
Loading nearby amenities…
Taxation est. · year 1
- Rental income
- $31,976
- − Mortgage interest
- −$17,359
- − Property taxes
- −$4,601
- − Insurance
- −$1,550
- − Repairs & maintenance
- −$2,558
- − Management
- −$2,558
- − HOA
- −$540
- − Depreciation
- −$9,015
- Taxable loss
- −$6,206
- Est. tax savings @ 24.0%
- +$1,489
- After-tax cash flow
- $558/yr
For passive investors: Depreciation is non-cash, so a rental often shows a tax loss while cash-flowing — sheltering income. Rental losses are passive: they offset passive income freely, and up to $25,000/yr can offset ordinary (W-2) income if you actively participate and your MAGI is under $100k (phasing out to $0 by $150k); unused losses carry forward. On sale, claimed depreciation is recaptured at up to 25%, and gains may owe capital-gains tax (a 1031 exchange can defer both). Figures are a year-1 estimate at your 24.0% rate — not tax advice; consult a CPA.
Schools (NCES district)
- District
- Suffolk City Public School District
- NCES district ID
- 5103710
- Math proficiency
- 41% ▼ -43.00%
- Reading proficiency
- 69% ▼ -8.00%
- Median HH income
- $65,573
- Composite
- 48.31/100
- National rank
- #2151
- State rank
- #72 of 131 in VA
Livability — Suffolk
- Score
- 77/100
- State rank
- #88
- US rank
- #2896
Category grades
Schools grade is shown separately in the Schools card above.
Census & demographics
- Census place
- Suffolk, VA
- County
- Suffolk City · 88,108 people
- City population
- 88,108
- Metro
- Virginia Beach-Norfolk-Newport News, VA-NC
- Population (ZIP)
- 33,721
- Household income
- $111,700
- Rent vs Own
- Severe rent burden
- 1074.0
Population outlook (Suffolk County) Hauer SSP2
- Today (2025)
- 95,269 people
- By 2030
- 98,269 · +3.1%
- By 2040
- 103,177 · +8.3%
- By 2050
- 105,777 · +11.0%
- By 2075
- 110,963 · +16.5%
- By 2100
- 103,711 · +8.9%
Race, ethnicity, and origin ACS 2023
- Neighborhood character
- Diverse neighborhood (Simpson 0.64)
- Race & ethnicity
- White 47% Black 36% Two or more races 9% Hispanic / Latino 6% Asian 4%
- Hispanic origin (detail)
- Mexican 2% Puerto Rican 2%
- Common ancestry
- Romanian 2% Italian 2% Slovak 1%
- Foreign-born
- 6% · Canada, Vietnam, China
- Languages at home
- 91% English-only · Spanish 4% Chinese 1% German/W. Germanic 1%
Political lean MEDSL · Suffolk
- 2024 margin
- D (+15.9) · D 57.4% · R 41.5% · Other 1.2%
- 2008→2024 swing
- +2.7pp toward D · 2008: 13.2pp · 2024: 15.9pp
- All cycles
- 2024: D+15.9 2020: D+17.3 2016: D+13.8 2012: D+15.1 2008: D+13.2
Not yet ingested
- Civics
- —
Market trends
- HPI YoY
- ▼ -155.93%
- Current HPI
- 162.3775
- Rent YoY
- ▲ 10.61%
- Metro
- Virginia Beach-Norfolk-Newport News, VA-NC
- State GDP YoY
- ▲ 2.40%
- F500 in state
- 50
Industry mix (Fortune 500 HQ in VA)
| Industry | F500 HQs | Revenue |
|---|---|---|
| Aerospace / Defense | 4 | $236B |
|
||
| Technology / Defense | 3 | $32B |
|
||
| Financial Services | 2 | $176B |
|
||
| Utilities | 2 | $27B |
|
||
| Insurance | 2 | $25B |
|
||
| Technology | 2 | $15B |
|
||
Price history
+12.3% since first listed2 events — show timeline
- 2026-06-13 Listed $309,900 REINMLS
- 2000-12-18 Sold (Public Records) $275,850 Public Records
Property tax history
+3.8%/yrLatest (2025): $4,601 · +2.8% YoY. Source: county tax records.
Cash-flow waterfall
monthlySold comps — $/sqft
last 12 mo · ≤1 miLoading sold comps…