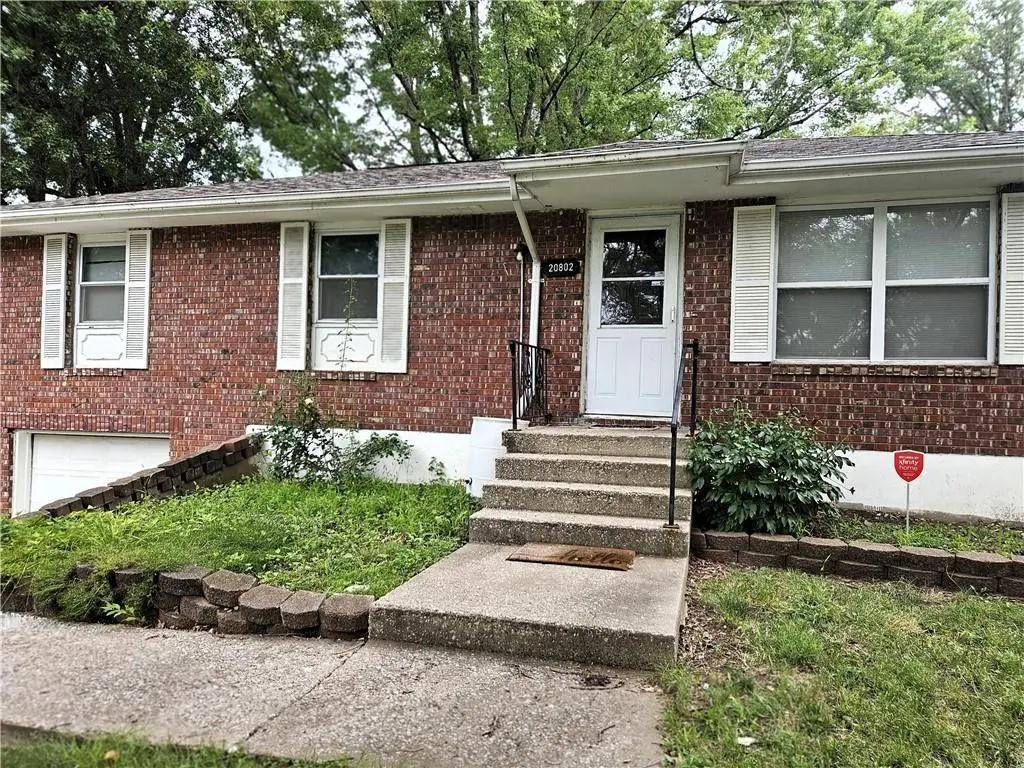
20802 E 13th Ter N · Independence, MO
Flood risk 1/10 · Minimal
- FEMA flood zone
- X (unshaded)
- Chance of flooding over 30 yrs
- 0.0%
- Est. flood insurance / yr
- $473 – $860
Fire risk 2/10 · Minimal
- Est. fire insurance / yr
- $1,054 – $1,958
Heat risk 4/10 · Minor
- Hot days now (above 107°F)
- 7 days/yr
- Hot days in 30 yrs
- 17 days/yr
Wind risk 2/10 · Minimal
- Chance of severe wind over 30 yrs
- —
Air-quality risk 4/10 · Minor
- Unhealthy air days now
- 4 days/yr
- Unhealthy air days in 30 yrs
- 5 days/yr
Risk factors via First Street. Map © Google.
Why this score? — see what drove the C grade
The composite is a weighted blend of 9 inputs, each scored 0–100. Each bar is that input's sub-score; the figure is the points it added to the 100-point composite (weight × sub-score).
- Cash flow +20.6/30.0
- ARV discount +13.0/15.0
- DSCR +6.6/10.0
- 1% rule +4.8/10.0
- Livability +4.1/5.0
- Rent growth +3.1/5.0
- Schools +2.7/10.0
- Condition / age +2.5/5.0
- Appreciation +0.0/10.0
$199,000
🖨 Deal sheet 📄 Offer letter ✓ Due diligence
Listing remarks MLS
Great starter home in a quiet neighborhood! This home has everything you need, spacious rooms, partially finished basement, nice fenced yard. There is a shed in the yard for your tools and mower. Open concept with the living room flowing into the dining room. Freshly painted and wood floors were refinished not to long ago. Enjoy the outside with many places to plant flower boxes and gardens. Home faces south, so perfect for growing.
Key facts
- Fenced yard
- Open concept
- Freshly painted
Tags
Neighborhood map
What this means for you Summary
Snapshot
- This is a 3-bed/1.5-bath single-family listed at $199k.
Deal economics
- At list price, monthly cash flow is $267 ($3k/yr) — positive.
- The deal already cash-flows at list — no discount required.
- To meet the 1% rule (rent ≥ 1% of price), the offer needs to be $195k (2.2% below list).
- Recommended offer: $175k (12.0% below list) — sets the bar for market timing.
- Cap rate 7.9% vs local median 5.0% in Independence — top-decile yield for the area; either an underpriced asset or a hidden risk that comps aren't pricing in. Stress-test before assuming the spread holds.
Location & tenants
- Location reads 82/100 on livability (#10 in MO, #1,296 nationally) — a professional / high-income tenant draw. Strengths: amenities A+, commute A+, cost of living A+; Watch: schools C-, employment D+, crime F.
- Independence 30 (suburban): math 26% / reading 38% proficiency, ranked #252 of 324 in MO (top 78%) — families likely to look elsewhere, expect single-tenant / working-renter base with shorter leases.
- Market conditions: Rents rising (+2.3%/yr); 70 active listings in the ZIP; 6 comparable units currently listed for rent nearby; rentals leasing fast (median 2d on market — plan ~1-2 weeks tenant-placement turnaround); 4,002 units permitted in Jackson County in 2024 (2,271 in 5+ unit buildings).
- This rent runs 33% of the median local income ($71k/yr) — at the standard rent-burdened threshold; future hikes will face affordability resistance.
Forward outlook
- Local home prices are declining (-3.0%/yr); year-one equity from $1k of loan paydown is wiped out by about $6k of value loss. Plan a longer hold.
- Jackson County population projected at +4% by 2050 — modest demand growth; plan on rents tracking national, not racing it.
Negotiation context
- It's been on market 194 days — a 12% lower offer ($175k) is reasonable based on typical stale-listing flexibility.
Questions for the listing agent
- It's been on market 194 days. Have you received any prior offers? Is the seller open to a 12% concession, seller financing, or rate buy-down credit?
- Built in 1970 — when were the roof, HVAC, electrical panel, plumbing, and water heater last replaced?
- Why hasn't it sold? Are there any deal-killer items the seller is aware of (foundation, flood, title, zoning, code violations)?
- Is there a deadline driving the sale (1031 exchange, divorce, estate, relocation)? That informs how much negotiation room exists.
- Crime grade is F in this area — have there been break-ins, vandalism, or insurance claims at this property in the last 3 years? What carrier currently insures it and at what premium?
- What's the average days-on-market for RENTAL listings here right now (not sales)? A rising rental-DOM trend means longer vacancies and softer asking-rent achievability than the comps imply.
- What's the recent tenant-quality profile in this submarket — average credit score on applications, eviction rate, late-payment / NSF rate, and stable-employment percentage? A property-management company in the area should have these aggregated.
- How much new for-sale + rental construction is in the pipeline within 1–3 miles? Heavy new supply typically softens prices + rents 12–24 months out; constrained supply supports both.
Investment metrics
- 1% rule
- 0.98% ✗
- Cap rate
- 7.90%
- Cash-on-cash
- 5.74%
- DSCR
- 1.26
- GRM
- 8.5
CMA / ARV
- ARV (median comp)
- $226,935
- List price
- $199,000
- Delta
- -12.31%
- Verdict
- UNDERPRICED
- Comps
- 20 within 1.0 mi
Show comp detail 9 sales within ~0.75 mi
| Address | Dist | Beds/Ba | Sqft | Sold | Price | $/sf | Match |
|---|---|---|---|---|---|---|---|
| 20910 E 13th Ter | 0.13mi | 3/1.5 | 1,554 (+1%) | 10mo | $200,000 | $129 | 84 |
| 1309 S Mchenry St | 0.09mi | 3/1.5 | 1,425 (-7%) | 3mo | $235,000 | $165 | 81 |
| 20112 E 12th Ter S | 0.41mi | 3/1.0 | 1,508 (-2%) | 20mo | $209,900 | $139 | 59 |
| 906 S Butler Ln | 0.46mi | 3/2.0 | 1,620 (+6%) | 14mo | $254,000 | $157 | 56 |
| 20007 E 13th South St | 0.50mi | 3/1.0 | 1,360 (-12%) | 8mo | $199,000 | $146 | 49 |
| 21008 E 8 St S | 0.48mi | 3/2.0 | 1,350 (-12%) | 13mo | $350,000 | $259 | 44 |
| 21000 E 8th St S | 0.49mi | 3/2.0 | 1,350 (-12%) | 13mo | $357,500 | $265 | 44 |
| 812 S Jones Rd | 0.69mi | 3/1.5 | 1,688 (+10%) | 23mo | $195,000 | $116 | 32 |
| 807 S Jones Rd | 0.67mi | 4/3.0 (+1) | 1,648 (+7%) | 23mo | $475,000 | $288 | 26 |
Match score weights: distance 35% · size 25% · config 20% · recency 20%. Top-matched comps best support the ARV.
Projected returns pro-forma
-3.0% appreciation · 2.32% rent growth · sell at horizon
- IRR
- -8.2%
- Equity multiple
- 0.70×
- Total profit
- $-16,624
- Equity at exit
- $29,672
- IRR
- 0.5%
- Equity multiple
- 1.03×
- Total profit
- $1,892
- Equity at exit
- $17,206
Cash invested: $55,720 (down + closing). Projections, not guarantees.
Landlord ↔ Tenant lean methodology
- Overall (STATE)
- 81 Strongly Landlord-Friendly
- State Missouri
- 81 Strongly Landlord-Friendly · R+10
- County
- — inherits STATE
- City
- — inherits STATE
ZIP-level market 64057
- Rents YoY
- 2.3%
- Active inventory
- 70
- Price-to-rent
- 8.5×
Monthly cashflow live
- Estimated rent
- $1,947 high interval (Pro) →
- Mortgage (P&I)
- −$1,044
- Tax from tax record
- −$145 /mo · $1,742/yr
- Insurance
- −$83
- HOA
- −$0
- Vacancy / Maint / Mgmt
- −$409
- Net cashflow
- $267
Break-even live
UW: 25.0% down · 7.5% · 30yr · 1.5% tax · 5.0% vac · 8.0% maint · 8.0% mgmt
Financing live
Cash to close
- Down payment
- $49,750
- Closing costs
- $5,970
- Reserves months
- —
- Total cash needed
- —
Loan-product check · same deal, 3 products live
Conventional
25% down · 7.5% · 30yr
- Down + closing
- —
- Monthly P&I
- —
- Monthly cashflow
- —
- DSCR
- —
- Eligible?
- —
Personal DTI + credit; lowest rate.
DSCR
20% down · 8.5% · 30yr
- Down + closing
- —
- Monthly P&I
- —
- Monthly cashflow
- —
- DSCR
- —
- Eligible?
- —
No personal income docs; deal must DSCR.
Hard money
10% down · 12.0% · 12mo
- Down + closing
- —
- Monthly P&I
- —
- Monthly cashflow
- —
- DSCR
- —
- Eligible?
- —
Short-term bridge; refi at stabilization.
Rent comps 6 comps
| Address | Beds | Baths | Sqft | Rent | $/sqft | DOM | Units | Dist |
|---|---|---|---|---|---|---|---|---|
| 1318 S Kaydeen Ct Independence, MO | 2.0–3.0 | 2.0 | 1200 | $1,745 | $1.45 | 2d | 1 | 0.16mi |
| 20105 E 12th Ter S Independence, MO | 4.0 | 2.0 | 1624 | $2,010 | $1.24 | 3d | 1 | 0.43mi |
| 1208 S Mayview Ave Independence, MO | 4.0 | 2.0 | 1595 | $2,300 | $1.44 | 2d | 1 | 0.63mi |
| 20201 E 23rd Ter Ct S Independence, MO | 4.0 | 3.0 | 1427 | $2,595 | $1.82 | 2d | 1 | 1.00mi |
| 20209 E 23rd Ter Ct S Independence, MO | 4.0 | 2.5 | 2003 | $2,545 | $1.27 | 44d | 1 | 1.00mi |
| 301 S Sue Ellen Ave Independence, MO | 3.0 | 2.0 | 1216 | $1,550 | $1.27 | 2d | 1 | 1.03mi |
Listing history 16 events
-
2026-06-18days on market $199,000 Active 194 DOM
-
2026-06-17days on market $199,000 Active 193 DOM
-
2026-06-16days on market $199,000 Active 192 DOM
-
2026-06-15days on market $199,000 Active 191 DOM
-
2026-06-13days on market $199,000 Active 189 DOM
-
2026-06-09days on market $199,000 Active 185 DOM
-
2026-06-08days on market $199,000 Active 184 DOM
-
2026-06-07pricedays on market $199,000 Active 183 DOM
-
2026-06-05days on market $210,000 Active 180 DOM
-
2026-06-03days on market $210,000 Active 179 DOM
-
2026-06-02days on market $210,000 Active 178 DOM
-
2026-06-01days on market $210,000 Active 177 DOM
-
2026-05-31days on market $210,000 Active 176 DOM
-
2026-02-20price $210,000 437-char remark
Show marketing remark (437 chars)
Great starter home in a quiet neighborhood! This home has everything you need, spacious rooms, partially finished basement, nice fenced yard. There is a shed in the yard for your tools and mower. Open concept with the living room flowing into the dining room. Freshly painted and wood floors were refinished not to long ago. Enjoy the outside with many places to plant flower boxes and gardens. Home faces south, so perfect for growing.
-
2025-12-06$215,000 Active 437-char remark
Show marketing remark (437 chars)
Great starter home in a quiet neighborhood! This home has everything you need, spacious rooms, partially finished basement, nice fenced yard. There is a shed in the yard for your tools and mower. Open concept with the living room flowing into the dining room. Freshly painted and wood floors were refinished not to long ago. Enjoy the outside with many places to plant flower boxes and gardens. Home faces south, so perfect for growing.
-
1982-05-01soldstatus
ⓘ Source: listings_history table (triggers on properties + properties_extension) + one-shot
backfill from property_details.listing_events for pre-trigger history.
Tax reassessment forecast MO · Resets to sale price
- Current annual tax
- $1,742 · $145/mo
- Projected year-2 tax
- $1,930 · $161/mo
- Expected delta
- +$188/yr (+$16/mo · 10.8%)
ⓘ Screening estimate from a state-policy table — verify with the county assessor before closing.
Climate risk First Street
- Flood 1/10 Low FEMA zone X (unshaded) · 0% chance over 30 yrs
- Wildfire 2/10 Low
- Heat 4/10 Moderate 7 d/yr ≥107°F today · 17 d/yr by 30 yrs out
- Wind 2/10 Low
- Air quality 4/10 Moderate 4 unhealthy d/yr today · 5 by 30 yrs out
Nearby sold comps map
Loading sold comps map…
Walkable amenities ~0.75 mi
Loading nearby amenities…
Taxation est. · year 1
- Rental income
- $23,366
- − Mortgage interest
- −$11,147
- − Property taxes
- −$1,742
- − Insurance
- −$995
- − Repairs & maintenance
- −$1,869
- − Management
- −$1,869
- − Depreciation
- −$5,789
- Taxable loss
- −$46
- Est. tax savings @ 24.0%
- +$11
- After-tax cash flow
- $3,210/yr
For passive investors: Depreciation is non-cash, so a rental often shows a tax loss while cash-flowing — sheltering income. Rental losses are passive: they offset passive income freely, and up to $25,000/yr can offset ordinary (W-2) income if you actively participate and your MAGI is under $100k (phasing out to $0 by $150k); unused losses carry forward. On sale, claimed depreciation is recaptured at up to 25%, and gains may owe capital-gains tax (a 1031 exchange can defer both). Figures are a year-1 estimate at your 24.0% rate — not tax advice; consult a CPA.
Schools (NCES district)
- District
- Independence 30
- NCES district ID
- 2915480
- Math proficiency
- 26% ▼ -8.00%
- Reading proficiency
- 38% ▼ -5.00%
- Median HH income
- $41,843
- Composite
- 27.04/100
- National rank
- #7054
- State rank
- #252 of 324 in MO
Livability — Independence
- Score
- 82/100
- State rank
- #10
- US rank
- #1296
Category grades
Schools grade is shown separately in the Schools card above.
Census & demographics
- Census place
- Independence, MO
- County
- Jackson County · 687,798 people
- City population
- 117,675
- Metro
- Kansas City, MO-KS
- Population (ZIP)
- 14,328
- Household income
- $71,402
- Rent vs Own
- Severe rent burden
- 637.0
Population outlook (Jackson County) Hauer SSP2
- Today (2025)
- 719,589 people
- By 2030
- 731,456 · +1.6%
- By 2040
- 746,689 · +3.8%
- By 2050
- 749,289 · +4.1%
- By 2075
- 736,227 · +2.3%
- By 2100
- 668,210 · -7.1%
Race, ethnicity, and origin ACS 2023
- Neighborhood character
- Predominantly White (74%)
- Race & ethnicity
- White 74% Black 14% Two or more races 4% Hispanic / Latino 4% Asian 2% Pacific Islander 2%
- Common ancestry
- Italian 8% Slovak 3% Lithuanian 2%
- Foreign-born
- 2%
- Languages at home
- 97% English-only · Spanish 1% Vietnamese 1% Other Indo-European 1%
Political lean MEDSL · Jackson
- 2024 margin
- D (+19.3) · D 58.9% · R 39.5% · Other 1.6%
- 2008→2024 swing
- -6.1pp toward R · 2008: 25.4pp · 2024: 19.3pp
- All cycles
- 2024: D+19.3 2020: D+22.0 2016: D+16.6 2012: D+19.0 2008: D+25.4
Not yet ingested
- Civics
- —
Market trends
- HPI YoY
- ▼ -178.01%
- Current HPI
- 230.0639
- Rent YoY
- ▲ 2.32%
- Metro
- Kansas City, MO-KS
- State GDP YoY
- ▲ 1.84%
- F500 in state
- 20
Industry mix (Fortune 500 HQ in MO)
| Industry | F500 HQs | Revenue |
|---|---|---|
| Healthcare | 1 | $163B |
|
||
| Insurance | 1 | $21B |
|
||
| Industrial Technology | 1 | $17B |
|
||
| Retail | 1 | $16B |
|
||
| Industrial Distribution | 1 | $10B |
|
||
| Utilities | 1 | $9B |
|
||
Price history
-2.3% since first listed3 events — show timeline
- 2026-02-20 Price Changed $210,000 Heartland MLS as Distributed by MLS Grid
- 2025-12-06 Listed $215,000 Heartland MLS as Distributed by MLS Grid
- 1982-05-01 Sold (Public Records) — Public Records
Property tax history
+3.4%/yrLatest (2025): $1,742 · -2.0% YoY. Source: county tax records.
Cash-flow waterfall
monthlySold comps — $/sqft
last 12 mo · ≤1 miLoading sold comps…