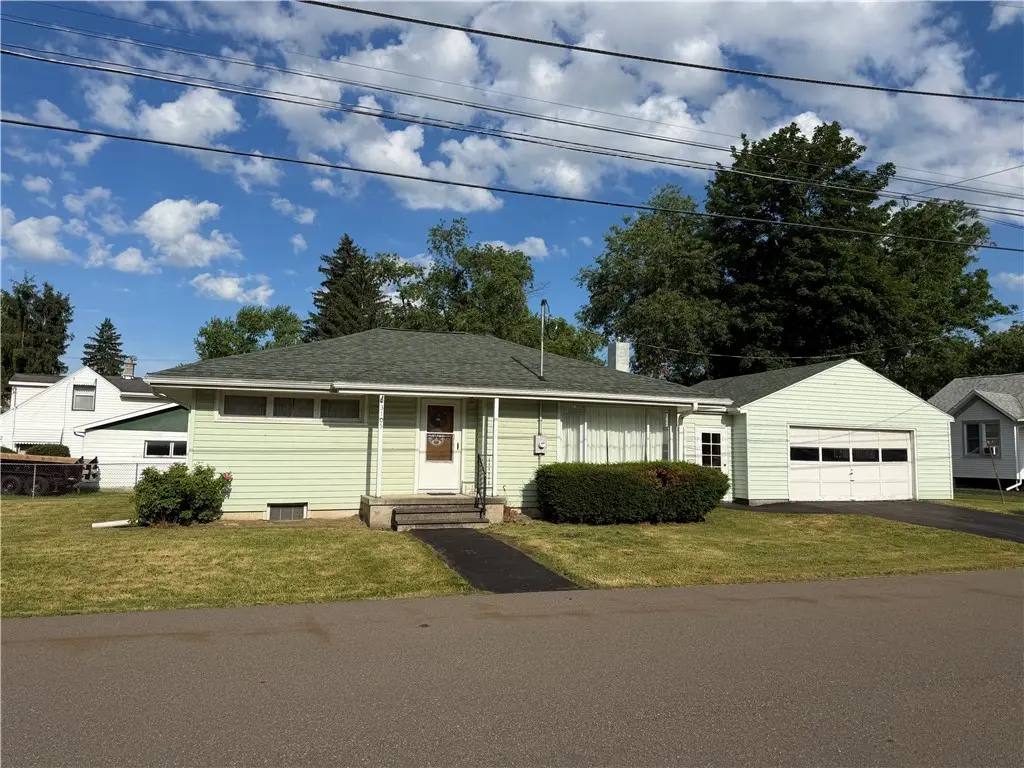
3105 Camden Ave · Horseheads, NY
Flood risk 1/10 · Minimal
- FEMA flood zone
- X
- Chance of flooding over 30 yrs
- 0.0%
- Est. flood insurance / yr
- $473 – $860
Fire risk 2/10 · Minimal
- Est. fire insurance / yr
- $691 – $1,283
Heat risk 3/10 · Minor
- Hot days now (above 96°F)
- 7 days/yr
- Hot days in 30 yrs
- 15 days/yr
Wind risk 1/10 · Minimal
- Chance of severe wind over 30 yrs
- 1.0%
Air-quality risk 1/10 · Minimal
- Unhealthy air days now
- 0 days/yr
- Unhealthy air days in 30 yrs
- 0 days/yr
Risk factors via First Street. Map © Google.
Why this score? — see what drove the D- grade
The composite is a weighted blend of 9 inputs, each scored 0–100. Each bar is that input's sub-score; the figure is the points it added to the 100-point composite (weight × sub-score).
- Cash flow +12.3/30.0
- ARV discount +5.0/15.0
- 1% rule +3.9/10.0
- DSCR +3.6/10.0
- Schools +3.6/10.0
- Livability +3.5/5.0
- Rent growth +2.5/5.0
- Condition / age +2.5/5.0
- Appreciation +0.0/10.0
$129,900
🖨 Deal sheet 📄 Offer letter ✓ Due diligence
Listing remarks
Welcome home to this well-maintained two-bedroom, one-bath ranch offering easy one-floor living and a convenient location with quick access to Interstate 86. Enjoy a spacious attached breezeway connecting the home to the oversized two-car garage—perfect as a Florida room, sitting area, or additional entertaining space. Inside, you’ll find a bright eat-in kitchen and a comfortable living room highlighted by charming corner windows that fill the space with natural light. Both bedrooms feature double closets, providing plenty of storage. The updated bathroom boasts a brand-new handicap-accessible walk-in shower complete with a transferable warranty for added peace of mind. Laundry
Key facts
- Newer roof
- First floor laundry
- One floor living
Tags
Property features AI
Exterior
- Parking: Attached garage with automatic garage door opener; Two garage spaces
- Utilities: Public water connected; Sewer connected; Cable available; High-speed internet available
- Home design: Single-story home; Resale property; Shingle roof; Vinyl siding
- Construction: Built previously (existing); Block foundation
- Exterior features: Blacktop driveway; Rectangular lot with approximate dimensions 111 x 49
Interior
- Kitchen: Electric oven and electric range; Refrigerator
- Bedrooms: Two main-level bedrooms
- Flooring: Carpet; Varied flooring
- Bathrooms: One full bathroom on the main level
- Heating & cooling: Gas heating; Central air conditioning
- Interior features: Eat-in kitchen; Sunroom / Florida room; Full basement
- Laundry & utility: Washer and dryer; Laundry located on main level and in basement; Gas water heater
Neighborhood map
What this means for you Summary
Snapshot
- This is a 2-bed/1.0-bath single-family listed at $130k.
Deal economics
- At list price, monthly cash flow is $-25 ($-295/yr) — negative.
- To cash-flow at today's rent, offer at most $126k (3.3% below list).
- To meet the 1% rule (rent ≥ 1% of price), the offer needs to be $116k (10.8% below list).
- Recommended offer: $116k (10.8% below list) — sets the bar for 1% rule.
Location & tenants
- Location reads 69/100 on livability (#494 in NY) — a middle-class / working-renter tenant base. Strengths: housing A+, cost of living A, schools B; Watch: crime D+, health & safety D, amenities F.
- Elmira Heights Central School District (suburban): math 39% / reading 46% proficiency, ranked #496 of 590 in NY (top 84%) — families likely to look elsewhere, expect single-tenant / working-renter base with shorter leases.
- Market conditions: 92 active listings in the ZIP; 4 comparable units currently listed for rent nearby; rentals lingering (median 44d on market — plan ~5-8 weeks vacancy on turnover, expect pricing pressure); 100% of comp listings sitting > 30 days — soft ceiling on asking rent; 91 units permitted in Chemung County in 2024 (63 in 5+ unit buildings).
Forward outlook
- Local home prices are declining (-3.0%/yr); year-one equity from $898 of loan paydown is wiped out by about $4k of value loss. Plan a longer hold.
- Chemung County population projected at -17% by 2050 — secular population decline; favor cash flow + early exit over multi-decade hold.
Negotiation context
- Only 2 days on market — expect competitive offers; lowballing is unlikely to land.
Risks & watch-outs
- Watch-outs: built in 1951 — expect roof / HVAC / electrical / plumbing capex.
Questions for the listing agent
- What do current leases actually rent for vs. the listed asking? Can we see a recent rent roll and the last 12 months of T-12 income?
- Built in 1951 — when were the roof, HVAC, electrical panel, plumbing, and water heater last replaced?
- Is there a deadline driving the sale (1031 exchange, divorce, estate, relocation)? That informs how much negotiation room exists.
- Schools are B-rated — typically a magnet for longer-tenancy family renters. What's the average tenant stay here, and is there a school-zone premium baked into asking?
- Crime grade is D in this area — have there been break-ins, vandalism, or insurance claims at this property in the last 3 years? What carrier currently insures it and at what premium?
- The area grade is low — what's the realistic commute time and amenity access for the typical tenant pool here? Any planned neighborhood developments (good or bad) we should know about?
- What's the average days-on-market for RENTAL listings here right now (not sales)? A rising rental-DOM trend means longer vacancies and softer asking-rent achievability than the comps imply.
- What's the recent tenant-quality profile in this submarket — average credit score on applications, eviction rate, late-payment / NSF rate, and stable-employment percentage? A property-management company in the area should have these aggregated.
- How much new for-sale + rental construction is in the pipeline within 1–3 miles? Heavy new supply typically softens prices + rents 12–24 months out; constrained supply supports both.
Investment metrics
- 1% rule
- 0.89% ✗
- Cap rate
- 6.07%
- Cash-on-cash
- -0.81%
- DSCR
- 0.96
- GRM
- 9.3
CMA / ARV
- ARV (on-the-fly)
- $123,102
- Comps found
- 10
Show comp detail 10 sales within ~0.75 mi
| Address | Dist | Beds/Ba | Sqft | Sold | Price | $/sf | Match |
|---|---|---|---|---|---|---|---|
| 210 Lenox Ave | 0.40mi | 3/2.0 (+1) | 978 (+0%) | 6mo | $138,000 | $141 | 67 |
| 238 Lenox Ave | 0.51mi | 2/1.0 | 907 (-7%) | 3mo | $140,000 | $154 | 62 |
| 4027 Rockwell Ave | 0.30mi | 3/1.0 (+1) | 912 (-7%) | 11mo | $131,900 | $145 | 61 |
| 323 O'hanlon Ave | 0.70mi | 2/1.0 | 968 (-1%) | 11mo | $55,000 | $57 | 56 |
| 2080 Grand Central Ave | 0.66mi | 2/1.0 | 957 (-2%) | 18mo | $82,000 | $86 | 51 |
| 427 Upper Oakwood Ave | 0.37mi | 2/1.0 | 1,084 (+11%) | 19mo | $132,000 | $122 | 48 |
| 233 Lenox Ave | 0.51mi | 2/1.0 | 1,062 (+9%) | 16mo | $150,000 | $141 | 48 |
| 313 Lounsbury Ave | 0.62mi | 2/1.0 | 939 (-4%) | 20mo | $75,000 | $80 | 47 |
| 321 Mcconnell Ave | 0.57mi | 3/1.0 (+1) | 1,100 (+13%) | 2mo | $139,000 | $126 | 46 |
| 8 Valley Ave | 0.53mi | 2/1.0 | 1,100 (+13%) | 18mo | $92,500 | $84 | 39 |
Match score weights: distance 35% · size 25% · config 20% · recency 20%. Top-matched comps best support the ARV.
Projected returns pro-forma
-3.0% appreciation · 3.0% rent growth · sell at horizon
- IRR
- -17.6%
- Equity multiple
- 0.38×
- Total profit
- $-22,569
- Equity at exit
- $19,369
- IRR
- -9.6%
- Equity multiple
- 0.41×
- Total profit
- $-21,490
- Equity at exit
- $11,231
Cash invested: $36,372 (down + closing). Projections, not guarantees.
Landlord ↔ Tenant lean methodology
- Overall (STATE)
- 15 Strongly Tenant-Friendly
- State New York
- 15 Strongly Tenant-Friendly · D+10
- County
- — inherits STATE
- City
- — inherits STATE
ZIP-level market 14845
- Home prices YoY
- -24.9%
- Active inventory
- 92
- Price-to-rent
- 9.3×
Monthly cashflow live
- Estimated rent
- $1,159 medium interval (Pro) →
- Mortgage (P&I)
- −$681
- Tax from tax record
- −$204 /mo · $2,453/yr
- Insurance
- −$54
- HOA
- −$0
- Vacancy / Maint / Mgmt
- −$243
- Net cashflow
- $-25
Break-even live
UW: 25.0% down · 7.5% · 30yr · 1.5% tax · 5.0% vac · 8.0% maint · 8.0% mgmt
Financing live
Cash to close
- Down payment
- $32,475
- Closing costs
- $3,897
- Reserves months
- —
- Total cash needed
- —
Loan-product check · same deal, 3 products live
Conventional
25% down · 7.5% · 30yr
- Down + closing
- —
- Monthly P&I
- —
- Monthly cashflow
- —
- DSCR
- —
- Eligible?
- —
Personal DTI + credit; lowest rate.
DSCR
20% down · 8.5% · 30yr
- Down + closing
- —
- Monthly P&I
- —
- Monthly cashflow
- —
- DSCR
- —
- Eligible?
- —
No personal income docs; deal must DSCR.
Hard money
10% down · 12.0% · 12mo
- Down + closing
- —
- Monthly P&I
- —
- Monthly cashflow
- —
- DSCR
- —
- Eligible?
- —
Short-term bridge; refi at stabilization.
Rent comps 4 comps
| Address | Beds | Baths | Sqft | Rent | $/sqft | DOM | Units | Dist |
|---|---|---|---|---|---|---|---|---|
| 258 E 14th St Elmira, NY | 2.0 | 1.0 | 1100 | $1,200 | $1.09 | 43d | 1 | 0.89mi |
| 2146 College Ave Unit 2C Loft Elmira, NY | 1.0 | 1.0 | 750 | $1,145 | $1.53 | 43d | 1 | 1.07mi |
| 200-202 Robinwood Ave Elmira Heights, NY | 1.0 | 1.0 | 700 | $995 | $1.42 | 44d | 1 | 1.35mi |
| 263 W 13th St Unit Lower Elmira Heights, NY | 3.0 | 1.0 | 900 | $1,241 | $1.38 | 43d | 1 | 1.37mi |
Listing history 3 events
-
2026-06-18days on market $129,900 Active 2 DOM
-
2026-06-17remarks 687-char remark
-
2026-06-17$129,900 Active 1 DOM
ⓘ Source: listings_history table (triggers on properties + properties_extension) + one-shot
backfill from property_details.listing_events for pre-trigger history.
Tax reassessment forecast NY · Partial reset (capped growth)
- Current annual tax
- $2,453 · $204/mo
- Projected year-2 tax
- $2,453 · $204/mo
- Expected delta
- $0/yr ($0/mo · 0.0%)
ⓘ Screening estimate from a state-policy table — verify with the county assessor before closing.
Climate risk First Street
- Flood 1/10 Low FEMA zone X · 0% chance over 30 yrs
- Wildfire 2/10 Low
- Heat 3/10 Moderate 7 d/yr ≥96°F today · 15 d/yr by 30 yrs out
- Wind 1/10 Low 100% chance of damaging wind over 30 yrs
- Air quality 1/10 Low 0 unhealthy d/yr today · 0 by 30 yrs out
Nearby sold comps map
Loading sold comps map…
Walkable amenities ~0.75 mi
Loading nearby amenities…
Taxation est. · year 1
- Rental income
- $13,902
- − Mortgage interest
- −$7,276
- − Property taxes
- −$2,453
- − Insurance
- −$650
- − Repairs & maintenance
- −$1,112
- − Management
- −$1,112
- − Depreciation
- −$3,779
- Taxable loss
- −$2,480
- Est. tax savings @ 24.0%
- +$595
- After-tax cash flow
- $301/yr
For passive investors: Depreciation is non-cash, so a rental often shows a tax loss while cash-flowing — sheltering income. Rental losses are passive: they offset passive income freely, and up to $25,000/yr can offset ordinary (W-2) income if you actively participate and your MAGI is under $100k (phasing out to $0 by $150k); unused losses carry forward. On sale, claimed depreciation is recaptured at up to 25%, and gains may owe capital-gains tax (a 1031 exchange can defer both). Figures are a year-1 estimate at your 24.0% rate — not tax advice; consult a CPA.
Schools (NCES district)
- District
- Elmira Heights Central School District
- NCES district ID
- 3610590
- Math proficiency
- 39% ▼ -10.00%
- Reading proficiency
- 46% ▲ 7.00%
- Median HH income
- $42,753
- Composite
- 35.85/100
- National rank
- #4821
- State rank
- #496 of 590 in NY
Livability — Horseheads
- Score
- 69/100
- State rank
- #494
- US rank
- #8689
Category grades
Schools grade is shown separately in the Schools card above.
Census & demographics
- Population (ZIP)
- 20,552
Population outlook (Chemung County) Hauer SSP2
- Today (2025)
- 82,931 people
- By 2030
- 80,356 · -3.1%
- By 2040
- 74,745 · -9.9%
- By 2050
- 69,012 · -16.8%
- By 2075
- 55,689 · -32.8%
- By 2100
- 41,428 · -50.0%
Race, ethnicity, and origin ACS 2023
- Neighborhood character
- Predominantly White (90%)
- Race & ethnicity
- White 90% Two or more races 5% Asian 2% Hispanic / Latino 2% Black 2%
- Common ancestry
- Romanian 6% Slovak 2% Iranian 2%
- Foreign-born
- 6% · Canada, China, South Korea
- Languages at home
- 94% English-only · Spanish 2% Other Asian/Pacific 1% Other Indo-European 1%
Political lean MEDSL · Chemung
- 2024 margin
- R (+16.8) · D 41.6% · R 58.4%
- 2008→2024 swing
- -15.6pp toward R · 2008: -1.2pp · 2024: -16.8pp
- All cycles
- 2024: R+16.8 2020: R+13.4 2016: R+20.0 2012: R+2.9 2008: R+1.2
Not yet ingested
- Civics
- —
Market trends
- HPI YoY
- ▼ -82.23%
- Current HPI
- 247.777
- Rent YoY
- —
- Metro
- —
- State GDP YoY
- ▲ 2.60%
- F500 in state
- 92
Industry mix (Fortune 500 HQ in NY)
| Industry | F500 HQs | Revenue |
|---|---|---|
| Financial Services | 10 | $950B |
|
||
| Consumer Goods | 9 | $162B |
|
||
| Insurance | 4 | $225B |
|
||
| Telecommunications | 2 | $144B |
|
||
| Pharmaceuticals | 2 | $112B |
|
||
| Media / Entertainment | 2 | $69B |
|
||
Price history
1 event — show timeline
- 2026-06-15 Listed $129,900 UNYREIS
Property tax history
+15.8%/yrLatest (2025): $2,453 · -2.5% YoY. Source: county tax records.
Cash-flow waterfall
monthlySold comps — $/sqft
last 12 mo · ≤1 miLoading sold comps…