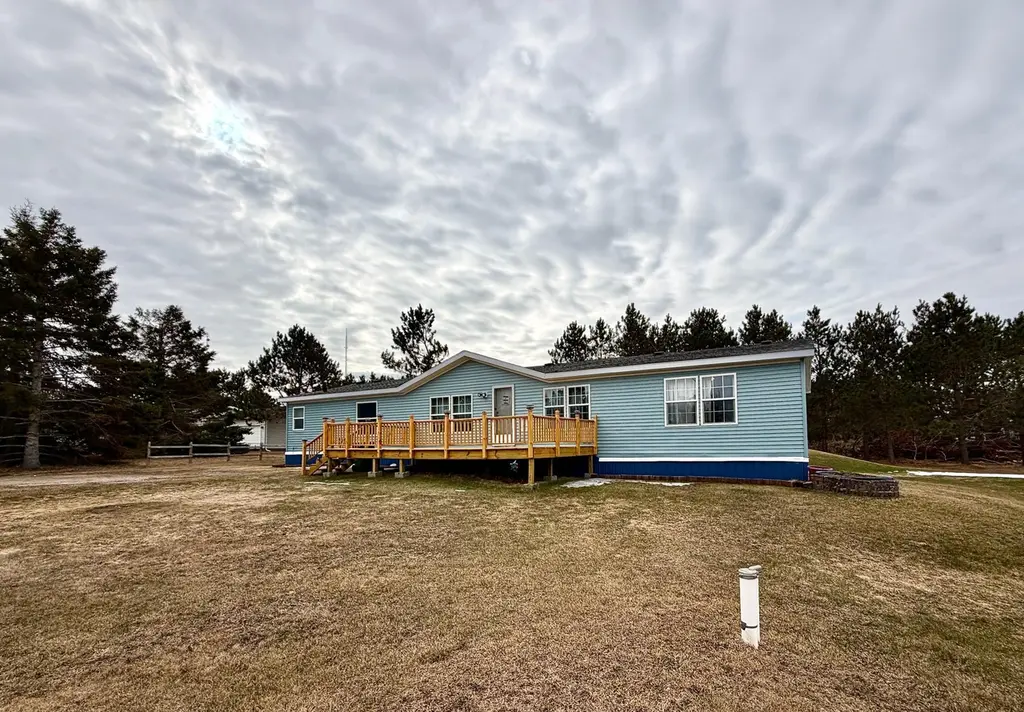
3404 Doral Dr NE · Bemidji, MN
Flood risk 1/10 · Minimal
- FEMA flood zone
- —
- Chance of flooding over 30 yrs
- 0.0%
- Est. flood insurance / yr
- —
Fire risk 7/10 · Major
- Est. fire insurance / yr
- $888 – $1,650
Heat risk 1/10 · Minimal
- Hot days now (above 93°F)
- 7 days/yr
- Hot days in 30 yrs
- 12 days/yr
Wind risk 1/10 · Minimal
- Chance of severe wind over 30 yrs
- —
Air-quality risk 3/10 · Minor
- Unhealthy air days now
- 3 days/yr
- Unhealthy air days in 30 yrs
- 4 days/yr
Risk factors via First Street. Map © Google.
Why this score? — see what drove the C- grade
The composite is a weighted blend of 9 inputs, each scored 0–100. Each bar is that input's sub-score; the figure is the points it added to the 100-point composite (weight × sub-score).
- Cash flow +21.0/30.0
- ARV discount +7.5/15.0
- DSCR +6.7/10.0
- 1% rule +4.5/10.0
- Schools +3.9/10.0
- Livability +3.7/5.0
- Rent growth +3.5/5.0
- Condition / age +2.5/5.0
- Appreciation +0.0/10.0
$215,000
🖨 Deal sheet 📄 Offer letter ✓ Due diligence
Listing remarks
Attractive and larger 3BR + office, 2BA manufactured home in convenient near town location. Vaulted ceiling and abundant natural light. Central Air, new siding and two new expansive decks. Ensuite features double sinks, his and her closets and has tub and walk in shower. Home has insulated skirting, frost footings/tie-downs and served by natural gas. This home is clean ready to move in.
Key facts
- 0.97 acre lot
- Built 1998
- Listed 34 days
Property features AI
Exterior
- Parking: Gravel parking
- Utilities: Private drilled well with 4-inch submersible; Private sewer with mound septic; 100 amp electric service; Natural gas fuel
- Home design: Residential property; Manufactured home; One story; Main entry level; Accessibility features (36"+ doors, 42"+ hallways)
- Construction: Shallow foundation / other foundation type; Roof age 8 years or less
- Exterior features: Vinyl exterior; Two decks (24' x 11'10" and 12'7" x 7'6"); No fencing; Road frontage: township with unpaved streets; Lot dimensions approximately 145' x 295' on about 0.97 acres
Interior
- Kitchen: Kitchen with center island and window; Eat-in kitchen / breakfast area; Informal dining / kitchen-dining room layout
- Bedrooms: 3 bedrooms total; Primary bedroom on main floor; Bedroom 2 on main floor; Bedroom 3 on main floor
- Bathrooms: 2 full bathrooms; Primary bathroom with double sink, ensuite, separate tub and shower, and walk-in shower stall; Main floor full bath; Main floor 3/4 bath; Private primary bathroom; His and her closets
- Heating & cooling: Forced air heating; Central air conditioning
- Interior features: Vaulted ceilings; French doors; Deck; Kitchen center island; Kitchen window; Main floor primary bedroom; Primary bedroom with walk-in closet; Walk-in closet; Washer/dryer hookup; Doors 36+ inches; Hallways 42+ inches
- Laundry & utility: Main level laundry room; Laundry in hall; Washer hookup; Electric dryer hookup
Neighborhood map
What this means for you Summary
Snapshot
- This is a 3-bed/2.0-bath single-family listed at $215k.
Deal economics
- At list price, monthly cash flow is $301 ($4k/yr) — positive.
- The deal already cash-flows at list — no discount required.
- To meet the 1% rule (rent ≥ 1% of price), the offer needs to be $203k (5.4% below list).
- Recommended offer: $203k (5.4% below list) — sets the bar for 1% rule.
- Cap rate 8.0% vs local median 3.6% in Bemidji — top-decile yield for the area; either an underpriced asset or a hidden risk that comps aren't pricing in. Stress-test before assuming the spread holds.
Location & tenants
- Location reads 73/100 on livability (#252 in MN) — a middle-class / working-renter tenant base. Strengths: amenities A+, cost of living A+, health & safety A+; Watch: crime F, commute F, employment F.
- Bemidji Public School District (rural): math 42% / reading 50% proficiency, ranked #173 of 301 in MN (top 58%) — families likely to look elsewhere, expect single-tenant / working-renter base with shorter leases.
- Market conditions: Rents rising fast (+4.0%/yr); 345 active listings in the ZIP; 1 comparable units currently listed for rent nearby; 165 units permitted in Beltrami County in 2024 (81 in 5+ unit buildings).
- This rent runs 34% of the median local income ($72k/yr) — at the standard rent-burdened threshold; future hikes will face affordability resistance.
Forward outlook
- Local home prices are declining (-3.0%/yr); year-one equity from $1k of loan paydown is wiped out by about $6k of value loss. Plan a longer hold.
Negotiation context
- It's been on market 34 days — a 3% lower offer ($209k) is reasonable based on typical stale-listing flexibility.
Risks & watch-outs
- Climate carrying-cost: major wildfire risk — expect insurance premiums to compound above CPI over the hold.
Questions for the listing agent
- It's been on market 34 days. Have you received any prior offers? Is the seller open to a 5% concession, seller financing, or rate buy-down credit?
- Is there a deadline driving the sale (1031 exchange, divorce, estate, relocation)? That informs how much negotiation room exists.
- Schools are B-rated — typically a magnet for longer-tenancy family renters. What's the average tenant stay here, and is there a school-zone premium baked into asking?
- Crime grade is F in this area — have there been break-ins, vandalism, or insurance claims at this property in the last 3 years? What carrier currently insures it and at what premium?
- What's the average days-on-market for RENTAL listings here right now (not sales)? A rising rental-DOM trend means longer vacancies and softer asking-rent achievability than the comps imply.
- What's the recent tenant-quality profile in this submarket — average credit score on applications, eviction rate, late-payment / NSF rate, and stable-employment percentage? A property-management company in the area should have these aggregated.
- How much new for-sale + rental construction is in the pipeline within 1–3 miles? Heavy new supply typically softens prices + rents 12–24 months out; constrained supply supports both.
Investment metrics
- 1% rule
- 0.95% ✗
- Cap rate
- 7.98%
- Cash-on-cash
- 6.01%
- DSCR
- 1.27
- GRM
- 8.8
CMA / ARV
No comps found within radius.
Projected returns pro-forma
-3.0% appreciation · 4.02% rent growth · sell at horizon
- IRR
- -6.0%
- Equity multiple
- 0.77×
- Total profit
- $-13,610
- Equity at exit
- $32,057
- IRR
- 4.7%
- Equity multiple
- 1.36×
- Total profit
- $21,381
- Equity at exit
- $18,589
Cash invested: $60,200 (down + closing). Projections, not guarantees.
Landlord ↔ Tenant lean methodology
- Overall (STATE)
- 46 Balanced
- State Minnesota
- 46 Balanced · D+2
- County
- — inherits STATE
- City
- — inherits STATE
ZIP-level market 56601
- Home prices YoY
- -26.4%
- Rents YoY
- 4.0%
- Active inventory
- 345
- Price-to-rent
- 8.8×
Monthly cashflow live
- Estimated rent
- $2,034 medium interval (Pro) →
- Mortgage (P&I)
- −$1,127
- Tax from tax record
- −$88 /mo · $1,060/yr
- Insurance
- −$90
- HOA
- −$0
- Vacancy / Maint / Mgmt
- −$427
- Net cashflow
- $301
Break-even live
UW: 25.0% down · 7.5% · 30yr · 1.5% tax · 5.0% vac · 8.0% maint · 8.0% mgmt
Financing live
Cash to close
- Down payment
- $53,750
- Closing costs
- $6,450
- Reserves months
- —
- Total cash needed
- —
Loan-product check · same deal, 3 products live
Conventional
25% down · 7.5% · 30yr
- Down + closing
- —
- Monthly P&I
- —
- Monthly cashflow
- —
- DSCR
- —
- Eligible?
- —
Personal DTI + credit; lowest rate.
DSCR
20% down · 8.5% · 30yr
- Down + closing
- —
- Monthly P&I
- —
- Monthly cashflow
- —
- DSCR
- —
- Eligible?
- —
No personal income docs; deal must DSCR.
Hard money
10% down · 12.0% · 12mo
- Down + closing
- —
- Monthly P&I
- —
- Monthly cashflow
- —
- DSCR
- —
- Eligible?
- —
Short-term bridge; refi at stabilization.
Rent comps 1 comps
| Address | Beds | Baths | Sqft | Rent | $/sqft | DOM | Units | Dist |
|---|---|---|---|---|---|---|---|---|
| 715 Lake Shore Dr NE #115 Bemidji, MN | 3.0 | 2.0 | 1904 | $3,000 | $1.58 | 44d | 1 | 1.46mi |
Listing history 3 events
-
2026-05-12status Pending
-
2026-04-21historical Contingent - Inspection
-
2026-04-07$215,000 Active
ⓘ Source: listings_history table (triggers on properties + properties_extension) + one-shot
backfill from property_details.listing_events for pre-trigger history.
Tax reassessment forecast MN · Partial reset (capped growth)
- Current annual tax
- $1,060 · $88/mo
- Projected year-2 tax
- $1,734 · $144/mo
- Expected delta
- +$674/yr (+$56/mo · 63.6%)
ⓘ Screening estimate from a state-policy table — verify with the county assessor before closing.
Climate risk First Street
- Flood 1/10 Low 0% chance over 30 yrs
- Wildfire 7/10 Severe
- Heat 1/10 Low 7 d/yr ≥93°F today · 12 d/yr by 30 yrs out
- Wind 1/10 Low
- Air quality 3/10 Moderate 3 unhealthy d/yr today · 4 by 30 yrs out
Nearby sold comps map
Loading sold comps map…
Walkable amenities ~0.75 mi
Loading nearby amenities…
Taxation est. · year 1
- Rental income
- $24,408
- − Mortgage interest
- −$12,043
- − Property taxes
- −$1,060
- − Insurance
- −$1,075
- − Repairs & maintenance
- −$1,953
- − Management
- −$1,953
- − Depreciation
- −$6,255
- Taxable income
- $70
- Est. tax owed @ 24.0%
- −$17
- After-tax cash flow
- $3,601/yr
For passive investors: Depreciation is non-cash, so a rental often shows a tax loss while cash-flowing — sheltering income. Rental losses are passive: they offset passive income freely, and up to $25,000/yr can offset ordinary (W-2) income if you actively participate and your MAGI is under $100k (phasing out to $0 by $150k); unused losses carry forward. On sale, claimed depreciation is recaptured at up to 25%, and gains may owe capital-gains tax (a 1031 exchange can defer both). Figures are a year-1 estimate at your 24.0% rate — not tax advice; consult a CPA.
Schools (NCES district)
- District
- Bemidji Public School District
- NCES district ID
- 2704440
- Math proficiency
- 42% ▼ -9.00%
- Reading proficiency
- 50% ▼ -5.00%
- Median HH income
- $47,735
- Composite
- 39.22/100
- National rank
- #4013
- State rank
- #173 of 301 in MN
Livability — Bemidji
- Score
- 73/100
- State rank
- #252
- US rank
- #5416
Category grades
Schools grade is shown separately in the Schools card above.
Census & demographics
- County
- Beltrami County · 34,784 people
- City population
- 34,784
- Metro
- Bemidji, MN
- Population (ZIP)
- 34,784
- Household income
- $72,262
- Rent vs Own
- Severe rent burden
- 940.0
Population outlook (Beltrami County) Hauer SSP2
- Today (2025)
- 46,437 people
- By 2030
- 46,736 · +0.6%
- By 2040
- 46,804 · +0.8%
- By 2050
- 46,299 · -0.3%
- By 2075
- 44,037 · -5.2%
- By 2100
- 38,567 · -16.9%
Race, ethnicity, and origin ACS 2023
- Neighborhood character
- Predominantly White (80%)
- Race & ethnicity
- White 80% Native American 8% Two or more races 7% Hispanic / Latino 3% Black 1%
- Common ancestry
- Portuguese 19% Lithuanian 3% Romanian 2%
- Foreign-born
- 2% · Canada
- Languages at home
- 97% English-only · Spanish 1%
Political lean MEDSL · Beltrami
- 2024 margin
- Lean R (+5.7) · D 46.3% · R 52.0% · Other 1.7%
- 2008→2024 swing
- -15.8pp toward R · 2008: 10.2pp · 2024: -5.7pp
- All cycles
- 2024: R+5.7 2020: R+3.1 2016: R+9.8 2012: D+9.9 2008: D+10.2
Not yet ingested
- Civics
- —
Market trends
- HPI YoY
- ▼ -93.95%
- Current HPI
- 261.5734
- Rent YoY
- ▲ 4.02%
- Metro
- Bemidji, MN
- State GDP YoY
- ▲ 2.41%
- F500 in state
- 34
Industry mix (Fortune 500 HQ in MN)
| Industry | F500 HQs | Revenue |
|---|---|---|
| Healthcare | 2 | $407B |
|
||
| Retail | 2 | $150B |
|
||
| Consumer Goods | 2 | $32B |
|
||
| Industrial Machinery | 2 | $6B |
|
||
| Agriculture | 1 | $40B |
|
||
| Healthcare / Medical Devices | 1 | $32B |
|
||
Price history
3 events — show timeline
- 2026-05-12 Pending — NORTHSTARMLS as Distributed by MLS Grid
- 2026-04-21 Contingent — NORTHSTARMLS as Distributed by MLS Grid
- 2026-04-07 Listed $215,000 NORTHSTARMLS as Distributed by MLS Grid
Property tax history
+1.9%/yrLatest (2025): $1,060 · -1.7% YoY. Source: county tax records.
Cash-flow waterfall
monthlySold comps — $/sqft
last 12 mo · ≤1 miLoading sold comps…