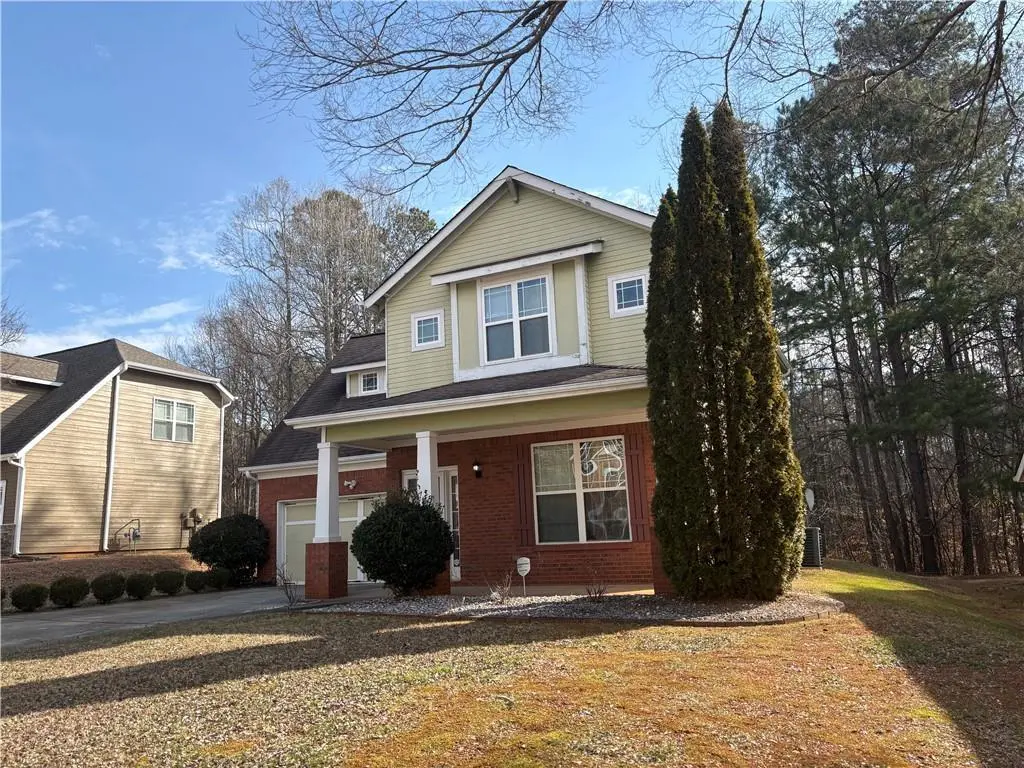
404 Park Pl · Fairburn, GA
Flood risk 1/10 · Minimal
- FEMA flood zone
- X (unshaded)
- Chance of flooding over 30 yrs
- 0.0%
- Est. flood insurance / yr
- $507 – $1,088
Fire risk 3/10 · Minor
- Est. fire insurance / yr
- $963 – $1,789
Heat risk 6/10 · Moderate
- Hot days now (above 103°F)
- 7 days/yr
- Hot days in 30 yrs
- 19 days/yr
Wind risk 6/10 · Moderate
- Chance of severe wind over 30 yrs
- 27.0%
Air-quality risk 3/10 · Minor
- Unhealthy air days now
- 3 days/yr
- Unhealthy air days in 30 yrs
- 4 days/yr
Risk factors via First Street. Map © Google.
Why this score? — see what drove the D+ grade
The composite is a weighted blend of 9 inputs, each scored 0–100. Each bar is that input's sub-score; the figure is the points it added to the 100-point composite (weight × sub-score).
- Cash flow +15.8/30.0
- ARV discount +11.6/15.0
- DSCR +4.9/10.0
- Schools +4.5/10.0
- 1% rule +3.7/10.0
- Livability +3.2/5.0
- Rent growth +3.1/5.0
- Condition / age +2.5/5.0
- Appreciation +0.0/10.0
$295,000
🖨 Deal sheet 📄 Offer letter ✓ Due diligence
Listing remarks MLS
4 Bedrooms, 2.5 baths, 2-story home.
Key facts
- 9,147 sq ft lot
- 2 garage spots
- Built 2004
Neighborhood map
What this means for you Summary
Snapshot
- This is a 4-bed/3.5-bath single-family listed at $295k.
Deal economics
- At list price, monthly cash flow is $137 ($2k/yr) — positive.
- The deal already cash-flows at list — no discount required.
- To meet the 1% rule (rent ≥ 1% of price), the offer needs to be $257k (12.9% below list).
- Recommended offer: $257k (12.9% below list) — sets the bar for 1% rule.
- Cap rate 6.8% vs local median 4.0% in Fairburn — top-decile yield for the area; either an underpriced asset or a hidden risk that comps aren't pricing in. Stress-test before assuming the spread holds.
Location & tenants
- Location reads 63/100 on livability (#291 in GA) — a middle-class / working-renter tenant base. Strengths: crime A+, cost of living A+, housing A+; Watch: employment C-, schools F, amenities F.
- Fulton County (suburban): math 49% / reading 53% proficiency, ranked #12 of 174 in GA (top 7%) — acceptable for families but not a draw, mixed tenant base, ~2y average lease.
- Market conditions: Rents rising (+2.5%/yr); 531 active listings in the ZIP; 22 comparable units currently listed for rent nearby; rentals at typical pace (median 24d on market — plan ~3-4 weeks tenant-placement turnaround); 41% of comp listings sitting > 30 days — soft ceiling on asking rent; solid renter incomes; 11,565 units permitted in Fulton County in 2024 (8,159 in 5+ unit buildings).
- This rent runs 33% of the median local income ($94k/yr) — at the standard rent-burdened threshold; future hikes will face affordability resistance.
Forward outlook
- Local home prices are declining (-3.0%/yr); year-one equity from $2k of loan paydown is wiped out by about $9k of value loss. Plan a longer hold.
- Fulton County population projected at +38% by 2050 — long-run rental-demand tailwind backs the buy-and-hold thesis.
Negotiation context
- It's been on market 124 days — a 12% lower offer ($260k) is reasonable based on typical stale-listing flexibility.
- 3 sale attempts since 16y ago with the ask held roughly flat each time — persistent listings suggest the price (not the market) is what's stuck; bring a comps-based counter.
- Current owner paid $90k; list at $295k implies a 228% gain — meaningful room to come down on a strong offer.
Risks & watch-outs
- Climate carrying-cost: major wind risk, 27% chance of damaging wind over 30y; extreme-heat days projected 7→19/yr by 2055 (HVAC capex compounding) — expect insurance premiums to compound above CPI over the hold.
Questions for the listing agent
- It's been on market 124 days. Have you received any prior offers? Is the seller open to a 13% concession, seller financing, or rate buy-down credit?
- What does the HOA fee cover, when was the last increase, and are there any pending special assessments or reserve-fund shortfalls?
- Why hasn't it sold? Are there any deal-killer items the seller is aware of (foundation, flood, title, zoning, code violations)?
- Is there a deadline driving the sale (1031 exchange, divorce, estate, relocation)? That informs how much negotiation room exists.
- Schools are F-rated, which usually means shorter tenancies and higher turnover. Who's the typical renter profile here, and what's been the actual vacancy rate?
- The area grade is low — what's the realistic commute time and amenity access for the typical tenant pool here? Any planned neighborhood developments (good or bad) we should know about?
- What's the average days-on-market for RENTAL listings here right now (not sales)? A rising rental-DOM trend means longer vacancies and softer asking-rent achievability than the comps imply.
- What's the recent tenant-quality profile in this submarket — average credit score on applications, eviction rate, late-payment / NSF rate, and stable-employment percentage? A property-management company in the area should have these aggregated.
- How much new for-sale + rental construction is in the pipeline within 1–3 miles? Heavy new supply typically softens prices + rents 12–24 months out; constrained supply supports both.
Investment metrics
- 1% rule
- 0.87% ✗
- Cap rate
- 6.85%
- Cash-on-cash
- 1.98%
- DSCR
- 1.09
- GRM
- 9.6
CMA / ARV
- ARV (median comp)
- $324,775
- List price
- $295,000
- Delta
- -9.17%
- Verdict
- FAIR
- Comps
- 20 within 1.0 mi
Show comp detail 2 sales within ~0.75 mi
| Address | Dist | Beds/Ba | Sqft | Sold | Price | $/sf | Match |
|---|---|---|---|---|---|---|---|
| 2120 Village Green Dr | 0.11mi | 4/3.0 | 1,951 (-0%) | 1mo | $320,000 | $164 | 91 |
| 5845 Highway 92 | 0.71mi | 5/3.0 (+1) | 2,072 (+6%) | 9mo | $310,000 | $150 | 43 |
Match score weights: distance 35% · size 25% · config 20% · recency 20%. Top-matched comps best support the ARV.
Projected returns pro-forma
-3.0% appreciation · 2.53% rent growth · sell at horizon
- IRR
- -13.7%
- Equity multiple
- 0.51×
- Total profit
- $-40,361
- Equity at exit
- $43,985
- IRR
- -5.5%
- Equity multiple
- 0.65×
- Total profit
- $-29,062
- Equity at exit
- $25,506
Cash invested: $82,600 (down + closing). Projections, not guarantees.
Landlord ↔ Tenant lean methodology
- Overall (STATE)
- 90 Strongly Landlord-Friendly
- State Georgia
- 90 Strongly Landlord-Friendly · R+3
- County
- — inherits STATE
- City
- — inherits STATE
ZIP-level market 30213
- Home prices YoY
- -17.7%
- Rents YoY
- 2.5%
- Active inventory
- 531
- Price-to-rent
- 9.6×
Monthly cashflow live
- Estimated rent
- $2,569 high interval (Pro) →
- Mortgage (P&I)
- −$1,547
- Tax from tax record
- −$190 /mo · $2,283/yr
- Insurance
- −$123
- HOA
- −$33
- Vacancy / Maint / Mgmt
- −$540
- Net cashflow
- $137
Break-even live
UW: 25.0% down · 7.5% · 30yr · 1.5% tax · 5.0% vac · 8.0% maint · 8.0% mgmt
Financing live
Cash to close
- Down payment
- $73,750
- Closing costs
- $8,850
- Reserves months
- —
- Total cash needed
- —
Loan-product check · same deal, 3 products live
Conventional
25% down · 7.5% · 30yr
- Down + closing
- —
- Monthly P&I
- —
- Monthly cashflow
- —
- DSCR
- —
- Eligible?
- —
Personal DTI + credit; lowest rate.
DSCR
20% down · 8.5% · 30yr
- Down + closing
- —
- Monthly P&I
- —
- Monthly cashflow
- —
- DSCR
- —
- Eligible?
- —
No personal income docs; deal must DSCR.
Hard money
10% down · 12.0% · 12mo
- Down + closing
- —
- Monthly P&I
- —
- Monthly cashflow
- —
- DSCR
- —
- Eligible?
- —
Short-term bridge; refi at stabilization.
Rent comps 22 comps
| Address | Beds | Baths | Sqft | Rent | $/sqft | DOM | Units | Dist |
|---|---|---|---|---|---|---|---|---|
| 145 Parkway Dr Fairburn, GA | 4.0 | 2.5 | 2372 | $2,440 | $1.03 | 43d | 1 | 0.16mi |
| 6155 Dodson Rd Fairburn, GA | 4.0 | 2.5 | 2400 | $2,600 | $1.08 | 12d | 1 | 0.40mi |
| 6460 Lake Esther Dr Fairburn, GA | 4.0 | 3.0 | 1300 | $1,997 | $1.54 | 10d | 1 | 0.73mi |
| 6460 Lake Esther Dr Fairburn, GA | 4.0 | 3.0 | 1300 | $2,300 | $1.77 | 43d | 1 | 0.73mi |
| 6015 Deer Run St Union City, GA | 5.0 | 2.5 | 2360 | $2,700 | $1.14 | 24d | 1 | 0.75mi |
| 1013 Eldon Ln Fairburn, GA | 4.0 | 2.5 | 2440 | $2,379 | $0.97 | 16d | 1 | 0.81mi |
| 8317 Hunters Grove Rd Union City, GA | 4.0 | 2.5 | 1821 | $5,500 | $3.02 | 43d | 1 | 0.82mi |
| 1008 Eldon Ln Fairburn, GA | 4.0 | 3.0 | 2402 | $2,539 | $1.06 | 11d | 1 | 0.84mi |
| 220 Splitwood Ln Fairburn, GA | 3.0 | 2.0 | 1424 | $1,850 | $1.30 | 20d | 1 | 0.99mi |
| 220 Splitwood Ln Fairburn, GA | 3.0 | 2.0 | 1424 | $1,850 | $1.30 | 43d | 1 | 0.99mi |
| 220 Splitwood Ln Fairburn, GA | 3.0 | 2.0 | 1424 | $1,850 | $1.30 | 5d | 1 | 0.99mi |
| 220 Splitwood Ln Fairburn, GA | 3.0 | 2.0 | 1424 | $1,850 | $1.30 | 24d | 1 | 0.99mi |
| 12006 Crosswicks Rd Union City, GA | 3.0 | 2.0 | 1413 | $2,545 | $1.80 | 15d | 1 | 1.02mi |
| 12006 Crosswicks Rd Unit 105 Union City, GA | 3.0 | 2.5 | 1413 | $2,455 | $1.74 | 43d | 1 | 1.02mi |
| 12006 Crosswicks Rd Union City, GA | 4.0 | 3.0 | 1821 | $3,468 | $1.90 | 44d | 1 | 1.02mi |
| 12006 Crosswicks Rd Unit Sunshine Union City, GA | 4.0 | 2.5 | 1821 | $2,770 | $1.52 | 3d | 1 | 1.08mi |
| 165 Fireside Way Fairburn, GA | 4.0 | 3.0 | 2230 | $2,396 | $1.07 | 43d | 1 | 1.16mi |
| 486 Samara Ct Fairburn, GA | 4.0 | 2.5 | 2002 | $2,495 | $1.25 | 24d | 1 | 1.18mi |
| 12076 Crosswicks Rd Union City, GA | 3.0–4.0 | 2.0–2.5 | 1617 | $2,831 | $1.75 | 1d | 6 | 1.20mi |
| 5791 Blacktop Ct Fairburn, GA | 4.0 | 2.5 | 1991 | $2,423 | $1.22 | 43d | 1 | 1.26mi |
| 200 Dodd St Fairburn, GA | 3.0 | 2.0 | 1300 | $1,685 | $1.30 | 43d | 1 | 1.36mi |
| 152 Rivertown Rd Fairburn, GA | 3.0 | 2.0 | 1550 | $3,500 | $2.26 | 21d | 1 | 1.50mi |
HOA detail
- Monthly dues
- $33 · $396/yr
Listing history 19 events
-
2026-06-18days on market $295,000 Active 124 DOM
-
2026-06-17days on market $295,000 Active 123 DOM
-
2026-06-16days on market $295,000 Active 122 DOM
-
2026-06-15days on market $295,000 Active 121 DOM
-
2026-06-13days on market $295,000 Active 119 DOM
-
2026-06-09days on market $295,000 Active 115 DOM
-
2026-06-08days on market $295,000 Active 114 DOM
-
2026-06-07days on market $295,000 Active 113 DOM
-
2026-06-04days on market $295,000 Active 111 DOM
-
2026-06-03days on market $295,000 Active 110 DOM
-
2026-06-01days on market $295,000 Active 108 DOM
-
2026-05-31days on market $295,000 Active 107 DOM
-
2026-02-13$295,000 New 36-char remark
Show marketing remark (36 chars)
4 Bedrooms, 2.5 baths, 2-story home.
-
2026-02-13$295,000 Active 36-char remark
Show marketing remark (36 chars)
4 Bedrooms, 2.5 baths, 2-story home.
-
2010-06-10historical
-
2010-03-18soldstatus $89,999 Sold
-
2010-02-25status Pending
-
2010-02-01historical
-
2010-01-11$89,999 Active
ⓘ Source: listings_history table (triggers on properties + properties_extension) + one-shot
backfill from property_details.listing_events for pre-trigger history.
Tax reassessment forecast GA · Resets to sale price
- Current annual tax
- $2,283 · $190/mo
- Projected year-2 tax
- $2,714 · $226/mo
- Expected delta
- +$431/yr (+$36/mo · 18.9%)
ⓘ Screening estimate from a state-policy table — verify with the county assessor before closing.
Climate risk First Street
- Flood 1/10 Low FEMA zone X (unshaded) · 0% chance over 30 yrs
- Wildfire 3/10 Moderate
- Heat 6/10 Major 7 d/yr ≥103°F today · 19 d/yr by 30 yrs out
- Wind 6/10 Major 27% chance of damaging wind over 30 yrs
- Air quality 3/10 Moderate 3 unhealthy d/yr today · 4 by 30 yrs out
Nearby sold comps map
Loading sold comps map…
Walkable amenities ~0.75 mi
Loading nearby amenities…
Taxation est. · year 1
- Rental income
- $30,832
- − Mortgage interest
- −$16,525
- − Property taxes
- −$2,283
- − Insurance
- −$1,475
- − Repairs & maintenance
- −$2,467
- − Management
- −$2,467
- − HOA
- −$396
- − Depreciation
- −$8,582
- Taxable loss
- −$3,361
- Est. tax savings @ 24.0%
- +$807
- After-tax cash flow
- $2,446/yr
For passive investors: Depreciation is non-cash, so a rental often shows a tax loss while cash-flowing — sheltering income. Rental losses are passive: they offset passive income freely, and up to $25,000/yr can offset ordinary (W-2) income if you actively participate and your MAGI is under $100k (phasing out to $0 by $150k); unused losses carry forward. On sale, claimed depreciation is recaptured at up to 25%, and gains may owe capital-gains tax (a 1031 exchange can defer both). Figures are a year-1 estimate at your 24.0% rate — not tax advice; consult a CPA.
Schools (NCES district)
- District
- Fulton County
- NCES district ID
- 1302280
- Math proficiency
- 49% ▼ -2.00%
- Reading proficiency
- 53% ▬ 0.00%
- Median HH income
- $68,035
- Composite
- 45.33/100
- National rank
- #2640
- State rank
- #12 of 174 in GA
Livability — Fairburn
- Score
- 63/100
- State rank
- #291
- US rank
- #15939
Category grades
Schools grade is shown separately in the Schools card above.
Census & demographics
- Census place
- Fairburn, GA
- County
- Fulton County · 1,094,430 people
- City population
- 50,621
- Metro
- Atlanta-Sandy Springs-Alpharetta, GA
- Population (ZIP)
- 50,621
- Household income
- $94,125
- Rent vs Own
- Severe rent burden
- 1025.0
Population outlook (Fulton County) Hauer SSP2
- Today (2025)
- 1,203,707 people
- By 2030
- 1,299,706 · +8.0%
- By 2040
- 1,488,256 · +23.6%
- By 2050
- 1,664,580 · +38.3%
- By 2075
- 2,036,072 · +69.2%
- By 2100
- 2,222,402 · +84.6%
Race, ethnicity, and origin ACS 2023
- Neighborhood character
- Predominantly Black (86%)
- Race & ethnicity
- Black 86% White 8% Hispanic / Latino 4% Two or more races 3%
- Common ancestry
- Hispanic 1% Arab 1% Lithuanian 0%
- Foreign-born
- 7% · Canada
- Languages at home
- 91% English-only · Spanish 4% French/Haitian/Cajun 2% Arabic 1%
Political lean MEDSL · Fulton
- 2024 margin
- Solid D (+44.9) · D 71.9% · R 27.0% · Other 1.1%
- 2008→2024 swing
- +9.8pp toward D · 2008: 35.0pp · 2024: 44.9pp
- All cycles
- 2024: D+44.9 2020: D+46.4 2016: D+42.1 2012: D+29.6 2008: D+35.0
Not yet ingested
- Civics
- —
Market trends
- HPI YoY
- ▼ -50.66%
- Current HPI
- 235.9372
- Rent YoY
- ▲ 2.53%
- Metro
- Atlanta-Sandy Springs-Alpharetta, GA
- State GDP YoY
- ▲ 2.66%
- F500 in state
- 28
Industry mix (Fortune 500 HQ in GA)
| Industry | F500 HQs | Revenue |
|---|---|---|
| Paper / Packaging | 2 | $29B |
|
||
| Retail | 1 | $160B |
|
||
| Transportation / Logistics | 1 | $91B |
|
||
| Airlines | 1 | $62B |
|
||
| Consumer Goods | 1 | $47B |
|
||
| Utilities | 1 | $25B |
|
||
Price history
+227.8% since first listed7 events — show timeline
- 2026-02-13 Listed $295,000 FMLS
- 2026-02-13 Listed $295,000 GAMLS
- 2010-06-10 Listing Removed — FMLS
- 2010-03-18 Sold (MLS) $89,999 FMLS
- 2010-02-25 Pending — FMLS
- 2010-02-01 Listing Removed — FMLS
- 2010-01-11 Listed $89,999 FMLS
Property tax history
+2.0%/yrLatest (2025): $2,283 · -0.4% YoY. Source: county tax records.
Cash-flow waterfall
monthlySold comps — $/sqft
last 12 mo · ≤1 miLoading sold comps…