 🏢 Co-op
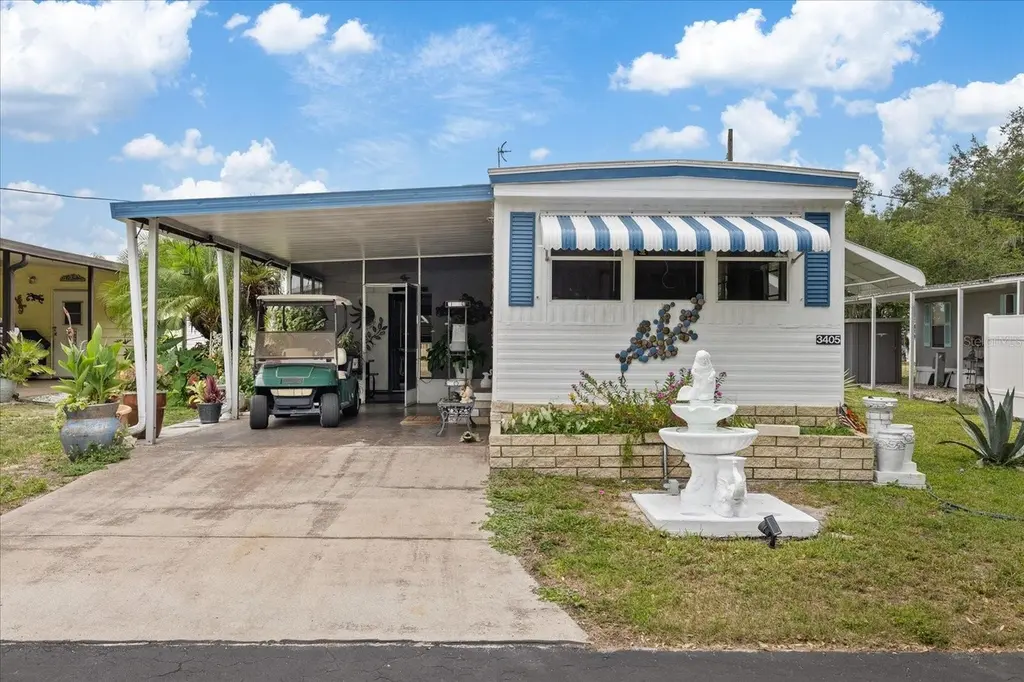
3405 Florence Dr · Bradenton, FL
Flood risk No data
- FEMA flood zone
- —
- Chance of flooding over 30 yrs
- —
- Est. flood insurance / yr
- —
Fire risk No data
- Est. fire insurance / yr
- —
Heat risk No data
- Hot days now (above threshold)
- —
- Hot days in 30 yrs
- —
Wind risk No data
- Chance of severe wind over 30 yrs
- —
Air-quality risk No data
- Unhealthy air days now
- —
- Unhealthy air days in 30 yrs
- —
Risk factors via First Street. Map © Google.
Why this score? — see what drove the C+ grade
The composite is a weighted blend of 9 inputs, each scored 0–100. Each bar is that input's sub-score; the figure is the points it added to the 100-point composite (weight × sub-score).
- Cash flow +30.0/30.0
- 1% rule +10.0/10.0
- DSCR +10.0/10.0
- Schools +4.4/10.0
- Livability +4.0/5.0
- Rent growth +2.5/5.0
- Condition / age +2.5/5.0
- ARV discount +0.0/15.0
- Appreciation +0.0/10.0
$90,000
🖨 Deal sheet 📄 Offer letter ✓ Due diligence
Listing remarks MLS
Being sold As Is with right to inspect. This trailer is turn key furnished and is ideal for the snowbirds or even full time residents. Built in 1967 by Skyline with 540 Sq Ft of heated and A/C space. Night roving security patrol from 10:00PM until 6:00AM. On site management. Price of $20,900 includes the Co-op share valued at $25,000. This is built in equity. Close to I075 and the Ellenton OutletMall. 2011 taxes were $411 without a homestead exemption.
Key facts
- Insulated workshop
- Updated in 2019
- Open living area
Tags
Property features AI
Finance
- Other: Furnished; Homestead exemption applied; Zoning: RSMH-6; Road surface: Paved; Lot approx. 0.06 acre
- Financial info: Total monthly fees: $211 (monthly); Total annual fees: $2,532; Lease restrictions apply
- HOA & community: Has HOA (Deb Bell) with required monthly fee of $211; HOA fee includes management, pool, sewer, trash and water; Association amenities: Clubhouse, Pool, Park, Shuffleboard court; Association approval required; Community features: Clubhouse, Golf carts OK, Park, Pool; Senior community; Cats and dogs allowed
Exterior
- Parking: Has carport (1 space)
- Utilities: Public water; Public sewer; Public utilities; Irrigation equipment
- Home design: Mobile home (single wide); One story; Faces east; Entry level: One
- Construction: Vinyl siding; Membrane roof; Crawlspace foundation; Building area: 1,080 total
- Exterior features: Private mailbox; Rain gutters; Shed(s); Workshop; Fruit trees and mature landscaping; Trees/landscaped
Interior
- Kitchen: Range
- Bedrooms: 2 bedrooms
- Flooring: Laminate flooring
- Bathrooms: 1 full bathroom
- Heating & cooling: Ductless heating; Wall/window cooling unit(s)
- Interior features: Other interior features
- Laundry & utility: Laundry: Other
Neighborhood map
What this means for you Summary
Snapshot
- This is a 2-bed/1.0-bath manufactured listed at $90k.
Deal economics
- At list price, monthly cash flow is $514 ($6k/yr) — positive.
- The deal already cash-flows at list — no discount required.
- Meets the 1% rule at list price ($2k rent vs $90k).
- Cap rate 13.2% vs local median 3.6% in Bradenton — top-decile yield for the area; either an underpriced asset or a hidden risk that comps aren't pricing in. Stress-test before assuming the spread holds.
Location & tenants
- Location reads 81/100 on livability (#101 in FL, #1,528 nationally) — a professional / high-income tenant draw. Strengths: commute A+, cost of living A+, housing A+; Watch: employment D+, crime D, amenities F.
- Manatee (suburban): math 54% / reading 50% proficiency, ranked #26 of 73 in FL (top 36%) — acceptable for families but not a draw, mixed tenant base, ~2y average lease.
- Market conditions: 182 active listings in the ZIP; 7,472 units permitted in Manatee County in 2024 (1,782 in 5+ unit buildings).
- This rent runs 31% of the median local income ($64k/yr) — at the standard rent-burdened threshold; future hikes will face affordability resistance.
Forward outlook
- Local home prices are declining (-3.0%/yr); year-one equity from $622 of loan paydown is wiped out by about $3k of value loss. Plan a longer hold.
- Manatee County population projected at +43% by 2050 — long-run rental-demand tailwind backs the buy-and-hold thesis.
- At projected returns (-3.0% appreciation + 3.0% rent growth), your $25k cash investment doubles in ~5 years — after that, you're playing with house money.
Negotiation context
- Only 7 days on market — expect competitive offers; lowballing is unlikely to land.
- 2 sale attempts since 14y ago with the ask held roughly flat each time — persistent listings suggest the price (not the market) is what's stuck; bring a comps-based counter.
- Current owner paid $65k; 38% above their basis — modest negotiation headroom, anchor on the comps not their cost.
Questions for the listing agent
- Built in 1967 — when were the roof, HVAC, electrical panel, plumbing, and water heater last replaced?
- What does the HOA fee cover, when was the last increase, and are there any pending special assessments or reserve-fund shortfalls?
- Is there a deadline driving the sale (1031 exchange, divorce, estate, relocation)? That informs how much negotiation room exists.
- Crime grade is D in this area — have there been break-ins, vandalism, or insurance claims at this property in the last 3 years? What carrier currently insures it and at what premium?
- What's the average days-on-market for RENTAL listings here right now (not sales)? A rising rental-DOM trend means longer vacancies and softer asking-rent achievability than the comps imply.
- What's the recent tenant-quality profile in this submarket — average credit score on applications, eviction rate, late-payment / NSF rate, and stable-employment percentage? A property-management company in the area should have these aggregated.
- How much new for-sale + rental construction is in the pipeline within 1–3 miles? Heavy new supply typically softens prices + rents 12–24 months out; constrained supply supports both.
Investment metrics
- 1% rule
- 1.84% ✓
- Cap rate
- 13.15%
- Cash-on-cash
- 24.49%
- DSCR
- 2.09
- GRM
- 4.5
CMA / ARV
- ARV (on-the-fly)
- $71,280
- Comps found
- 3
Show comp detail 3 sales within ~0.75 mi
| Address | Dist | Beds/Ba | Sqft | Sold | Price | $/sf | Match |
|---|---|---|---|---|---|---|---|
| 7708 Terra Siesta Blvd E | 0.29mi | 2/1.0 | 528 (-2%) | 13mo | $68,500 | $130 | 72 |
| 3109 Cynthia Pl | 0.20mi | 1/1.0 (-1) | 600 (+11%) | 1mo | $87,000 | $145 | 66 |
| 7704 Terra Siesta Blvd | 0.30mi | 2/1.0 | 612 (+13%) | 2mo | $81,000 | $132 | 62 |
Match score weights: distance 35% · size 25% · config 20% · recency 20%. Top-matched comps best support the ARV.
Projected returns pro-forma
-3.0% appreciation · 3.0% rent growth · sell at horizon
- IRR
- 17.9%
- Equity multiple
- 1.73×
- Total profit
- $18,305
- Equity at exit
- $13,419
- IRR
- 26.4%
- Equity multiple
- 3.33×
- Total profit
- $58,656
- Equity at exit
- $7,782
Cash invested: $25,200 (down + closing). Projections, not guarantees.
Landlord ↔ Tenant lean methodology
- Overall (STATE)
- 87 Strongly Landlord-Friendly
- State Florida
- 87 Strongly Landlord-Friendly · R+3
- County
- — inherits STATE
- City
- — inherits STATE
ZIP-level market 34222
- Home prices YoY
- -26.9%
- Active inventory
- 182
- Price-to-rent
- 4.5×
Monthly cashflow live
- Estimated rent
- $1,659 medium interval (Pro) →
- Mortgage (P&I)
- −$472
- Tax from tax record
- −$76 /mo · $915/yr
- Insurance
- −$38
- HOA
- −$211
- Vacancy / Maint / Mgmt
- −$348
- Net cashflow
- $514
Break-even live
UW: 25.0% down · 7.5% · 30yr · 1.5% tax · 5.0% vac · 8.0% maint · 8.0% mgmt
Financing live
Cash to close
- Down payment
- $22,500
- Closing costs
- $2,700
- Reserves months
- —
- Total cash needed
- —
Loan-product check · same deal, 3 products live
Conventional
25% down · 7.5% · 30yr
- Down + closing
- —
- Monthly P&I
- —
- Monthly cashflow
- —
- DSCR
- —
- Eligible?
- —
Personal DTI + credit; lowest rate.
DSCR
20% down · 8.5% · 30yr
- Down + closing
- —
- Monthly P&I
- —
- Monthly cashflow
- —
- DSCR
- —
- Eligible?
- —
No personal income docs; deal must DSCR.
Hard money
10% down · 12.0% · 12mo
- Down + closing
- —
- Monthly P&I
- —
- Monthly cashflow
- —
- DSCR
- —
- Eligible?
- —
Short-term bridge; refi at stabilization.
HOA detail
- Monthly dues
- $211 · $2,532/yr
- Likely covers
- security
Listing history 7 events
-
2026-06-18days on market $90,000 Active 7 DOM
-
2026-06-17days on market $90,000 Active 6 DOM
-
2026-06-16days on market $90,000 Active 5 DOM
-
2026-06-15days on market $90,000 Active 4 DOM
-
2026-06-13days on market $90,000 Active 2 DOM
-
2026-06-13remarks 692-char remark
-
2026-06-13$90,000 Active 1 DOM
ⓘ Source: listings_history table (triggers on properties + properties_extension) + one-shot
backfill from property_details.listing_events for pre-trigger history.
Tax reassessment forecast FL · Resets to sale price
- Current annual tax
- $915 · $76/mo
- Projected year-2 tax
- $915 · $76/mo
- Expected delta
- $0/yr ($0/mo · 0.0%)
ⓘ Screening estimate from a state-policy table — verify with the county assessor before closing.
Nearby sold comps map
Loading sold comps map…
Walkable amenities ~0.75 mi
Loading nearby amenities…
Taxation est. · year 1
- Rental income
- $19,914
- − Mortgage interest
- −$5,041
- − Property taxes
- −$915
- − Insurance
- −$450
- − Repairs & maintenance
- −$1,593
- − Management
- −$1,593
- − HOA
- −$2,532
- − Depreciation
- −$2,618
- Taxable income
- $5,171
- Est. tax owed @ 24.0%
- −$1,241
- After-tax cash flow
- $4,930/yr
For passive investors: Depreciation is non-cash, so a rental often shows a tax loss while cash-flowing — sheltering income. Rental losses are passive: they offset passive income freely, and up to $25,000/yr can offset ordinary (W-2) income if you actively participate and your MAGI is under $100k (phasing out to $0 by $150k); unused losses carry forward. On sale, claimed depreciation is recaptured at up to 25%, and gains may owe capital-gains tax (a 1031 exchange can defer both). Figures are a year-1 estimate at your 24.0% rate — not tax advice; consult a CPA.
Schools (NCES district)
- District
- Manatee
- NCES district ID
- 1201230
- Math proficiency
- 54% ▼ -6.00%
- Reading proficiency
- 50% ▼ -2.00%
- Median HH income
- $49,607
- Composite
- 44.43/100
- National rank
- #2806
- State rank
- #26 of 73 in FL
Livability — Bradenton
- Score
- 81/100
- State rank
- #101
- US rank
- #1528
Category grades
Schools grade is shown separately in the Schools card above.
Census & demographics
- County
- Manatee County · 416,364 people
- City population
- 227,091
- Metro
- North Port-Sarasota-Bradenton, FL
- Population (ZIP)
- 14,819
- Household income
- $64,355
- Rent vs Own
- Severe rent burden
- 313.0
Population outlook (Manatee County) Hauer SSP2
- Today (2025)
- 447,342 people
- By 2030
- 488,911 · +9.3%
- By 2040
- 567,934 · +27.0%
- By 2050
- 637,995 · +42.6%
- By 2075
- 781,970 · +74.8%
- By 2100
- 848,272 · +89.6%
Race, ethnicity, and origin ACS 2023
- Neighborhood character
- Predominantly White (70%)
- Race & ethnicity
- White 70% Hispanic / Latino 17% Two or more races 13% Black 7% Native American 2% Asian 1%
- Hispanic origin (detail)
- Mexican 8% Puerto Rican 2%
- Common ancestry
- Romanian 3% Slovak 2% Lithuanian 2%
- Foreign-born
- 8% · Canada, Jamaica, Vietnam
- Languages at home
- 88% English-only · Spanish 10% Other Indo-European 1% Vietnamese 1%
Political lean MEDSL · Manatee
- 2024 margin
- Strong R (+23.5) · D 37.9% · R 61.4%
- 2008→2024 swing
- -16.5pp toward R · 2008: -7.0pp · 2024: -23.5pp
- All cycles
- 2024: R+23.5 2020: R+16.1 2016: R+17.1 2012: R+12.5 2008: R+7.0
Not yet ingested
- Civics
- —
Market trends
- HPI YoY
- ▼ -107.75%
- Current HPI
- 293.2597
- Rent YoY
- —
- Metro
- North Port-Sarasota-Bradenton, FL
- State GDP YoY
- ▲ 3.28%
- F500 in state
- 36
Industry mix (Fortune 500 HQ in FL)
| Industry | F500 HQs | Revenue |
|---|---|---|
| Industrial Technology | 2 | $29B |
|
||
| Insurance | 2 | $17B |
|
||
| Retail | 1 | $60B |
|
||
| Technology Distribution | 1 | $58B |
|
||
| Homebuilding | 1 | $35B |
|
||
| Technology Manufacturing | 1 | $35B |
|
||
Price history
+400.0% since first listed5 events — show timeline
- 2026-06-11 Listed $90,000 Stellar MLS as Distributed by MLS Grid
- 2022-03-15 Sold (Public Records) $65,000 Public Records
- 2013-02-15 Sold (MLS) $18,500 Stellar MLS as Distributed by MLS Grid
- 2012-11-09 Listed $20,900 Stellar MLS as Distributed by MLS Grid
- 1991-12-05 Sold (Public Records) $18,000 Public Records
Property tax history
+6.5%/yrLatest (2025): $915 · -0.6% YoY. Source: county tax records.
Cash-flow waterfall
monthlySold comps — $/sqft
last 12 mo · ≤1 miLoading sold comps…