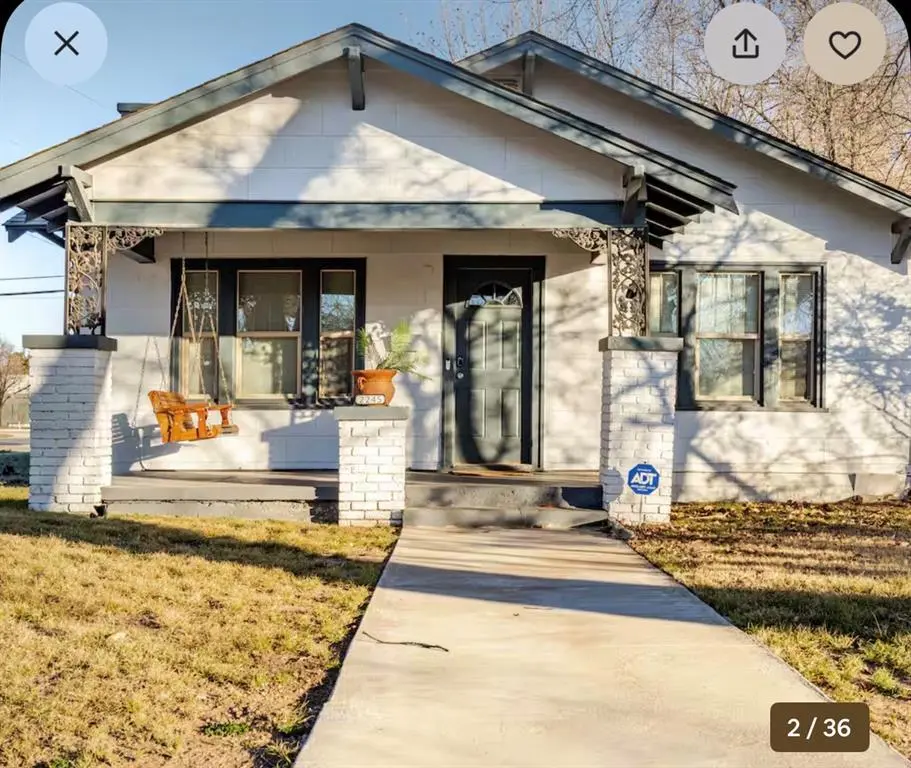
2245 NW 11th St · Oklahoma City, OK
Flood risk 1/10 · Minimal
- FEMA flood zone
- X (unshaded)
- Chance of flooding over 30 yrs
- 0.0%
- Est. flood insurance / yr
- $507 – $1,088
Fire risk 1/10 · Minimal
- Est. fire insurance / yr
- $2,463 – $4,575
Heat risk 6/10 · Moderate
- Hot days now (above 107°F)
- 7 days/yr
- Hot days in 30 yrs
- 19 days/yr
Wind risk 2/10 · Minimal
- Chance of severe wind over 30 yrs
- 3.0%
Air-quality risk 2/10 · Minimal
- Unhealthy air days now
- 1 days/yr
- Unhealthy air days in 30 yrs
- 2 days/yr
Risk factors via First Street. Map © Google.
Why this score? — see what drove the D grade
The composite is a weighted blend of 9 inputs, each scored 0–100. Each bar is that input's sub-score; the figure is the points it added to the 100-point composite (weight × sub-score).
- ARV discount +12.8/15.0
- Cash flow +11.9/30.0
- Rent growth +4.3/5.0
- Livability +4.0/5.0
- DSCR +3.5/10.0
- 1% rule +2.9/10.0
- Condition / age +2.5/5.0
- Schools +0.7/10.0
- Appreciation +0.0/10.0
$189,900
🖨 Deal sheet 📄 Offer letter ✓ Due diligence
Listing remarks MLS
"Prime opportunity in Youngs-Englewood! Solid 3 bed / 2 bath home built in 1920, 1,356 sq ft, ready for your personal touches. Recent comps show great upside in this revitalizing area with easy proximity to downtown OKC, I-40 access, and local amenities. Mature lot with room for outdoor enjoyment and classic curb appeal. Whether you're starting out or adding to your portfolio, this gem won't last long!"
Key facts
- Classic curb appeal
- Mature lot
- I-40 access
Tags
Neighborhood map
What this means for you Summary
Snapshot
- This is a 3-bed/1.0-bath single-family listed at $190k.
Deal economics
- At list price, monthly cash flow is $-49 ($-584/yr) — negative.
- To cash-flow at today's rent, offer at most $181k (4.5% below list).
- To meet the 1% rule (rent ≥ 1% of price), the offer needs to be $150k (20.9% below list).
- Recommended offer: $150k (20.9% below list) — sets the bar for 1% rule.
- Cap rate 6.0% vs local median 3.7% in Oklahoma City — top-decile yield for the area; either an underpriced asset or a hidden risk that comps aren't pricing in. Stress-test before assuming the spread holds.
Location & tenants
- Location reads 80/100 on livability (#3 in OK, #1,635 nationally) — a professional / high-income tenant draw. Strengths: amenities A+, commute A+, cost of living A+; Watch: schools F, crime F.
- Oklahoma City (urban): math 7% / reading 10% proficiency, ranked #254 of 270 in OK (top 94%) — low school quality limits family demand, transient renter base, plan for 1-2y turnover; 82% free/reduced lunch — lower-income household profile, screen leases tightly.
- Market conditions: Rents rising fast (+7.3%/yr); 216 active listings in the ZIP; 40 comparable units currently listed for rent nearby; rentals at typical pace (median 24d on market — plan ~3-4 weeks tenant-placement turnaround); 40% of comp listings sitting > 30 days — soft ceiling on asking rent; 5,365 units permitted in Oklahoma County in 2024 (569 in 5+ unit buildings).
- This rent runs 32% of the median local income ($57k/yr) — at the standard rent-burdened threshold; future hikes will face affordability resistance.
Forward outlook
- Local home prices are declining (-3.0%/yr); year-one equity from $1k of loan paydown is wiped out by about $6k of value loss. Plan a longer hold.
- Oklahoma County population projected at +41% by 2050 — long-run rental-demand tailwind backs the buy-and-hold thesis.
Negotiation context
- It's been on market 37 days — a 3% lower offer ($184k) is reasonable based on typical stale-listing flexibility.
- 22 sale attempts since 5y ago with the ask held roughly flat each time — persistent listings suggest the price (not the market) is what's stuck; bring a comps-based counter.
- Current owner paid $110k; list at $190k implies a 73% gain — meaningful room to come down on a strong offer.
Risks & watch-outs
- Watch-outs: built in 1920 — expect roof / HVAC / electrical / plumbing capex.
- Climate carrying-cost: extreme-heat days projected 7→19/yr by 2055 (HVAC capex compounding) — expect insurance premiums to compound above CPI over the hold.
Questions for the listing agent
- What do current leases actually rent for vs. the listed asking? Can we see a recent rent roll and the last 12 months of T-12 income?
- It's been on market 37 days. Have you received any prior offers? Is the seller open to a 21% concession, seller financing, or rate buy-down credit?
- Built in 1920 — when were the roof, HVAC, electrical panel, plumbing, and water heater last replaced?
- Is there a deadline driving the sale (1031 exchange, divorce, estate, relocation)? That informs how much negotiation room exists.
- Schools are F-rated, which usually means shorter tenancies and higher turnover. Who's the typical renter profile here, and what's been the actual vacancy rate?
- Crime grade is F in this area — have there been break-ins, vandalism, or insurance claims at this property in the last 3 years? What carrier currently insures it and at what premium?
- The area grade is low — what's the realistic commute time and amenity access for the typical tenant pool here? Any planned neighborhood developments (good or bad) we should know about?
- What's the average days-on-market for RENTAL listings here right now (not sales)? A rising rental-DOM trend means longer vacancies and softer asking-rent achievability than the comps imply.
- What's the recent tenant-quality profile in this submarket — average credit score on applications, eviction rate, late-payment / NSF rate, and stable-employment percentage? A property-management company in the area should have these aggregated.
- How much new for-sale + rental construction is in the pipeline within 1–3 miles? Heavy new supply typically softens prices + rents 12–24 months out; constrained supply supports both.
Investment metrics
- 1% rule
- 0.79% ✗
- Cap rate
- 5.99%
- Cash-on-cash
- -1.10%
- DSCR
- 0.95
- GRM
- 10.5
CMA / ARV
- ARV (median comp)
- $215,215
- List price
- $189,900
- Delta
- -11.76%
- Verdict
- UNDERPRICED
- Comps
- 20 within 1.0 mi
Show comp detail 12 sales within ~0.75 mi
| Address | Dist | Beds/Ba | Sqft | Sold | Price | $/sf | Match |
|---|---|---|---|---|---|---|---|
| 2443 NW 12th St | 0.26mi | 3/1.0 | 1,425 (+5%) | 1mo | $115,000 | $81 | 78 |
| 2408 NW 19th St | 0.57mi | 2/1.0 (-1) | 1,340 (-1%) | 2mo | $190,000 | $142 | 65 |
| 2225 NW 13th St | 0.15mi | 3/1.5 | 1,170 (-14%) | 4mo | $105,000 | $90 | 65 |
| 2625 NW 15th St | 0.54mi | 2/1.0 (-1) | 1,327 (-2%) | 5mo | $223,600 | $169 | 62 |
| 2629 NW 15th St | 0.54mi | 2/1.0 (-1) | 1,290 (-5%) | 4mo | $249,000 | $193 | 58 |
| 2508 NW 13th St | 0.31mi | 2/1.0 (-1) | 1,197 (-12%) | 4mo | $200,000 | $167 | 58 |
| 2817 NW 12th St | 0.70mi | 3/2.0 | 1,308 (-4%) | 4mo | $175,000 | $134 | 54 |
| 2620 NW 11th St | 0.44mi | 3/3.0 | 1,505 (+11%) | 2mo | $284,900 | $189 | 52 |
| 2609 NW 14th St | 0.47mi | 2/1.0 (-1) | 1,522 (+12%) | 2mo | $136,000 | $89 | 51 |
| 1809 NW 9th St | 0.62mi | 2/2.0 (-1) | 1,289 (-5%) | 4mo | $130,000 | $101 | 50 |
| 2012 NW 20th St | 0.70mi | 2/1.0 (-1) | 1,467 (+8%) | 2mo | $334,000 | $228 | 48 |
| 2634 NW 11th St | 0.48mi | 2/1.0 (-1) | 1,161 (-14%) | 3mo | $175,000 | $151 | 46 |
Match score weights: distance 35% · size 25% · config 20% · recency 20%. Top-matched comps best support the ARV.
Projected returns pro-forma
-3.0% appreciation · 7.29% rent growth · sell at horizon
- IRR
- -13.7%
- Equity multiple
- 0.49×
- Total profit
- $-27,129
- Equity at exit
- $28,315
- IRR
- 0.6%
- Equity multiple
- 1.05×
- Total profit
- $2,630
- Equity at exit
- $16,419
Cash invested: $53,172 (down + closing). Projections, not guarantees.
Landlord ↔ Tenant lean methodology
- Overall (STATE)
- 83 Strongly Landlord-Friendly
- State Oklahoma
- 83 Strongly Landlord-Friendly · R+20
- County
- — inherits STATE
- City
- — inherits STATE
ZIP-level market 73107
- Rents YoY
- 7.3%
- Active inventory
- 216
- Price-to-rent
- 10.5×
Monthly cashflow live
- Estimated rent
- $1,503 high interval (Pro) →
- Mortgage (P&I)
- −$996
- Tax from tax record
- −$161 /mo · $1,933/yr
- Insurance
- −$79
- HOA
- −$0
- Vacancy / Maint / Mgmt
- −$316
- Net cashflow
- $-49
Break-even live
UW: 25.0% down · 7.5% · 30yr · 1.5% tax · 5.0% vac · 8.0% maint · 8.0% mgmt
Financing live
Cash to close
- Down payment
- $47,475
- Closing costs
- $5,697
- Reserves months
- —
- Total cash needed
- —
Loan-product check · same deal, 3 products live
Conventional
25% down · 7.5% · 30yr
- Down + closing
- —
- Monthly P&I
- —
- Monthly cashflow
- —
- DSCR
- —
- Eligible?
- —
Personal DTI + credit; lowest rate.
DSCR
20% down · 8.5% · 30yr
- Down + closing
- —
- Monthly P&I
- —
- Monthly cashflow
- —
- DSCR
- —
- Eligible?
- —
No personal income docs; deal must DSCR.
Hard money
10% down · 12.0% · 12mo
- Down + closing
- —
- Monthly P&I
- —
- Monthly cashflow
- —
- DSCR
- —
- Eligible?
- —
Short-term bridge; refi at stabilization.
Rent comps 40 comps
| Address | Beds | Baths | Sqft | Rent | $/sqft | DOM | Units | Dist |
|---|---|---|---|---|---|---|---|---|
| 2139 NW 15th St Oklahoma City, OK | 3.0 | 2.0 | 1551 | $1,950 | $1.26 | 43d | 1 | 0.32mi |
| 2525 NW 11th St Oklahoma City, OK | 3.0 | 2.0 | 1415 | $1,550 | $1.10 | 43d | 1 | 0.33mi |
| 1951 NW 11th St Oklahoma City, OK | 4.0 | 3.0 | 1613 | $2,100 | $1.30 | 23d | 1 | 0.36mi |
| 2001 NW 13th St Oklahoma City, OK | 4.0 | 2.5 | 1800 | $2,500 | $1.39 | 23d | 1 | 0.36mi |
| 1945 W Park Pl Oklahoma City, OK | 2.0 | 1.0 | 912 | $1,215 | $1.33 | 3d | 1 | 0.38mi |
| 2004 NW 15th St Oklahoma City, OK | 2.0 | 1.0 | 982 | $975 | $0.99 | 43d | 1 | 0.41mi |
| 1403 N Miller Blvd Oklahoma City, OK | 2.0 | 1.0 | 1200 | $1,100 | $0.92 | 4d | 1 | 0.57mi |
| 2801 NW 11th St Oklahoma City, OK | 2.0 | 1.0 | 1100 | $1,150 | $1.05 | 14d | 1 | 0.65mi |
| 2236 NW 22nd St Oklahoma City, OK | 2.0 | 1.0 | 1200 | $950 | $0.79 | 21d | 1 | 0.74mi |
| 1138 N Blackwelder Ave Unit 3 Oklahoma City, OK | 2.0 | 2.0 | 1250 | $1,599 | $1.28 | 11d | 1 | 0.76mi |
| 1824 Carey Pl Unit 1 Oklahoma City, OK | 2.0 | 1.0 | 1024 | $1,400 | $1.37 | 4d | 1 | 0.80mi |
| 1805 N Gatewood Ave Oklahoma City, OK | 2.0 | 1.0 | 1200 | $1,600 | $1.33 | 2d | 1 | 0.81mi |
| 1831 N Gatewood Ave Unit 1831 Oklahoma City, OK | 2.0 | 1.0 | 1000 | $1,250 | $1.25 | 43d | 1 | 0.83mi |
| 1831 N Gatewood Ave Unit 1833 Oklahoma City, OK | 2.0 | 1.0 | 1000 | $1,225 | $1.23 | 21d | 1 | 0.83mi |
| 1625 NW 16th St Unit 2 Oklahoma City, OK | 2.0 | 2.0 | 1136 | $1,850 | $1.63 | 43d | 1 | 0.87mi |
| 1628 NW 17th St Unit 1 Oklahoma City, OK | 2.0 | 1.0 | 1125 | $1,450 | $1.29 | 43d | 1 | 0.87mi |
| 1630 NW 17th St Unit 2 Oklahoma City, OK | 2.0 | 1.0 | 1125 | $1,400 | $1.24 | 43d | 1 | 0.88mi |
| 1608 NW 7th St Oklahoma City, OK | 3.0 | 1.5 | 1028 | $1,400 | $1.36 | 11d | 1 | 0.88mi |
| 2820 General Pershing Blvd Oklahoma City, OK | 1.0–3.0 | 1.0–2.0 | 951 | $1,357 | $1.43 | 2d | 39 | 0.89mi |
| 2748 NW 22nd St Oklahoma City, OK | 2.0 | 1.0 | 1066 | $1,500 | $1.41 | 2d | 1 | 0.93mi |
| 3021 NW 13th St Oklahoma City, OK | 3.0 | 1.0 | 1072 | $995 | $0.93 | 23d | 1 | 0.95mi |
| 3024 NW 14th St Oklahoma City, OK | 2.0 | 1.0 | 924 | $895 | $0.97 | 16d | 1 | 0.98mi |
| 1514 NW 18th St Oklahoma City, OK | 2.0 | 1.0 | 1025 | $1,225 | $1.20 | 4d | 1 | 1.00mi |
| 1514 NW 18th St Oklahoma City, OK | 2.0 | 1.0 | 1025 | $1,225 | $1.20 | 23d | 1 | 1.00mi |
| 2605 NW 24th St Oklahoma City, OK | 2.0 | 1.0 | 1300 | $1,525 | $1.17 | 2d | 1 | 1.00mi |
| 1414 N Drexel Blvd Oklahoma City, OK | 2.0 | 1.0 | 1604 | $1,100 | $0.69 | 2d | 1 | 1.02mi |
| 2301 N Florida Ave Oklahoma City, OK | 2.0 | 1.5 | 1700 | $1,235 | $0.73 | 17d | 1 | 1.03mi |
| 1211 N Ellison Ave Oklahoma City, OK | 4.0 | 2.0 | 1526 | $1,800 | $1.18 | 43d | 1 | 1.04mi |
| 2935 NW 20th St Oklahoma City, OK | 4.0 | 2.0 | 1622 | $1,175 | $0.72 | 43d | 1 | 1.08mi |
| 2024 NW 26th St Oklahoma City, OK | 2.0 | 1.0 | 947 | $1,099 | $1.16 | 43d | 1 | 1.08mi |
| 1215 NW 13th St Oklahoma City, OK | 3.0 | 1.0 | 1368 | $2,200 | $1.61 | 43d | 1 | 1.09mi |
| 3003 NW 20th St Oklahoma City, OK | 2.0 | 1.0 | 909 | $999 | $1.10 | 43d | 1 | 1.10mi |
| 1209 NW 11th St Oklahoma City, OK | 2.0 | 2.5 | 1400 | $1,795 | $1.28 | 17d | 1 | 1.10mi |
| 1209 NW 11th St Oklahoma City, OK | 2.0 | 2.5 | 1400 | $1,795 | $1.28 | 4d | 1 | 1.10mi |
| 2504 NW 27th St Oklahoma City, OK | 2.0 | 1.0 | 1303 | $1,450 | $1.11 | 43d | 1 | 1.11mi |
| 2808 NW 24th St Unit A Oklahoma City, OK | 3.0 | 1.5 | 1604 | $1,595 | $0.99 | 3d | 1 | 1.11mi |
| 1322 NW 17th St Unit B Oklahoma City, OK | 2.0 | 1.0 | 1294 | $1,200 | $0.93 | 44d | 1 | 1.12mi |
| 1215 NW 8th St Oklahoma City, OK | 2.0 | 1.0 | 972 | $1,350 | $1.39 | 2d | 1 | 1.12mi |
| 2112 N Drexel Blvd Oklahoma City, OK | 4.0 | 2.0 | 1443 | $1,695 | $1.17 | 43d | 1 | 1.19mi |
| 1219 NW 18th St Unit 1219 1/2 Oklahoma City, OK | 2.0 | 1.0 | 1200 | $1,400 | $1.17 | 43d | 1 | 1.22mi |
Listing history 41 events
-
2026-06-03days on market $189,900 Active 37 DOM
-
2026-06-02days on market $189,900 Active 36 DOM
-
2026-05-18status Active 416-char remark
Show marketing remark (416 chars)
"Prime opportunity in Youngs-Englewood! Solid 3 bed / 2 bath home built in 1920, 1,356 sq ft, ready for your personal touches. Recent comps show great upside in this revitalizing area with easy proximity to downtown OKC, I-40 access, and local amenities. Mature lot with room for outdoor enjoyment and classic curb appeal. Whether you're starting out or adding to your portfolio, this gem won't last long!"
-
2026-05-12status Active 416-char remark
Show marketing remark (416 chars)
"Prime opportunity in Youngs-Englewood! Solid 3 bed / 2 bath home built in 1920, 1,356 sq ft, ready for your personal touches. Recent comps show great upside in this revitalizing area with easy proximity to downtown OKC, I-40 access, and local amenities. Mature lot with room for outdoor enjoyment and classic curb appeal. Whether you're starting out or adding to your portfolio, this gem won't last long!"
-
2026-04-27status Active 416-char remark
Show marketing remark (416 chars)
"Prime opportunity in Youngs-Englewood! Solid 3 bed / 2 bath home built in 1920, 1,356 sq ft, ready for your personal touches. Recent comps show great upside in this revitalizing area with easy proximity to downtown OKC, I-40 access, and local amenities. Mature lot with room for outdoor enjoyment and classic curb appeal. Whether you're starting out or adding to your portfolio, this gem won't last long!"
-
2026-04-20status Active 416-char remark
Show marketing remark (416 chars)
"Prime opportunity in Youngs-Englewood! Solid 3 bed / 2 bath home built in 1920, 1,356 sq ft, ready for your personal touches. Recent comps show great upside in this revitalizing area with easy proximity to downtown OKC, I-40 access, and local amenities. Mature lot with room for outdoor enjoyment and classic curb appeal. Whether you're starting out or adding to your portfolio, this gem won't last long!"
-
2026-04-13status Active 416-char remark
Show marketing remark (416 chars)
"Prime opportunity in Youngs-Englewood! Solid 3 bed / 2 bath home built in 1920, 1,356 sq ft, ready for your personal touches. Recent comps show great upside in this revitalizing area with easy proximity to downtown OKC, I-40 access, and local amenities. Mature lot with room for outdoor enjoyment and classic curb appeal. Whether you're starting out or adding to your portfolio, this gem won't last long!"
-
2026-04-08status Active 416-char remark
Show marketing remark (416 chars)
"Prime opportunity in Youngs-Englewood! Solid 3 bed / 2 bath home built in 1920, 1,356 sq ft, ready for your personal touches. Recent comps show great upside in this revitalizing area with easy proximity to downtown OKC, I-40 access, and local amenities. Mature lot with room for outdoor enjoyment and classic curb appeal. Whether you're starting out or adding to your portfolio, this gem won't last long!"
-
2026-04-01status Active 416-char remark
Show marketing remark (416 chars)
"Prime opportunity in Youngs-Englewood! Solid 3 bed / 2 bath home built in 1920, 1,356 sq ft, ready for your personal touches. Recent comps show great upside in this revitalizing area with easy proximity to downtown OKC, I-40 access, and local amenities. Mature lot with room for outdoor enjoyment and classic curb appeal. Whether you're starting out or adding to your portfolio, this gem won't last long!"
-
2026-03-02status Active 416-char remark
Show marketing remark (416 chars)
"Prime opportunity in Youngs-Englewood! Solid 3 bed / 2 bath home built in 1920, 1,356 sq ft, ready for your personal touches. Recent comps show great upside in this revitalizing area with easy proximity to downtown OKC, I-40 access, and local amenities. Mature lot with room for outdoor enjoyment and classic curb appeal. Whether you're starting out or adding to your portfolio, this gem won't last long!"
-
2026-02-23$189,900 Active 416-char remark
Show marketing remark (416 chars)
"Prime opportunity in Youngs-Englewood! Solid 3 bed / 2 bath home built in 1920, 1,356 sq ft, ready for your personal touches. Recent comps show great upside in this revitalizing area with easy proximity to downtown OKC, I-40 access, and local amenities. Mature lot with room for outdoor enjoyment and classic curb appeal. Whether you're starting out or adding to your portfolio, this gem won't last long!"
-
2025-06-03historical
-
2025-05-27price $179,900
-
2025-05-24status Active
-
2025-04-30status Active
-
2025-04-29status Active
-
2025-04-29historical
-
2025-04-26$149,900 Active
-
2025-03-05price $174,900
-
2025-01-28status Active
-
2025-01-22$179,900 Active
-
2025-01-22historical
-
2024-12-03price $189,900
-
2024-11-15price $193,900
-
2024-10-01status Active
-
2024-10-01historical
-
2024-08-08price $199,800
-
2024-07-27price $204,800
-
2024-07-11$219,800 Active
-
2021-06-04soldstatus $110,000
-
2021-04-13historical
-
2021-04-13status Active
-
2021-04-07historical
-
2021-04-07status Active
-
2021-04-05historical
-
2021-04-03status Active
-
2021-03-03historical
-
2021-03-03status Active
-
2021-01-18historical
-
2021-01-05$132,888 Active
-
1981-07-01soldstatus $11,500
ⓘ Source: listings_history table (triggers on properties + properties_extension) + one-shot
backfill from property_details.listing_events for pre-trigger history.
Tax reassessment forecast OK · Resets to sale price
- Current annual tax
- $1,933 · $161/mo
- Projected year-2 tax
- $1,933 · $161/mo
- Expected delta
- $0/yr ($0/mo · -0.0%)
ⓘ Screening estimate from a state-policy table — verify with the county assessor before closing.
Climate risk First Street
- Flood 1/10 Low FEMA zone X (unshaded) · 0% chance over 30 yrs
- Wildfire 1/10 Low
- Heat 6/10 Major 7 d/yr ≥107°F today · 19 d/yr by 30 yrs out
- Wind 2/10 Low 3% chance of damaging wind over 30 yrs
- Air quality 2/10 Low 1 unhealthy d/yr today · 2 by 30 yrs out
Nearby sold comps map
Loading sold comps map…
Walkable amenities ~0.75 mi
Loading nearby amenities…
Taxation est. · year 1
- Rental income
- $18,036
- − Mortgage interest
- −$10,637
- − Property taxes
- −$1,933
- − Insurance
- −$950
- − Repairs & maintenance
- −$1,443
- − Management
- −$1,443
- − Depreciation
- −$5,524
- Taxable loss
- −$3,894
- Est. tax savings @ 24.0%
- +$935
- After-tax cash flow
- $350/yr
For passive investors: Depreciation is non-cash, so a rental often shows a tax loss while cash-flowing — sheltering income. Rental losses are passive: they offset passive income freely, and up to $25,000/yr can offset ordinary (W-2) income if you actively participate and your MAGI is under $100k (phasing out to $0 by $150k); unused losses carry forward. On sale, claimed depreciation is recaptured at up to 25%, and gains may owe capital-gains tax (a 1031 exchange can defer both). Figures are a year-1 estimate at your 24.0% rate — not tax advice; consult a CPA.
Schools (NCES district)
- District
- Oklahoma City
- NCES district ID
- 4022770
- Math proficiency
- 7% ▼ -5.00%
- Reading proficiency
- 10% ▼ -6.00%
- Median HH income
- $35,606
- Composite
- 7.0/100
- National rank
- #9970
- State rank
- #254 of 270 in OK
Livability — Oklahoma City
- Score
- 80/100
- State rank
- #3
- US rank
- #1635
Category grades
Schools grade is shown separately in the Schools card above.
Census & demographics
- Census place
- Oklahoma City, OK
- County
- Oklahoma County · 771,644 people
- City population
- 498,656
- Metro
- Oklahoma City, OK
- Population (ZIP)
- 25,791
- Household income
- $56,873
- Rent vs Own
- Severe rent burden
- 1210.0
Population outlook (Oklahoma County) Hauer SSP2
- Today (2025)
- 911,875 people
- By 2030
- 982,413 · +7.7%
- By 2040
- 1,130,468 · +24.0%
- By 2050
- 1,288,422 · +41.3%
- By 2075
- 1,711,482 · +87.7%
- By 2100
- 2,088,448 · +129.0%
Race, ethnicity, and origin ACS 2023
- Neighborhood character
- Diverse neighborhood (Simpson 0.64)
- Race & ethnicity
- White 47% Hispanic / Latino 37% Two or more races 13% Native American 6% Black 5% Asian 2%
- Hispanic origin (detail)
- Mexican 22%
- Common ancestry
- Lithuanian 1% Italian 1% Slovak 1%
- Foreign-born
- 19% · Canada, Vietnam
- Languages at home
- 67% English-only · Spanish 30% Vietnamese 1%
Political lean MEDSL · Oklahoma
- 2024 margin
- Toss-up / Even · D 48.0% · R 49.7% · Other 2.3%
- 2008→2024 swing
- +15.1pp toward D · 2008: -16.8pp · 2024: -1.7pp
- All cycles
- 2024: R+1.7 2020: R+1.1 2016: R+10.5 2012: R+16.7 2008: R+16.8
Not yet ingested
- Civics
- —
Market trends
- HPI YoY
- ▼ -245.03%
- Current HPI
- 274.7844
- Rent YoY
- ▲ 7.29%
- Metro
- Oklahoma City, OK
- State GDP YoY
- ▲ 1.55%
- F500 in state
- 6
Industry mix (Fortune 500 HQ in OK)
| Industry | F500 HQs | Revenue |
|---|---|---|
| Energy | 3 | $48B |
|
||
Price history
+1551.3% since first listed39 events — show timeline
- 2026-05-18 Relisted — MLSOK
- 2026-05-12 Relisted — MLSOK
- 2026-04-27 Relisted — MLSOK
- 2026-04-20 Relisted — MLSOK
- 2026-04-13 Relisted — MLSOK
- 2026-04-08 Relisted — MLSOK
- 2026-04-01 Relisted — MLSOK
- 2026-03-02 Relisted — MLSOK
- 2026-02-23 Listed $189,900 MLSOK
- 2025-06-03 Listing Removed — MLSOK
- 2025-05-27 Price Changed $179,900 MLSOK
- 2025-05-24 Relisted — MLSOK
- 2025-04-30 Relisted — MLSOK
- 2025-04-29 Relisted — MLSOK
- 2025-04-29 Listing Removed — MLSOK
- 2025-04-26 Listed $149,900 MLSOK
- 2025-03-05 Price Changed $174,900 MLSOK
- 2025-01-28 Relisted — MLSOK
- 2025-01-22 Listing Removed — MLSOK
- 2025-01-22 Listed $179,900 MLSOK
- 2024-12-03 Price Changed $189,900 MLSOK
- 2024-11-15 Price Changed $193,900 MLSOK
- 2024-10-01 Relisted — MLSOK
- 2024-10-01 Listing Removed — MLSOK
- 2024-08-08 Price Changed $199,800 MLSOK
- 2024-07-27 Price Changed $204,800 MLSOK
- 2024-07-11 Listed $219,800 MLSOK
- 2021-06-04 Sold (Public Records) $110,000 Public Records
- 2021-04-13 Listing Removed — MLSOK
- 2021-04-13 Relisted — MLSOK
- 2021-04-07 Listing Removed — MLSOK
- 2021-04-07 Relisted — MLSOK
- 2021-04-05 Listing Removed — MLSOK
- 2021-04-03 Relisted — MLSOK
- 2021-03-03 Listing Removed — MLSOK
- 2021-03-03 Relisted — MLSOK
- 2021-01-18 Listing Removed — MLSOK
- 2021-01-05 Listed $132,888 MLSOK
- 1981-07-01 Sold (Public Records) $11,500 Public Records
Property tax history
+8.8%/yrLatest (2025): $1,933 · +4.2% YoY. Source: county tax records.
Cash-flow waterfall
monthlySold comps — $/sqft
last 12 mo · ≤1 miLoading sold comps…