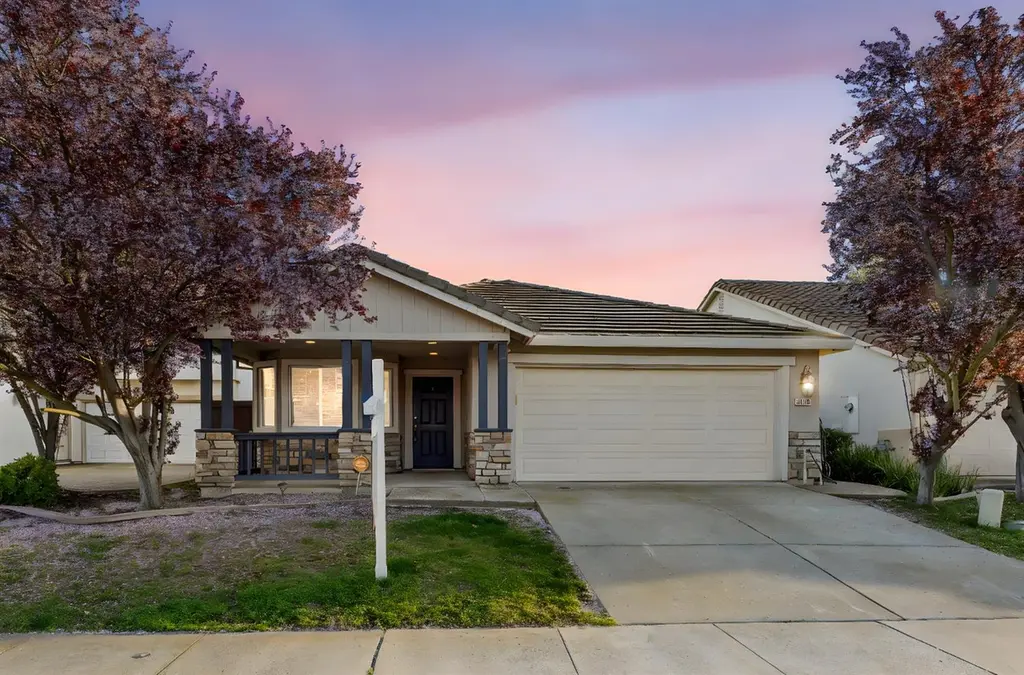
4866 Alterra Way · Sacramento, CA
Flood risk 4/10 · Minor
- FEMA flood zone
- A99
- Chance of flooding over 30 yrs
- 0.22%
- Est. flood insurance / yr
- $1,009 – $1,996
Fire risk 7/10 · Major
- Est. fire insurance / yr
- $659 – $1,223
Heat risk 7/10 · Major
- Hot days now (above 102°F)
- 7 days/yr
- Hot days in 30 yrs
- 14 days/yr
Wind risk 1/10 · Minimal
- Chance of severe wind over 30 yrs
- —
Air-quality risk 10/10 · Severe
- Unhealthy air days now
- 29 days/yr
- Unhealthy air days in 30 yrs
- 33 days/yr
Risk factors via First Street. Map © Google.
Why this score? — see what drove the D- grade
The composite is a weighted blend of 9 inputs, each scored 0–100. Each bar is that input's sub-score; the figure is the points it added to the 100-point composite (weight × sub-score).
- ARV discount +12.8/15.0
- Appreciation +9.6/10.0
- Schools +4.1/10.0
- Livability +3.6/5.0
- Cash flow +3.5/30.0
- Rent growth +2.9/5.0
- Condition / age +2.5/5.0
- 1% rule +0.1/10.0
- DSCR +0.0/10.0
$499,000
🖨 Deal sheet 📄 Offer letter ✓ Due diligence
Listing remarks
Welcome to 4866 Alterra Way, Sacramento, CA 95835! This charming single-story home is located in the highly desirable North Natomas community. It features 3 bedrooms and 2 full bathrooms with a bright and open floor plan designed for comfortable living. The spacious living area offers plenty of natural light and includes a cozy fireplace, creating a warm and inviting atmosphere. The primary suite includes a walk-in closet and a private bathroom with dual sinks and a soaking tub. Enjoy the low-maintenance backyard, ideal for relaxing or outdoor gatherings. Additional highlights include central heat and air, an attached 2-car garage, and a convenient location close to parks, schools, shoppin
Key facts
- Dual sinks
- Walk-in closet
- Soaking tub
Tags
Neighborhood map
What this means for you Summary
Snapshot
- This is a 2-bed/2.0-bath single-family listed at $499k.
Deal economics
- At list price, monthly cash flow is $-2k ($-20k/yr) — negative.
- To cash-flow at today's rent, offer at most $210k (57.8% below list).
- To meet the 1% rule (rent ≥ 1% of price), the offer needs to be $255k (49.0% below list).
- Recommended offer: $210k (57.8% below list) — sets the bar for cash-flow.
Location & tenants
- Location reads 71/100 on livability (#218 in CA) — a middle-class / working-renter tenant base. Strengths: amenities A+, commute A+, housing A; Watch: schools D+, crime F, cost of living F.
- Natomas Unified (urban): math 33% / reading 60% proficiency, ranked #155 of 517 in CA (top 30%) — families likely to look elsewhere, expect single-tenant / working-renter base with shorter leases.
- Market conditions: Rents rising (+1.4%/yr); 402 active listings in the ZIP; 16 comparable units currently listed for rent nearby; rentals leasing fast (median 4d on market — plan ~1-2 weeks tenant-placement turnaround); high-income renter base; 6,825 units permitted in Sacramento County in 2024 (1,752 in 5+ unit buildings).
Forward outlook
- In year one you build about $49k of equity ($3k loan paydown + $46k appreciation (9.2% local appreciation)).
- Sacramento County population projected at +17% by 2050 — long-run rental-demand tailwind backs the buy-and-hold thesis.
- By year 2, paydown + projected appreciation supports a ~$79k cash-out refi (75% LTV) — recoverable capital for the next deal without selling this one.
Negotiation context
- It's been on market 220 days — a 12% lower offer ($439k) is reasonable based on typical stale-listing flexibility.
Risks & watch-outs
- Watch-outs: flood insurance adds $125/mo.
- Climate carrying-cost: in FEMA flood zone A99 (mandatory federal flood insurance); major wildfire risk; extreme-heat days projected 7→14/yr by 2055 (HVAC capex compounding) — expect insurance premiums to compound above CPI over the hold.
Questions for the listing agent
- What do current leases actually rent for vs. the listed asking? Can we see a recent rent roll and the last 12 months of T-12 income?
- It's been on market 220 days. Have you received any prior offers? Is the seller open to a 58% concession, seller financing, or rate buy-down credit?
- What's the actual annual flood-insurance premium (NFIP or private), and is the property in a SFHA with mandatory coverage?
- What does the HOA fee cover, when was the last increase, and are there any pending special assessments or reserve-fund shortfalls?
- Why hasn't it sold? Are there any deal-killer items the seller is aware of (foundation, flood, title, zoning, code violations)?
- Is there a deadline driving the sale (1031 exchange, divorce, estate, relocation)? That informs how much negotiation room exists.
- Schools are D-rated, which usually means shorter tenancies and higher turnover. Who's the typical renter profile here, and what's been the actual vacancy rate?
- Crime grade is F in this area — have there been break-ins, vandalism, or insurance claims at this property in the last 3 years? What carrier currently insures it and at what premium?
- The area grade is low — what's the realistic commute time and amenity access for the typical tenant pool here? Any planned neighborhood developments (good or bad) we should know about?
- What's the average days-on-market for RENTAL listings here right now (not sales)? A rising rental-DOM trend means longer vacancies and softer asking-rent achievability than the comps imply.
- What's the recent tenant-quality profile in this submarket — average credit score on applications, eviction rate, late-payment / NSF rate, and stable-employment percentage? A property-management company in the area should have these aggregated.
- How much new for-sale + rental construction is in the pipeline within 1–3 miles? Heavy new supply typically softens prices + rents 12–24 months out; constrained supply supports both.
Investment metrics
- 1% rule
- 0.51% ✗
- Cap rate
- 2.67%
- Cash-on-cash
- -12.95%
- DSCR
- 0.42
- GRM
- 16.3
CMA / ARV
- ARV (median comp)
- $565,654
- List price
- $499,000
- Delta
- -11.78%
- Verdict
- UNDERPRICED
- Comps
- 20 within 1.0 mi
Show comp detail 12 sales within ~0.75 mi
| Address | Dist | Beds/Ba | Sqft | Sold | Price | $/sf | Match |
|---|---|---|---|---|---|---|---|
| 4950 Alterra Way | 0.10mi | 3/2.0 (+1) | 1,475 (0%) | 2mo | $490,000 | $332 | 89 |
| 180 Connor Cir | 0.39mi | 3/2.0 (+1) | 1,484 (+1%) | 15mo | $530,000 | $357 | 64 |
| 1818 N Bend Dr | 0.40mi | 3/2.0 (+1) | 1,628 (+10%) | 2mo | $550,000 | $338 | 58 |
| 1872 Ivycrest Way | 0.56mi | 3/2.0 (+1) | 1,334 (-10%) | 2mo | $510,000 | $382 | 52 |
| 1707 Danbrook Dr | 0.35mi | 3/2.0 (+1) | 1,645 (+12%) | 11mo | $565,000 | $343 | 50 |
| 5330 Alvoca Way | 0.64mi | 3/2.0 (+1) | 1,353 (-8%) | 5mo | $449,950 | $333 | 47 |
| 4520 Juneberry Dr | 0.64mi | 3/2.5 (+1) | 1,559 (+6%) | 9mo | $480,000 | $308 | 46 |
| 1463 Dreamy Way | 0.68mi | 3/2.0 (+1) | 1,507 (+2%) | 17mo | $519,000 | $344 | 45 |
| 4544 Juneberry Dr | 0.61mi | 3/2.5 (+1) | 1,547 (+5%) | 17mo | $501,375 | $324 | 42 |
| 2079 Moonstone Ave | 0.59mi | 3/2.5 (+1) | 1,603 (+9%) | 13mo | $535,000 | $334 | 40 |
| 811 Regency Park Cir | 0.58mi | 3/2.0 (+1) | 1,682 (+14%) | 11mo | $530,000 | $315 | 36 |
| 5376 Nickman Way | 0.71mi | 3/2.5 (+1) | 1,685 (+14%) | 1mo | $499,000 | $296 | 35 |
Match score weights: distance 35% · size 25% · config 20% · recency 20%. Top-matched comps best support the ARV.
Projected returns pro-forma
9.18% appreciation · 1.43% rent growth · sell at horizon
- IRR
- 12.2%
- Equity multiple
- 1.98×
- Total profit
- $136,321
- Equity at exit
- $420,166
- IRR
- 12.5%
- Equity multiple
- 4.36×
- Total profit
- $470,042
- Equity at exit
- $876,567
Cash invested: $139,720 (down + closing). Projections, not guarantees.
Landlord ↔ Tenant lean methodology
- Overall (STATE)
- 18 Strongly Tenant-Friendly
- State California
- 18 Strongly Tenant-Friendly · D+13
- County
- — inherits STATE
- City
- — inherits STATE
ZIP-level market 95835
- Home prices YoY
- 3.5%
- Rents YoY
- 1.4%
- Active inventory
- 402
- Price-to-rent
- 16.3×
Monthly cashflow live
- Estimated rent
- $2,546 high interval (Pro) →
- Mortgage (P&I)
- −$2,617
- Tax from tax record
- −$604 /mo · $7,244/yr
- Insurance
- −$208
- Flood insurance flood zone
- −$125 /mo · $1,502/yr
- HOA
- −$91
- Vacancy / Maint / Mgmt
- −$535
- Net cashflow
- $-1,633
Break-even live
UW: 25.0% down · 7.5% · 30yr · 1.5% tax · 5.0% vac · 8.0% maint · 8.0% mgmt
Financing live
Cash to close
- Down payment
- $124,750
- Closing costs
- $14,970
- Reserves months
- —
- Total cash needed
- —
Loan-product check · same deal, 3 products live
Conventional
25% down · 7.5% · 30yr
- Down + closing
- —
- Monthly P&I
- —
- Monthly cashflow
- —
- DSCR
- —
- Eligible?
- —
Personal DTI + credit; lowest rate.
DSCR
20% down · 8.5% · 30yr
- Down + closing
- —
- Monthly P&I
- —
- Monthly cashflow
- —
- DSCR
- —
- Eligible?
- —
No personal income docs; deal must DSCR.
Hard money
10% down · 12.0% · 12mo
- Down + closing
- —
- Monthly P&I
- —
- Monthly cashflow
- —
- DSCR
- —
- Eligible?
- —
Short-term bridge; refi at stabilization.
Rent comps 16 comps
| Address | Beds | Baths | Sqft | Rent | $/sqft | DOM | Units | Dist |
|---|---|---|---|---|---|---|---|---|
| 4601 Blackrock Dr Sacramento, CA | 1.0–2.0 | 1.0–2.0 | 940 | $2,528 | $2.69 | 1d | 7 | 0.39mi |
| 1926 Ivycrest Way Sacramento, CA | 3.0 | 2.0 | 1630 | $2,695 | $1.65 | 43d | 1 | 0.56mi |
| 1850 Club Center Dr Sacramento, CA | 1.0–3.0 | 1.0–2.0 | 985 | $2,124 | $2.16 | 1d | 9 | 0.65mi |
| 1900 Danbrook Dr Sacramento, CA | 1.0 | 1.0 | 1015 | $2,048 | $2.02 | 4d | 2 | 0.66mi |
| 1900 Danbrook Dr Sacramento, CA | 1.0 | 1.0 | 873 | $1,772 | $2.03 | 43d | 2 | 0.66mi |
| 1445 Dreamy Way Sacramento, CA | 3.0 | 2.0 | 1507 | $2,695 | $1.79 | 1d | 1 | 0.71mi |
| 50 Regency Park Cir #9106 Sacramento, CA | 3.0 | 3.0 | 1384 | $2,495 | $1.80 | 43d | 1 | 0.72mi |
| 4850 Natomas Blvd Sacramento, CA | 1.0–2.0 | 1.0–2.0 | 837 | $2,540 | $3.03 | 1d | 17 | 0.76mi |
| 1816 Golden Willow Ave Sacramento, CA | 3.0 | 2.5 | 1845 | $3,000 | $1.63 | 4d | 1 | 0.78mi |
| 2001 Club Center Dr #3110 Sacramento, CA | 2.0 | 2.5 | 1154 | $2,195 | $1.90 | 4d | 1 | 0.87mi |
| 4500 Truxel Rd Sacramento, CA | 1.0–3.0 | 1.0–2.0 | 1000 | $3,246 | $3.25 | 1d | 22 | 0.98mi |
| 4400 Truxel Rd Sacramento, CA | 1.0–3.0 | 1.0–2.0 | 1003 | $2,315 | $2.31 | 1d | 1 | 1.18mi |
| 5350 Dunlay Dr #911 Sacramento, CA | 3.0 | 2.0 | 1519 | $2,750 | $1.81 | 1d | 1 | 1.18mi |
| 5350 Dunlay Dr Sacramento, CA | 2.0–3.0 | 2.0 | 1585 | $2,399 | $1.51 | 17d | 3 | 1.18mi |
| 5350 Dunlay Dr Sacramento, CA | 2.0–3.0 | 2.0 | 1585 | $2,425 | $1.53 | 21d | 2 | 1.18mi |
| 1536 Alicia Way Sacramento, CA | 3.0 | 2.0 | 1397 | $2,700 | $1.93 | 43d | 1 | 1.42mi |
HOA detail
- Monthly dues
- $91 · $1,092/yr
Listing history 18 events
-
2026-06-18days on market $499,000 Active 220 DOM
-
2026-06-17days on market $499,000 Active 219 DOM
-
2026-06-16days on market $499,000 Active 218 DOM
-
2026-06-15days on market $499,000 Active 217 DOM
-
2026-06-13days on market $499,000 Active 215 DOM
-
2026-06-13days on market $499,000 Active 214 DOM
-
2026-06-09days on market $499,000 Active 211 DOM
-
2026-06-08days on market $499,000 Active 210 DOM
-
2026-06-07days on market $499,000 Active 209 DOM
-
2026-06-05days on market $499,000 Active 206 DOM
-
2026-06-03days on market $499,000 Active 205 DOM
-
2026-06-02days on market $499,000 Active 204 DOM
-
2026-06-01days on market $499,000 Active 203 DOM
-
2026-05-31days on market $499,000 Active 202 DOM
-
2022-02-27price $2,395
-
2021-08-27soldstatus $501,000
-
2006-03-23soldstatus $408,000
-
2001-08-06soldstatus $4,850,000
ⓘ Source: listings_history table (triggers on properties + properties_extension) + one-shot
backfill from property_details.listing_events for pre-trigger history.
Tax reassessment forecast CA · Resets to sale price
- Current annual tax
- $7,244 · $604/mo
- Projected year-2 tax
- $7,244 · $604/mo
- Expected delta
- $0/yr ($0/mo · 0.0%)
ⓘ Screening estimate from a state-policy table — verify with the county assessor before closing.
Climate risk First Street
- Flood 4/10 Moderate FEMA zone A99 · 22% chance over 30 yrs
- Wildfire 7/10 Severe
- Heat 7/10 Severe 7 d/yr ≥102°F today · 14 d/yr by 30 yrs out
- Wind 1/10 Low
- Air quality 10/10 Extreme 29 unhealthy d/yr today · 33 by 30 yrs out
Nearby sold comps map
Loading sold comps map…
Walkable amenities ~0.75 mi
Loading nearby amenities…
Taxation est. · year 1
- Rental income
- $30,549
- − Mortgage interest
- −$27,952
- − Property taxes
- −$7,244
- − Insurance
- −$3,998
- − Repairs & maintenance
- −$2,444
- − Management
- −$2,444
- − HOA
- −$1,092
- − Depreciation
- −$14,516
- Taxable loss
- −$29,141
- Est. tax savings @ 24.0%
- +$6,994
- After-tax cash flow
- $-12,608/yr
For passive investors: Depreciation is non-cash, so a rental often shows a tax loss while cash-flowing — sheltering income. Rental losses are passive: they offset passive income freely, and up to $25,000/yr can offset ordinary (W-2) income if you actively participate and your MAGI is under $100k (phasing out to $0 by $150k); unused losses carry forward. On sale, claimed depreciation is recaptured at up to 25%, and gains may owe capital-gains tax (a 1031 exchange can defer both). Figures are a year-1 estimate at your 24.0% rate — not tax advice; consult a CPA.
Schools (NCES district)
- District
- Natomas Unified
- NCES district ID
- 0600036
- Math proficiency
- 33% ▼ -1.00%
- Reading proficiency
- 60% ▲ 13.00%
- Median HH income
- $67,969
- Composite
- 41.49/100
- National rank
- #3457
- State rank
- #155 of 517 in CA
Livability — Sacramento
- Score
- 71/100
- State rank
- #218
- US rank
- #6957
Category grades
Schools grade is shown separately in the Schools card above.
Census & demographics
- Census place
- Sacramento, CA
- County
- Sacramento County · 1,539,646 people
- City population
- 761,410
- Metro
- Sacramento-Roseville-Folsom, CA
- Population (ZIP)
- 42,004
- Household income
- $114,468
- Rent vs Own
- Severe rent burden
- 1234.0
Population outlook (Sacramento County) Hauer SSP2
- Today (2025)
- 1,660,763 people
- By 2030
- 1,732,990 · +4.3%
- By 2040
- 1,855,755 · +11.7%
- By 2050
- 1,941,335 · +16.9%
- By 2075
- 2,046,162 · +23.2%
- By 2100
- 1,961,444 · +18.1%
Race, ethnicity, and origin ACS 2023
- Neighborhood character
- Highly diverse neighborhood (Simpson 0.78)
- Race & ethnicity
- Asian 30% White 29% Hispanic / Latino 19% Two or more races 15% Black 13%
- Hispanic origin (detail)
- Mexican 15%
- Common ancestry
- Scotch-Irish 2% Italian 1% Romanian 1%
- Foreign-born
- 25% · China, Canada, Vietnam
- Languages at home
- 66% English-only · Other Indo-European 10% Spanish 8% Other Asian/Pacific 4%
Political lean MEDSL · Sacramento
- 2024 margin
- D (+19.7) · D 58.1% · R 38.4% · Other 3.5%
- 2008→2024 swing
- +0.7pp no change · 2008: 19.0pp · 2024: 19.7pp
- All cycles
- 2024: D+19.7 2020: D+25.3 2016: D+23.7 2012: D+16.3 2008: D+19.0
Not yet ingested
- Civics
- —
Market trends
- HPI YoY
- ▲ 9.18%
- Current HPI
- 271.4823
- Rent YoY
- ▲ 1.43%
- Metro
- Sacramento-Roseville-Folsom, CA
- State GDP YoY
- ▲ 3.21%
- F500 in state
- 116
Industry mix (Fortune 500 HQ in CA)
| Industry | F500 HQs | Revenue |
|---|---|---|
| Technology | 27 | $1,492B |
|
||
| Financial Services | 3 | $174B |
|
||
| Retail | 3 | $44B |
|
||
| Insurance | 3 | $26B |
|
||
| Media / Entertainment | 2 | $115B |
|
||
| Pharmaceuticals / Biotech | 2 | $62B |
|
||
Price history
-100.0% since first listed4 events — show timeline
- 2022-02-27 Price Changed $2,395 RENT.
- 2021-08-27 Sold (Public Records) $501,000 Public Records
- 2006-03-23 Sold (Public Records) $408,000 Public Records
- 2001-08-06 Sold (Public Records) $4,850,000 Public Records
Property tax history
+2.5%/yrLatest (2025): $7,244 · -3.6% YoY. Source: county tax records.
Cash-flow waterfall
monthlySold comps — $/sqft
last 12 mo · ≤1 miLoading sold comps…