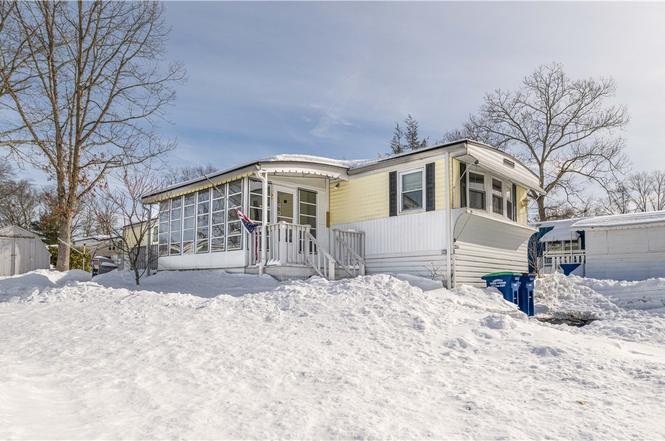
23 Lane B Ln · Coventry, RI
Flood risk 1/10 · Minimal
- FEMA flood zone
- X (unshaded)
- Chance of flooding over 30 yrs
- 0.0%
- Est. flood insurance / yr
- $507 – $1,088
Fire risk 3/10 · Minor
- Est. fire insurance / yr
- $835 – $1,551
Heat risk 5/10 · Moderate
- Hot days now (above 95°F)
- 7 days/yr
- Hot days in 30 yrs
- 16 days/yr
Wind risk 6/10 · Moderate
- Chance of severe wind over 30 yrs
- 70.0%
Air-quality risk 2/10 · Minimal
- Unhealthy air days now
- 2 days/yr
- Unhealthy air days in 30 yrs
- 2 days/yr
Risk factors via First Street. Map © Google.
Why this score? — see what drove the B- grade
The composite is a weighted blend of 9 inputs, each scored 0–100. Each bar is that input's sub-score; the figure is the points it added to the 100-point composite (weight × sub-score).
- Cash flow +30.0/30.0
- 1% rule +10.0/10.0
- DSCR +10.0/10.0
- ARV discount +7.5/15.0
- Schools +3.0/10.0
- Rent growth +2.5/5.0
- Livability +2.5/5.0
- Condition / age +2.5/5.0
- Appreciation +0.0/10.0
$119,900
🖨 Deal sheet 📄 Offer letter ✓ Due diligence
Listing remarks
Check out this 2-bedroom, 1-bath mobile home located in the sought-after Ramblewood Estates community in Coventry. Offering easy single-level living, this home will benefit from some TLC and cosmetic updates. This home is fully equipped with all major appliances and features central air, replacement windows, and a forced hot-air heating system with a newer oil tank for added peace of mind. Enjoy the screened-in porch perfect for relaxing on warm evenings. Situated in a quiet, friendly neighborhood with easy access to shopping, dining, and major highways, this property is in a prime location. Park approval is required. Appraisal report is available. Selling "AS IS" subject to proba
Key facts
- Vinyl siding
- Single-level living
- Central air
Tags
Neighborhood map
What this means for you Summary
Snapshot
- This is a 2-bed/1.0-bath manufactured listed at $120k.
Deal economics
- At list price, monthly cash flow is $487 ($6k/yr) — positive.
- The deal already cash-flows at list — no discount required.
- Meets the 1% rule at list price ($2k rent vs $120k).
- Recommended offer: $116k (3.0% below list) — sets the bar for market timing.
Location & tenants
- Location reads: area grade B — affects rentability + tenant quality, not the cash-flow math above.
- Coventry (suburban): math 25% / reading 41% proficiency, ranked #19 of 39 in RI (top 49%) — families likely to look elsewhere, expect single-tenant / working-renter base with shorter leases.
- Market conditions: 176 active listings in the ZIP; 2 comparable units currently listed for rent nearby; solid renter incomes; 471 units permitted in Kent County in 2024 (240 in 5+ unit buildings).
Forward outlook
- Local home prices are declining (-3.0%/yr); year-one equity from $829 of loan paydown is wiped out by about $4k of value loss. Plan a longer hold.
- Kent County population projected at -14% by 2050 — secular population decline; favor cash flow + early exit over multi-decade hold.
- At projected returns (-3.0% appreciation + 3.0% rent growth), your $34k cash investment doubles in ~7 years — after that, you're playing with house money.
Negotiation context
- It's been on market 52 days — a 3% lower offer ($116k) is reasonable based on typical stale-listing flexibility.
- 6 sale attempts since 26y ago with the ask held roughly flat each time — persistent listings suggest the price (not the market) is what's stuck; bring a comps-based counter.
- Current owner paid $25k; list at $120k implies a 380% gain — meaningful room to come down on a strong offer.
Risks & watch-outs
- Watch-outs: HOA is 21% of rent.
- Climate carrying-cost: major wind risk, 70% chance of damaging wind over 30y; extreme-heat days projected 7→16/yr by 2055 (HVAC capex compounding) — expect insurance premiums to compound above CPI over the hold.
Questions for the listing agent
- It's been on market 52 days. Have you received any prior offers? Is the seller open to a 3% concession, seller financing, or rate buy-down credit?
- Built in 1976 — when were the roof, HVAC, electrical panel, plumbing, and water heater last replaced?
- What does the HOA fee cover, when was the last increase, and are there any pending special assessments or reserve-fund shortfalls?
- Is there a deadline driving the sale (1031 exchange, divorce, estate, relocation)? That informs how much negotiation room exists.
- What's the average days-on-market for RENTAL listings here right now (not sales)? A rising rental-DOM trend means longer vacancies and softer asking-rent achievability than the comps imply.
- What's the recent tenant-quality profile in this submarket — average credit score on applications, eviction rate, late-payment / NSF rate, and stable-employment percentage? A property-management company in the area should have these aggregated.
- How much new for-sale + rental construction is in the pipeline within 1–3 miles? Heavy new supply typically softens prices + rents 12–24 months out; constrained supply supports both.
Investment metrics
- 1% rule
- 1.83% ✓
- Cap rate
- 11.17%
- Cash-on-cash
- 17.41%
- DSCR
- 1.77
- GRM
- 4.6
CMA / ARV
No comps found within radius.
Projected returns pro-forma
-3.0% appreciation · 3.0% rent growth · sell at horizon
- IRR
- 9.0%
- Equity multiple
- 1.35×
- Total profit
- $11,883
- Equity at exit
- $17,877
- IRR
- 18.3%
- Equity multiple
- 2.53×
- Total profit
- $51,472
- Equity at exit
- $10,367
Cash invested: $33,572 (down + closing). Projections, not guarantees.
Landlord ↔ Tenant lean methodology
- Overall (STATE)
- 31 Tenant-Leaning
- State Rhode Island
- 31 Tenant-Leaning · D+8
- County
- — inherits STATE
- City
- — inherits STATE
ZIP-level market 02816
- Active inventory
- 176
- Price-to-rent
- 4.6×
Monthly cashflow live
- Estimated rent
- $2,196 medium interval (Pro) →
- Mortgage (P&I)
- −$629
- Tax from tax record
- −$112 /mo · $1,340/yr
- Insurance
- −$50
- HOA
- −$457
- Vacancy / Maint / Mgmt
- −$461
- Net cashflow
- $487
Break-even live
UW: 25.0% down · 7.5% · 30yr · 1.5% tax · 5.0% vac · 8.0% maint · 8.0% mgmt
Financing live
Cash to close
- Down payment
- $29,975
- Closing costs
- $3,597
- Reserves months
- —
- Total cash needed
- —
Loan-product check · same deal, 3 products live
Conventional
25% down · 7.5% · 30yr
- Down + closing
- —
- Monthly P&I
- —
- Monthly cashflow
- —
- DSCR
- —
- Eligible?
- —
Personal DTI + credit; lowest rate.
DSCR
20% down · 8.5% · 30yr
- Down + closing
- —
- Monthly P&I
- —
- Monthly cashflow
- —
- DSCR
- —
- Eligible?
- —
No personal income docs; deal must DSCR.
Hard money
10% down · 12.0% · 12mo
- Down + closing
- —
- Monthly P&I
- —
- Monthly cashflow
- —
- DSCR
- —
- Eligible?
- —
Short-term bridge; refi at stabilization.
Rent comps 2 comps
| Address | Beds | Baths | Sqft | Rent | $/sqft | DOM | Units | Dist |
|---|---|---|---|---|---|---|---|---|
| 20 Woodland Dr Coventry, RI | 1.0 | 1.0 | 634 | $1,690 | $2.67 | 1d | 1 | 0.81mi |
| 1 Patriot Way West Greenwich, RI | 1.0–2.0 | 1.0–2.5 | 1237 | $3,650 | $2.95 | 1d | 16 | 1.34mi |
HOA detail
- Monthly dues
- $457 · $5,484/yr
Listing history 15 events
-
2026-04-19status Pending
-
2026-03-29historical Active Under Contract
-
2026-02-26$119,900 Active
-
2019-12-21historical
-
2019-12-01$86,000 Active
-
2019-11-27$79,900 Active
-
2019-11-27historical
-
2018-12-20historical
-
2018-10-22price $59,900
-
2018-10-06$64,900 Active
-
2013-09-13soldstatus $25,000
-
2013-09-13soldstatus $25,000
-
2013-08-03historical
-
2013-07-14$25,000
-
2000-04-19$32,700
ⓘ Source: listings_history table (triggers on properties + properties_extension) + one-shot
backfill from property_details.listing_events for pre-trigger history.
Tax reassessment forecast RI · Partial reset (capped growth)
- Current annual tax
- $1,340 · $112/mo
- Projected year-2 tax
- $1,647 · $137/mo
- Expected delta
- +$307/yr (+$26/mo · 22.9%)
ⓘ Screening estimate from a state-policy table — verify with the county assessor before closing.
Climate risk First Street
- Flood 1/10 Low FEMA zone X (unshaded) · 0% chance over 30 yrs
- Wildfire 3/10 Moderate
- Heat 5/10 Major 7 d/yr ≥95°F today · 16 d/yr by 30 yrs out
- Wind 6/10 Major 70% chance of damaging wind over 30 yrs
- Air quality 2/10 Low 2 unhealthy d/yr today · 2 by 30 yrs out
Nearby sold comps map
Loading sold comps map…
Walkable amenities ~0.75 mi
Loading nearby amenities…
Taxation est. · year 1
- Rental income
- $26,346
- − Mortgage interest
- −$6,716
- − Property taxes
- −$1,340
- − Insurance
- −$600
- − Repairs & maintenance
- −$2,108
- − Management
- −$2,108
- − HOA
- −$5,484
- − Depreciation
- −$3,488
- Taxable income
- $4,503
- Est. tax owed @ 24.0%
- −$1,081
- After-tax cash flow
- $4,764/yr
For passive investors: Depreciation is non-cash, so a rental often shows a tax loss while cash-flowing — sheltering income. Rental losses are passive: they offset passive income freely, and up to $25,000/yr can offset ordinary (W-2) income if you actively participate and your MAGI is under $100k (phasing out to $0 by $150k); unused losses carry forward. On sale, claimed depreciation is recaptured at up to 25%, and gains may owe capital-gains tax (a 1031 exchange can defer both). Figures are a year-1 estimate at your 24.0% rate — not tax advice; consult a CPA.
Schools (NCES district)
- District
- Coventry
- NCES district ID
- 4400210
- Math proficiency
- 25% ▼ -10.00%
- Reading proficiency
- 41% ▼ -10.00%
- Median HH income
- $66,277
- Composite
- 30.18/100
- National rank
- #6317
- State rank
- #19 of 39 in RI
Livability — Coventry
No livability data for this city. (Only ~50 U.S. cities are tracked.)
Census & demographics
- County
- Kent County · 90,904 people
- City population
- 33,298
- Metro
- Providence-Warwick, RI-MA
- Population (ZIP)
- 33,298
- Household income
- $101,431
- Rent vs Own
- Severe rent burden
- 667.0
Population outlook (Kent County) Hauer SSP2
- Today (2025)
- 160,994 people
- By 2030
- 157,428 · -2.2%
- By 2040
- 148,389 · -7.8%
- By 2050
- 137,995 · -14.3%
- By 2075
- 118,536 · -26.4%
- By 2100
- 102,266 · -36.5%
Race, ethnicity, and origin ACS 2023
- Neighborhood character
- Predominantly White (90%)
- Race & ethnicity
- White 90% Two or more races 6% Hispanic / Latino 5% Asian 1%
- Common ancestry
- Lithuanian 13% Russian 8% Romanian 4%
- Foreign-born
- 3% · Canada, China
- Languages at home
- 94% English-only · Spanish 3% Other Indo-European 1% French/Haitian/Cajun 1%
Political lean MEDSL · Kent
- 2024 margin
- Toss-up / Even · D 49.9% · R 48.1% · Other 2.0%
- 2008→2024 swing
- -15.6pp toward R · 2008: 17.5pp · 2024: 1.9pp
- All cycles
- 2024: D+1.9 2020: D+7.6 2016: R+0.7 2012: D+18.4 2008: D+17.5
Not yet ingested
- Civics
- —
Market trends
- HPI YoY
- ▼ -362.74%
- Current HPI
- 336.2662
- Rent YoY
- —
- Metro
- Providence-Warwick, RI-MA
- State GDP YoY
- ▲ 2.25%
- F500 in state
- 10
Industry mix (Fortune 500 HQ in RI)
| Industry | F500 HQs | Revenue |
|---|---|---|
| Healthcare | 1 | $373B |
|
||
| Food Distribution | 1 | $31B |
|
||
| Aerospace / Defense | 1 | $14B |
|
||
| Financial Services | 1 | $8B |
|
||
| Consumer Goods | 1 | $4B |
|
||
Price history
+266.7% since first listed15 events — show timeline
- 2026-04-19 Pending — RIS
- 2026-03-29 Contingent — RIS
- 2026-02-26 Listed $119,900 RIS
- 2019-12-21 Listing Removed — RIS
- 2019-12-01 Listed $86,000 RIS
- 2019-11-27 Listing Removed — RIS
- 2019-11-27 Listed $79,900 RIS
- 2018-12-20 Listing Removed — RIS
- 2018-10-22 Price Changed $59,900 RIS
- 2018-10-06 Listed $64,900 RIS
- 2013-09-13 Sold (Public Records) $25,000 Public Records
- 2013-09-13 Sold (MLS) $25,000 RIS
- 2013-08-03 Listing Removed — RIS
- 2013-07-14 Listed $25,000 RIS
- 2000-04-19 Listed $32,700 RIS
Property tax history
+7.9%/yrLatest (2025): $1,340 · +1.6% YoY. Source: county tax records.
Cash-flow waterfall
monthlySold comps — $/sqft
last 12 mo · ≤1 miLoading sold comps…