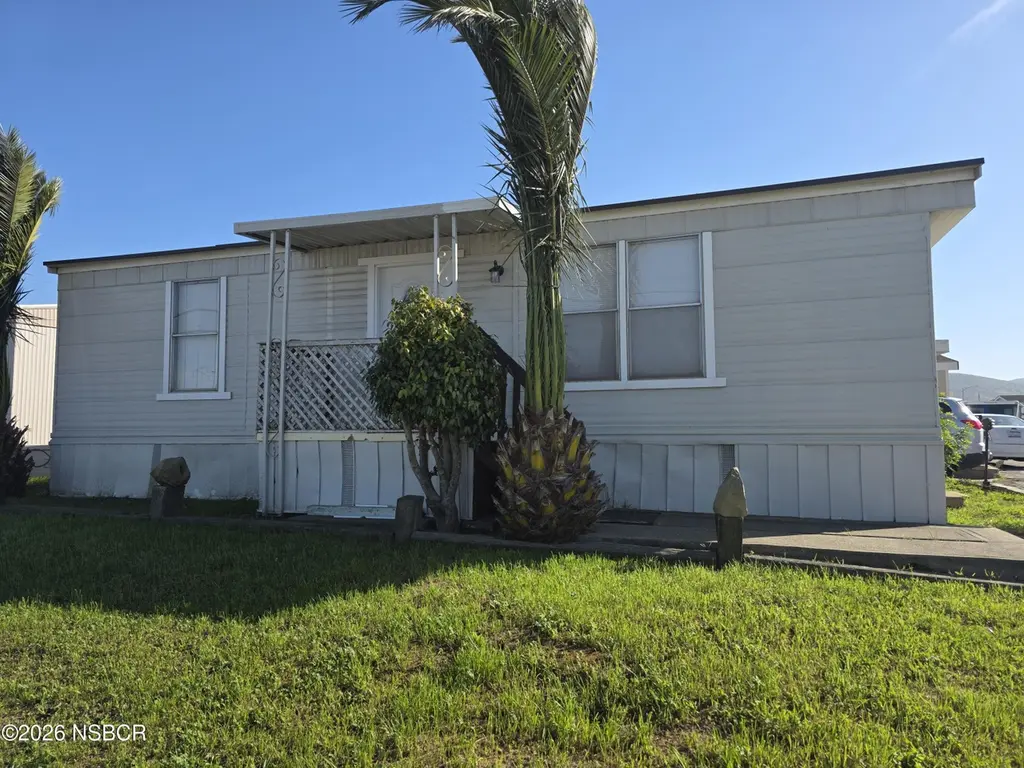
610 E Pine Ave #77 · Lompoc, CA
Flood risk 1/10 · Minimal
- FEMA flood zone
- X (unshaded)
- Chance of flooding over 30 yrs
- 0.0%
- Est. flood insurance / yr
- $507 – $1,088
Fire risk 4/10 · Minor
- Est. fire insurance / yr
- $659 – $1,223
Heat risk 2/10 · Minimal
- Hot days now (above 85°F)
- 7 days/yr
- Hot days in 30 yrs
- 17 days/yr
Wind risk 1/10 · Minimal
- Chance of severe wind over 30 yrs
- —
Air-quality risk 6/10 · Moderate
- Unhealthy air days now
- 10 days/yr
- Unhealthy air days in 30 yrs
- 10 days/yr
Risk factors via First Street. Map © Google.
Why this score? — see what drove the B- grade
The composite is a weighted blend of 9 inputs, each scored 0–100. Each bar is that input's sub-score; the figure is the points it added to the 100-point composite (weight × sub-score).
- Cash flow +30.0/30.0
- 1% rule +10.0/10.0
- DSCR +10.0/10.0
- ARV discount +3.8/15.0
- Schools +3.4/10.0
- Rent growth +3.3/5.0
- Livability +2.8/5.0
- Condition / age +2.5/5.0
- Appreciation +0.0/10.0
$65,000
🖨 Deal sheet 📄 Offer letter ✓ Due diligence
Listing remarks
Looking for an affordable 2-bedroom, 1 bath manufactured home located in the desirable Mountain View Mobile Home Estates, a 55+ community in Lompoc, Ca. The interior of this home offers laminate flooring, creating a clean and low maintenance living space. the kitchen comes equipped with a gas stove and refrigerator, ready for everyday use. An electric dryer outlet is also available for added convenience. Outside, the home includes one dedicated parking space and is ideally positioned next to Pine St. for easy access. This is a great opportunity to own a cozy home in a quiet, established senior community close to local amenities.
Key facts
- Built 1976
- Listed 30 days
Property features AI
Finance
- Other: Lot approximately 0.01 acres; Lot size recorded as 565 square feet; Zoning: Manufacturing
- HOA & community: Age restricted community; Land lease of $608.81
Exterior
- Parking: No street parking
- Utilities: Heating available; Cooling available
- Home design: Manufactured home; 36 feet by 24 feet
- Construction: Manufactured construction (Champion model/make)
- Exterior features: Raised foundation
Interior
- Kitchen: Oven; Refrigerator
- Flooring: Laminate
- Bathrooms: One three-quarter bathroom
- Heating & cooling: Has heating (type: Other); Has cooling (type: Other)
- Interior features: Laminate flooring; Electric dryer hookup
- Laundry & utility: Electric dryer hookup
Neighborhood map
What this means for you Summary
Snapshot
- This is a 2-bed/1.0-bath manufactured listed at $65k.
Deal economics
- At list price, monthly cash flow is $1k ($17k/yr) — positive.
- The deal already cash-flows at list — no discount required.
- Meets the 1% rule at list price ($2k rent vs $65k).
- Recommended offer: $64k (1.5% below list) — sets the bar for market timing.
- Cap rate 32.2% vs local median 2.9% in Lompoc — top-decile yield for the area; either an underpriced asset or a hidden risk that comps aren't pricing in. Stress-test before assuming the spread holds.
Location & tenants
- Location reads 56/100 on livability (#786 in CA) — a working-class tenant base; expect higher turnover. Strengths: housing B+; Watch: crime D, schools F, amenities F.
- Lompoc Unified (suburban): math 29% / reading 44% proficiency, ranked #818 of 1,400 in CA (top 58%) — families likely to look elsewhere, expect single-tenant / working-renter base with shorter leases.
- Market conditions: Rents rising (+3.3%/yr); 152 active listings in the ZIP; 19 comparable units currently listed for rent nearby; rentals at typical pace (median 24d on market — plan ~3-4 weeks tenant-placement turnaround); 42% of comp listings sitting > 30 days — soft ceiling on asking rent; solid renter incomes; 719 units permitted in Santa Barbara County in 2024 (217 in 5+ unit buildings).
- This rent runs 35% of the median local income ($80k/yr) — at the standard rent-burdened threshold; future hikes will face affordability resistance.
Forward outlook
- Local home prices are declining (-3.0%/yr); year-one equity from $449 of loan paydown is wiped out by about $2k of value loss. Plan a longer hold.
- Santa Barbara County population projected at +20% by 2050 — long-run rental-demand tailwind backs the buy-and-hold thesis.
- At projected returns (-3.0% appreciation + 3.3% rent growth), your $18k cash investment doubles in ~2 years — after that, you're playing with house money.
Negotiation context
- It's been on market 30 days — a 2% lower offer ($64k) is reasonable based on typical stale-listing flexibility.
Questions for the listing agent
- Built in 1976 — when were the roof, HVAC, electrical panel, plumbing, and water heater last replaced?
- Is there a deadline driving the sale (1031 exchange, divorce, estate, relocation)? That informs how much negotiation room exists.
- Schools are F-rated, which usually means shorter tenancies and higher turnover. Who's the typical renter profile here, and what's been the actual vacancy rate?
- Crime grade is D in this area — have there been break-ins, vandalism, or insurance claims at this property in the last 3 years? What carrier currently insures it and at what premium?
- What's the average days-on-market for RENTAL listings here right now (not sales)? A rising rental-DOM trend means longer vacancies and softer asking-rent achievability than the comps imply.
- What's the recent tenant-quality profile in this submarket — average credit score on applications, eviction rate, late-payment / NSF rate, and stable-employment percentage? A property-management company in the area should have these aggregated.
- How much new for-sale + rental construction is in the pipeline within 1–3 miles? Heavy new supply typically softens prices + rents 12–24 months out; constrained supply supports both.
Investment metrics
- 1% rule
- 3.61% ✓
- Cap rate
- 32.21%
- Cash-on-cash
- 92.58%
- DSCR
- 5.12
- GRM
- 2.3
CMA / ARV
- ARV (median comp)
- $60,000
- List price
- $65,000
- Delta
- 8.33%
- Verdict
- FAIR
- Comps
- 7 within 1.0 mi
Show comp detail 3 sales within ~0.75 mi
| Address | Dist | Beds/Ba | Sqft | Sold | Price | $/sf | Match |
|---|---|---|---|---|---|---|---|
| 610 E Pine Ave #29 | 0.05mi | 2/2.0 | 900 (+4%) | 2mo | $60,000 | $67 | 85 |
| 701 E Pine Ave #182 | 0.05mi | 2/1.5 | 960 (+11%) | 2mo | $65,000 | $68 | 76 |
| 610 E Pine Ave #17 | 0.10mi | 2/2.0 | 960 (+11%) | 5mo | $59,900 | $62 | 69 |
Match score weights: distance 35% · size 25% · config 20% · recency 20%. Top-matched comps best support the ARV.
Projected returns pro-forma
-3.0% appreciation · 3.31% rent growth · sell at horizon
- IRR
- 93.7%
- Equity multiple
- 5.38×
- Total profit
- $79,664
- Equity at exit
- $9,692
- IRR
- 96.6%
- Equity multiple
- 11.31×
- Total profit
- $187,697
- Equity at exit
- $5,620
Cash invested: $18,200 (down + closing). Projections, not guarantees.
Landlord ↔ Tenant lean methodology
- Overall (STATE)
- 18 Strongly Tenant-Friendly
- State California
- 18 Strongly Tenant-Friendly · D+13
- County
- — inherits STATE
- City
- — inherits STATE
ZIP-level market 93436
- Rents YoY
- 3.3%
- Active inventory
- 152
- Price-to-rent
- 2.3×
Monthly cashflow live
- Estimated rent
- $2,346 high interval (Pro) →
- Mortgage (P&I)
- −$341
- Tax est. 1.5%
- −$81 /mo · $975/yr
- Insurance
- −$27
- HOA
- −$0
- Vacancy / Maint / Mgmt
- −$493
- Net cashflow
- $1,404
Break-even live
UW: 25.0% down · 7.5% · 30yr · 1.5% tax · 5.0% vac · 8.0% maint · 8.0% mgmt
Financing live
Cash to close
- Down payment
- $16,250
- Closing costs
- $1,950
- Reserves months
- —
- Total cash needed
- —
Loan-product check · same deal, 3 products live
Conventional
25% down · 7.5% · 30yr
- Down + closing
- —
- Monthly P&I
- —
- Monthly cashflow
- —
- DSCR
- —
- Eligible?
- —
Personal DTI + credit; lowest rate.
DSCR
20% down · 8.5% · 30yr
- Down + closing
- —
- Monthly P&I
- —
- Monthly cashflow
- —
- DSCR
- —
- Eligible?
- —
No personal income docs; deal must DSCR.
Hard money
10% down · 12.0% · 12mo
- Down + closing
- —
- Monthly P&I
- —
- Monthly cashflow
- —
- DSCR
- —
- Eligible?
- —
Short-term bridge; refi at stabilization.
Rent comps 19 comps
| Address | Beds | Baths | Sqft | Rent | $/sqft | DOM | Units | Dist |
|---|---|---|---|---|---|---|---|---|
| 400 E Cherry Ave Lompoc, CA | 3.0 | 2.0 | 1117 | $3,000 | $2.69 | 13d | 1 | 0.22mi |
| 604 N 4th St Unit N604B Lompoc, CA | 2.0 | 1.0 | 800 | $2,300 | $2.88 | 43d | 1 | 0.41mi |
| 505 N Sixth St Unit A Lompoc, CA | 2.0 | 1.0 | 600 | $2,000 | $3.33 | 13d | 1 | 0.56mi |
| 218 N C St Lompoc, CA | 2.0 | 1.0 | 950 | $1,875 | $1.97 | 23d | 1 | 0.60mi |
| 401 W Pine Ave Lompoc, CA | 1.0–2.0 | 1.0 | 734 | $2,200 | $3.00 | 13d | 1 | 0.66mi |
| 404 W Barton Ave Unit 2 Lompoc, CA | 2.0 | 1.5 | 878 | $2,200 | $2.51 | 43d | 1 | 0.83mi |
| 324 W Chestnut Ave Lompoc, CA | 2.0 | 2.5 | 940 | $2,600 | $2.77 | 23d | 1 | 0.84mi |
| 408 N M St Unit 408A Lompoc, CA | 3.0 | 1.0 | 768 | $2,295 | $2.99 | 43d | 1 | 0.88mi |
| 321 N L St Unit C Lompoc, CA | 2.0 | 1.0 | 1100 | $2,400 | $2.18 | 23d | 1 | 0.88mi |
| 922 Oleander St Lompoc, CA | 3.0 | 2.0 | 1008 | $2,500 | $2.48 | 43d | 1 | 0.90mi |
| 924 N O St Lompoc, CA | 3.0 | 2.0 | 1008 | $2,300 | $2.28 | 43d | 1 | 0.95mi |
| 214 S F St #2 Lompoc, CA | 2.0 | 1.5 | 946 | $2,500 | $2.64 | 23d | 1 | 0.96mi |
| 423 N N St Lompoc, CA | 2.0 | 1.0 | 900 | $2,200 | $2.44 | 43d | 1 | 0.96mi |
| 804 W Nectarine Ave Lompoc, CA | 2.0 | 1.0 | 850 | $2,200 | $2.59 | 43d | 1 | 0.97mi |
| 812 W Laurel Ave Lompoc, CA | 2.0 | 1.0 | 800 | $2,170 | $2.71 | 13d | 2 | 1.12mi |
| 212 W Hickory Ave Lompoc, CA | 3.0 | 1.0 | 1081 | $2,300 | $2.13 | 23d | 1 | 1.15mi |
| 925 W Chestnut Ave Lompoc, CA | 2.0 | 1.0 | 699 | $2,195 | $3.14 | 13d | 3 | 1.18mi |
| 960 W Chestnut Ave Unit 946-D Lompoc, CA | 2.0 | 1.0 | 800 | $2,050 | $2.56 | 23d | 1 | 1.22mi |
| 119 W Locust Ave Unit 111 Lompoc, CA | 3.0 | 2.0 | 972 | $2,695 | $2.77 | 43d | 1 | 1.30mi |
Listing history 2 events
-
2026-05-30status $65,000 Pending 30 DOM
-
2026-04-29$65,000 Active 639-char remark
ⓘ Source: listings_history table (triggers on properties + properties_extension) + one-shot
backfill from property_details.listing_events for pre-trigger history.
Climate risk First Street
- Flood 1/10 Low FEMA zone X (unshaded) · 0% chance over 30 yrs
- Wildfire 4/10 Moderate
- Heat 2/10 Low 7 d/yr ≥85°F today · 17 d/yr by 30 yrs out
- Wind 1/10 Low
- Air quality 6/10 Major 10 unhealthy d/yr today · 10 by 30 yrs out
Nearby sold comps map
Loading sold comps map…
Walkable amenities ~0.75 mi
Loading nearby amenities…
Taxation est. · year 1
- Rental income
- $28,151
- − Mortgage interest
- −$3,641
- − Property taxes
- −$975
- − Insurance
- −$325
- − Repairs & maintenance
- −$2,252
- − Management
- −$2,252
- − Depreciation
- −$1,891
- Taxable income
- $16,815
- Est. tax owed @ 24.0%
- −$4,036
- After-tax cash flow
- $12,813/yr
For passive investors: Depreciation is non-cash, so a rental often shows a tax loss while cash-flowing — sheltering income. Rental losses are passive: they offset passive income freely, and up to $25,000/yr can offset ordinary (W-2) income if you actively participate and your MAGI is under $100k (phasing out to $0 by $150k); unused losses carry forward. On sale, claimed depreciation is recaptured at up to 25%, and gains may owe capital-gains tax (a 1031 exchange can defer both). Figures are a year-1 estimate at your 24.0% rate — not tax advice; consult a CPA.
Schools (NCES district)
- District
- Lompoc Unified
- NCES district ID
- 0622410
- Math proficiency
- 29% ▲ 3.00%
- Reading proficiency
- 44% ▼ -2.00%
- Median HH income
- $53,716
- Composite
- 34.49/100
- National rank
- #10135
- State rank
- #818 of 1400 in CA
Livability — Lompoc
- Score
- 56/100
- State rank
- #786
- US rank
- #22552
Category grades
Schools grade is shown separately in the Schools card above.
Census & demographics
- Census place
- Lompoc, CA
- County
- Santa Barbara County · 410,380 people
- City population
- 55,820
- Metro
- Santa Maria-Santa Barbara, CA
- Population (ZIP)
- 55,820
- Household income
- $80,097
- Rent vs Own
- Severe rent burden
- 1845.0
Population outlook (Santa Barbara County) Hauer SSP2
- Today (2025)
- 484,679 people
- By 2030
- 505,323 · +4.3%
- By 2040
- 545,783 · +12.6%
- By 2050
- 584,263 · +20.5%
- By 2075
- 682,586 · +40.8%
- By 2100
- 723,188 · +49.2%
Race, ethnicity, and origin ACS 2023
- Neighborhood character
- Diverse neighborhood (Simpson 0.57)
- Race & ethnicity
- Hispanic / Latino 56% White 34% Two or more races 25% Black 3% Asian 3% Native American 2%
- Hispanic origin (detail)
- Mexican 49%
- Common ancestry
- Italian 2% Slovak 1% Lithuanian 1%
- Foreign-born
- 21% · Canada
- Languages at home
- 59% English-only · Spanish 37% Other Asian/Pacific 1% Tagalog/Filipino 1%
Political lean MEDSL · Santa Barbara
- 2024 margin
- Strong D (+26.7) · D 61.8% · R 35.1% · Other 3.1%
- 2008→2024 swing
- +3.8pp toward D · 2008: 22.9pp · 2024: 26.7pp
- All cycles
- 2024: D+26.7 2020: D+32.1 2016: D+28.2 2012: D+17.1 2008: D+22.9
Not yet ingested
- Civics
- —
Market trends
- HPI YoY
- ▼ -574.83%
- Current HPI
- 310.2366
- Rent YoY
- ▲ 3.31%
- Metro
- Santa Maria-Santa Barbara, CA
- State GDP YoY
- ▲ 3.21%
- F500 in state
- 116
Industry mix (Fortune 500 HQ in CA)
| Industry | F500 HQs | Revenue |
|---|---|---|
| Technology | 27 | $1,492B |
|
||
| Financial Services | 3 | $174B |
|
||
| Retail | 3 | $44B |
|
||
| Insurance | 3 | $26B |
|
||
| Media / Entertainment | 2 | $115B |
|
||
| Pharmaceuticals / Biotech | 2 | $62B |
|
||
Price history
2 events — show timeline
- 2026-05-29 Pending — NSBCRMLS
- 2026-04-29 Listed $65,000 NSBCRMLS
Cash-flow waterfall
monthlySold comps — $/sqft
last 12 mo · ≤1 miLoading sold comps…