13 Riegel Oaks Ln · Homewood, IL
Flood risk 6/10 · Moderate
- FEMA flood zone
- X (unshaded)
- Chance of flooding over 30 yrs
- 0.82%
- Est. flood insurance / yr
- $473 – $860
Fire risk 1/10 · Minimal
- Est. fire insurance / yr
- $804 – $1,492
Heat risk 3/10 · Minor
- Hot days now (above 101°F)
- 7 days/yr
- Hot days in 30 yrs
- 15 days/yr
Wind risk 2/10 · Minimal
- Chance of severe wind over 30 yrs
- 0.0%
Air-quality risk 2/10 · Minimal
- Unhealthy air days now
- 1 days/yr
- Unhealthy air days in 30 yrs
- 1 days/yr
Risk factors via First Street. Map © Google.
Why this score? — see what drove the F grade
The composite is a weighted blend of 9 inputs, each scored 0–100. Each bar is that input's sub-score; the figure is the points it added to the 100-point composite (weight × sub-score).
- Cash flow +8.0/30.0
- Livability +4.0/5.0
- 1% rule +3.2/10.0
- Rent growth +2.5/5.0
- Condition / age +2.5/5.0
- Schools +2.4/10.0
- DSCR +2.1/10.0
- ARV discount +0.0/15.0
- Appreciation +0.0/10.0
$349,900
🖨 Deal sheet 📄 Offer letter ✓ Due diligence
Listing remarks
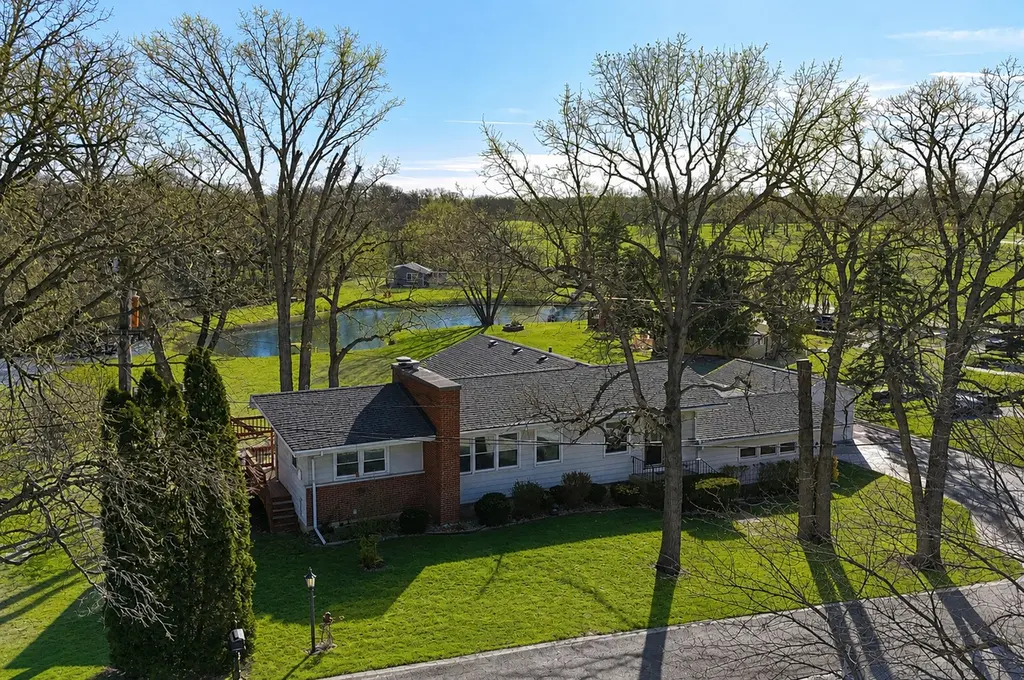
WHAT?!? WATERFRONT PROPERTY IN HOMEWOOD! Fabulous 1 acre property with dock and access to a large pond - paddle around, ice skate or fish right in your backyard! The home is set up on a hill with beautiful view from the multilevel deck! The home has a great layout - a large living room and eat-in kitchen, and a full bedroom suite on the main floor, and a family room with fireplace, storage and another updated full bedroom suite in the walkout lower level. There is both an attached garage, and a separate heated garage - perfect for a workshop, craft-shed or space for that special vehicle! New furnace, A/C, Water heater, Roof, Deck Refinishing, Kitchen Appliances all less than ten years.
Key facts
- 0.93 acre lot
- 3 garage spots
- Built 1957
Property features AI
Finance
- Other: Parcel number 32053110070000
- HOA & community: No master association fee required
Exterior
- Parking: Attached and detached garage space totaling 3 parking spots; Owned garage
- Utilities: Lake Michigan water source; Septic tank sewer
- Home design: Detached single-family home; Hillside setting; Fee simple ownership; Built 61–70 years ago; Home built before 1978
- Construction: Aluminum siding; Living area per plans
- Exterior features: Waterfront on Lake Michigan; Property offers school bus service, commuter bus and commuter train access, and nearby interstate access; Lot dimensions approximately 147 x 270
Interior
- Kitchen: Kitchen with fireplace
- Bedrooms: Master bedroom on main level (15 x 21); Additional bedrooms including one in the walkout basement (15 x 21)
- Flooring: Carpet in living room, family room and dining room
- Bathrooms: Two full bathrooms; Basement bathroom present
- Heating & cooling: Natural gas heating; Central air conditioning
- Interior features: Finished walk-out basement; Six total rooms; One fireplace located in the kitchen
- Laundry & utility: Laundry room in walkout basement (15 x 15)
Neighborhood map
What this means for you Summary
Snapshot
- This is a 3-bed/2.0-bath single-family listed at $350k.
Deal economics
- At list price, monthly cash flow is $-355 ($-4k/yr) — negative.
- To cash-flow at today's rent, offer at most $287k (17.9% below list).
- To meet the 1% rule (rent ≥ 1% of price), the offer needs to be $287k (17.9% below list).
- Recommended offer: $287k (17.9% below list) — sets the bar for 1% rule.
Location & tenants
- Location reads 81/100 on livability (#81 in IL, #1,314 nationally) — a professional / high-income tenant draw. Strengths: commute A+, employment A+, cost of living A+; Watch: amenities F.
- Homewood Flossmoor Chsd 233 (suburban): math 21% / reading 27% proficiency, ranked #272 of 620 in IL (top 44%) — low school quality limits family demand, transient renter base, plan for 1-2y turnover.
- Zoned schools: Homewood-Flossmoor High School (math 21% / reading 27%, grade F, #304 of 693 statewide, top 44%, 2,798 students, 0% FRL).
- Market conditions: 101 active listings in the ZIP; 5 comparable units currently listed for rent nearby; rentals leasing fast (median 11d on market — plan ~1-2 weeks tenant-placement turnaround); 6,272 units permitted in Cook County in 2024 (4,658 in 5+ unit buildings).
Forward outlook
- Local home prices are declining (-3.0%/yr); year-one equity from $2k of loan paydown is wiped out by about $10k of value loss. Plan a longer hold.
Negotiation context
- It's been on market 44 days — a 3% lower offer ($339k) is reasonable based on typical stale-listing flexibility.
- 2 sale attempts; this cycle's ask has dropped $25k (7%) from the opening price — seller is motivated, your offer sets the floor, not the list.
- Current owner paid $123k; list at $350k implies a 184% gain — meaningful room to come down on a strong offer.
Risks & watch-outs
- Watch-outs: built in 1957 — expect roof / HVAC / electrical / plumbing capex.
- Climate carrying-cost: major flood risk — expect insurance premiums to compound above CPI over the hold.
Questions for the listing agent
- What do current leases actually rent for vs. the listed asking? Can we see a recent rent roll and the last 12 months of T-12 income?
- It's been on market 44 days. Have you received any prior offers? Is the seller open to a 18% concession, seller financing, or rate buy-down credit?
- Built in 1957 — when were the roof, HVAC, electrical panel, plumbing, and water heater last replaced?
- Is there a deadline driving the sale (1031 exchange, divorce, estate, relocation)? That informs how much negotiation room exists.
- Schools are D-rated, which usually means shorter tenancies and higher turnover. Who's the typical renter profile here, and what's been the actual vacancy rate?
- The area grade is low — what's the realistic commute time and amenity access for the typical tenant pool here? Any planned neighborhood developments (good or bad) we should know about?
- What's the average days-on-market for RENTAL listings here right now (not sales)? A rising rental-DOM trend means longer vacancies and softer asking-rent achievability than the comps imply.
- What's the recent tenant-quality profile in this submarket — average credit score on applications, eviction rate, late-payment / NSF rate, and stable-employment percentage? A property-management company in the area should have these aggregated.
- How much new for-sale + rental construction is in the pipeline within 1–3 miles? Heavy new supply typically softens prices + rents 12–24 months out; constrained supply supports both.
Investment metrics
- 1% rule
- 0.82% ✗
- Cap rate
- 5.08%
- Cash-on-cash
- -4.35%
- DSCR
- 0.81
- GRM
- 10.2
CMA / ARV
- ARV (on-the-fly)
- $251,093
- Comps found
- 12
Show comp detail 12 sales within ~0.75 mi
| Address | Dist | Beds/Ba | Sqft | Sold | Price | $/sf | Match |
|---|---|---|---|---|---|---|---|
| 18823 Ashland Ave | 0.22mi | 4/2.0 (+1) | 1,418 (+9%) | 1mo | $250,000 | $176 | 69 |
| 18623 Marshfield Ave | 0.53mi | 3/2.0 | 1,320 (+2%) | 5mo | $255,000 | $193 | 68 |
| 1832 187th St | 0.55mi | 3/1.5 | 1,309 (+1%) | 6mo | $125,000 | $95 | 66 |
| 1822 W 187th St | 0.53mi | 3/2.0 | 1,364 (+5%) | 5mo | $160,000 | $117 | 63 |
| 18521 Homewood Ave | 0.71mi | 3/2.0 | 1,304 (+0%) | 6mo | $279,000 | $214 | 62 |
| 1522 186th St | 0.53mi | 3/1.0 | 1,209 (-7%) | 3mo | $226,000 | $187 | 57 |
| 830 Latimer Ln | 0.64mi | 3/2.0 | 1,382 (+6%) | 5mo | $232,000 | $168 | 55 |
| 1307 Thomas St | 0.32mi | 4/2.0 (+1) | 1,487 (+14%) | 1mo | $319,000 | $215 | 55 |
| 1041 Coach Rd | 0.69mi | 4/2.0 (+1) | 1,407 (+8%) | 2mo | $289,000 | $205 | 47 |
| 18630 Highland Ave | 0.60mi | 3/1.5 | 1,485 (+14%) | 2mo | $270,000 | $182 | 45 |
| 18439 Marshfield Ave | 0.68mi | 4/2.0 (+1) | 1,184 (-9%) | 7mo | $350,000 | $296 | 43 |
| 18521 Highland Ave | 0.68mi | 2/1.0 (-1) | 1,198 (-8%) | 6mo | $249,000 | $208 | 41 |
Match score weights: distance 35% · size 25% · config 20% · recency 20%. Top-matched comps best support the ARV.
Projected returns pro-forma
-3.0% appreciation · 3.0% rent growth · sell at horizon
- IRR
- -23.6%
- Equity multiple
- 0.19×
- Total profit
- $-79,133
- Equity at exit
- $52,171
- IRR
- -18.3%
- Equity multiple
- 0.01×
- Total profit
- $-97,324
- Equity at exit
- $30,253
Cash invested: $97,972 (down + closing). Projections, not guarantees.
Landlord ↔ Tenant lean methodology
- Overall (STATE)
- 43 Moderately Tenant-Leaning
- State Illinois
- 43 Moderately Tenant-Leaning · D+7
- County
- — inherits STATE
- City
- — inherits STATE
ZIP-level market 60430
- Home prices YoY
- -32.1%
- Active inventory
- 101
- Price-to-rent
- 10.2×
Monthly cashflow live
- Estimated rent
- $2,872 medium interval (Pro) →
- Mortgage (P&I)
- −$1,835
- Tax from tax record
- −$643 /mo · $7,717/yr
- Insurance
- −$146
- HOA
- −$0
- Vacancy / Maint / Mgmt
- −$603
- Net cashflow
- $-355
Break-even live
UW: 25.0% down · 7.5% · 30yr · 1.5% tax · 5.0% vac · 8.0% maint · 8.0% mgmt
Financing live
Cash to close
- Down payment
- $87,475
- Closing costs
- $10,497
- Reserves months
- —
- Total cash needed
- —
Loan-product check · same deal, 3 products live
Conventional
25% down · 7.5% · 30yr
- Down + closing
- —
- Monthly P&I
- —
- Monthly cashflow
- —
- DSCR
- —
- Eligible?
- —
Personal DTI + credit; lowest rate.
DSCR
20% down · 8.5% · 30yr
- Down + closing
- —
- Monthly P&I
- —
- Monthly cashflow
- —
- DSCR
- —
- Eligible?
- —
No personal income docs; deal must DSCR.
Hard money
10% down · 12.0% · 12mo
- Down + closing
- —
- Monthly P&I
- —
- Monthly cashflow
- —
- DSCR
- —
- Eligible?
- —
Short-term bridge; refi at stabilization.
Rent comps 5 comps
| Address | Beds | Baths | Sqft | Rent | $/sqft | DOM | Units | Dist |
|---|---|---|---|---|---|---|---|---|
| 1332 Jamie Ln Homewood, IL | 4.0 | 2.5 | 1576 | $3,171 | $2.01 | 24d | 1 | 0.34mi |
| 1601 183rd St Unit 1237861P Homewood, IL | 3.0 | 1.5 | 1528 | $8,665 | $5.67 | 21d | 1 | 0.91mi |
| 1802 Evergreen Rd Homewood, IL | 4.0 | 2.0 | 1716 | $2,836 | $1.65 | 6d | 1 | 0.94mi |
| 18117 Loomis Ave Homewood, IL | 4.0 | 2.0 | 1500 | $2,800 | $1.87 | 3d | 1 | 1.15mi |
| 2420 183rd St Homewood, IL | 2.0 | 1.0 | 1100 | $1,750 | $1.59 | 10d | 1 | 1.46mi |
Listing history 17 events
-
2026-06-18days on market $349,900 Active 44 DOM
-
2026-06-17days on market $349,900 Active 43 DOM
-
2026-06-16days on market $349,900 Active 42 DOM
-
2026-06-15days on market $349,900 Active 41 DOM
-
2026-06-13pricedays on market $349,900 Active 39 DOM
-
2026-06-09days on market $374,900 Active 35 DOM
-
2026-06-08days on market $374,900 Active 34 DOM
-
2026-06-07days on market $374,900 Active 33 DOM
-
2026-06-04days on market $374,900 Active 30 DOM
-
2026-06-03days on market $374,900 Active 29 DOM
-
2026-06-02days on market $374,900 Active 28 DOM
-
2026-06-01days on market $374,900 Active 27 DOM
-
2026-05-31days on market $374,900 Active 26 DOM
-
2026-05-05historical
-
2026-05-05$374,900 Active
-
2026-02-26Active
-
1988-06-14soldstatus $123,000
ⓘ Source: listings_history table (triggers on properties + properties_extension) + one-shot
backfill from property_details.listing_events for pre-trigger history.
Tax reassessment forecast IL · Partial reset (capped growth)
- Current annual tax
- $7,717 · $643/mo
- Projected year-2 tax
- $7,830 · $652/mo
- Expected delta
- +$113/yr (+$9/mo · 1.5%)
ⓘ Screening estimate from a state-policy table — verify with the county assessor before closing.
Climate risk First Street
- Flood 6/10 Major FEMA zone X (unshaded) · 82% chance over 30 yrs
- Wildfire 1/10 Low
- Heat 3/10 Moderate 7 d/yr ≥101°F today · 15 d/yr by 30 yrs out
- Wind 2/10 Low 0% chance of damaging wind over 30 yrs
- Air quality 2/10 Low 1 unhealthy d/yr today · 1 by 30 yrs out
Nearby sold comps map
Loading sold comps map…
Walkable amenities ~0.75 mi
Loading nearby amenities…
Taxation est. · year 1
- Rental income
- $34,464
- − Mortgage interest
- −$19,600
- − Property taxes
- −$7,717
- − Insurance
- −$1,750
- − Repairs & maintenance
- −$2,757
- − Management
- −$2,757
- − Depreciation
- −$10,179
- Taxable loss
- −$10,295
- Est. tax savings @ 24.0%
- +$2,471
- After-tax cash flow
- $-1,788/yr
For passive investors: Depreciation is non-cash, so a rental often shows a tax loss while cash-flowing — sheltering income. Rental losses are passive: they offset passive income freely, and up to $25,000/yr can offset ordinary (W-2) income if you actively participate and your MAGI is under $100k (phasing out to $0 by $150k); unused losses carry forward. On sale, claimed depreciation is recaptured at up to 25%, and gains may owe capital-gains tax (a 1031 exchange can defer both). Figures are a year-1 estimate at your 24.0% rate — not tax advice; consult a CPA.
Schools (NCES district)
- District
- Homewood Flossmoor Chsd 233
- NCES district ID
- 1719560
- Math proficiency
- 21% ▼ -15.00%
- Reading proficiency
- 27% ▼ -13.00%
- Median HH income
- $83,564
- Composite
- 24.42/100
- National rank
- #7681
- State rank
- #272 of 620 in IL
Livability — Homewood
- Score
- 81/100
- State rank
- #81
- US rank
- #1314
Category grades
Schools grade is shown separately in the Schools card above.
Census & demographics
- City population
- 19,993
- Population (ZIP)
- 19,993
Population outlook (Cook County) Hauer SSP2
- Today (2025)
- 5,347,519 people
- By 2030
- 5,357,703 · +0.2%
- By 2040
- 5,324,924 · -0.4%
- By 2050
- 5,230,762 · -2.2%
- By 2075
- 4,785,735 · -10.5%
- By 2100
- 4,188,836 · -21.7%
Race, ethnicity, and origin ACS 2023
- Neighborhood character
- Diverse neighborhood (Simpson 0.62)
- Race & ethnicity
- Black 44% White 42% Hispanic / Latino 9% Two or more races 6% Asian 1%
- Hispanic origin (detail)
- Mexican 7%
- Common ancestry
- Romanian 5% Iranian 2% Italian 2%
- Foreign-born
- 6% · Canada, Dominican Republic
- Languages at home
- 91% English-only · Spanish 5% Russian/Polish/Slavic 1% German/W. Germanic 1%
Political lean MEDSL · Cook
- 2024 margin
- Solid D (+42.0) · D 70.4% · R 28.4% · Other 1.2%
- 2008→2024 swing
- -11.4pp toward R · 2008: 53.4pp · 2024: 42.0pp
- All cycles
- 2024: D+42.0 2020: D+50.3 2016: D+53.0 2012: D+49.4 2008: D+53.4
Not yet ingested
- Civics
- —
Market trends
- HPI YoY
- ▼ -105.00%
- Current HPI
- 222.2923
- Rent YoY
- —
- Metro
- —
- State GDP YoY
- ▲ 1.59%
- F500 in state
- 60
Industry mix (Fortune 500 HQ in IL)
| Industry | F500 HQs | Revenue |
|---|---|---|
| Insurance | 4 | $201B |
|
||
| Consumer Goods | 4 | $87B |
|
||
| Industrial Machinery | 3 | $64B |
|
||
| Healthcare | 2 | $55B |
|
||
| Retail / Pharmacy | 1 | $148B |
|
||
| Agriculture / Food | 1 | $86B |
|
||
Price history
+204.8% since first listed4 events — show timeline
- 2026-05-05 Listed $374,900 MRED as Distributed by MLS Grid
- 2026-05-05 Listing Removed — MRED as Distributed by MLS Grid
- 2026-02-26 Listed — MRED as Distributed by MLS Grid
- 1988-06-14 Sold (Public Records) $123,000 Public Records
Property tax history
+4.1%/yrLatest (2023): $7,717 · +52.3% YoY. Source: county tax records.
Cash-flow waterfall
monthlySold comps — $/sqft
last 12 mo · ≤1 miLoading sold comps…