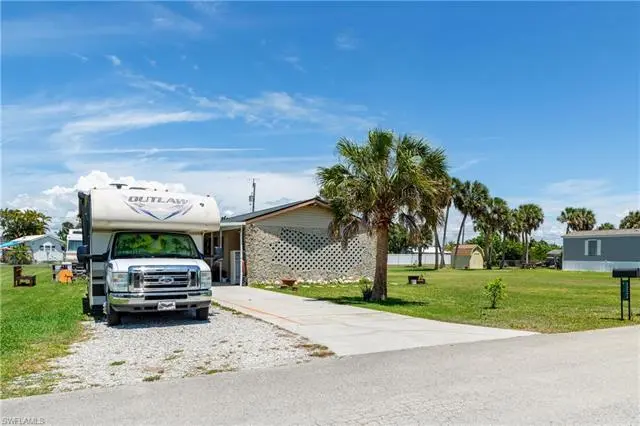
7784 Raymary St · Bokeelia, FL
Flood risk 10/10 · Severe
- FEMA flood zone
- AE
- Chance of flooding over 30 yrs
- 0.99%
- Est. flood insurance / yr
- $1,737 – $8,500
Fire risk 3/10 · Minor
- Est. fire insurance / yr
- $947 – $1,759
Heat risk 10/10 · Severe
- Hot days now (above 107°F)
- 7 days/yr
- Hot days in 30 yrs
- 27 days/yr
Wind risk 10/10 · Severe
- Chance of severe wind over 30 yrs
- 99.0%
Air-quality risk 3/10 · Minor
- Unhealthy air days now
- 2 days/yr
- Unhealthy air days in 30 yrs
- 2 days/yr
Risk factors via First Street. Map © Google.
Why this score? — see what drove the B grade
The composite is a weighted blend of 9 inputs, each scored 0–100. Each bar is that input's sub-score; the figure is the points it added to the 100-point composite (weight × sub-score).
- Cash flow +30.0/30.0
- 1% rule +10.0/10.0
- DSCR +10.0/10.0
- ARV discount +7.5/15.0
- Schools +4.1/10.0
- Livability +3.4/5.0
- Rent growth +2.5/5.0
- Condition / age +2.5/5.0
- Appreciation +0.0/10.0
$125,000
🖨 Deal sheet (PDF) 📄 Offer letter ✓ Due diligence
Listing remarks
Priced to sell! Welcome to relaxed Florida living in this 3-bedroom, 2-bath and den manufactured home. The house sits on its own land with no HOA and no lot rent. Located in a quiet, established neighborhood, you'll enjoy Old Florida charm with easy access to fishing, boating, beaches, and the laid-back island lifestyle just minutes away. The home is in good overall shape with solid bones, just needing minor cosmetic updates. The primary bedroom has been set up as an efficiency-style space and includes a small kitchenette, along with room laundry - great for guests, in-laws, long-term visitors, or even extra rental income potential. Additional features include a spacious extra room with a
Key facts
- Own land
- No hoa
- 9,583 sq ft lot
Tags
Property features AI
Finance
- Other: Zoning: MH-1; Lot described as regular; Approximately 0.22 acres; Irrigation: well; View: see remarks; Single-unit property (1 unit/building), single floor
- HOA & community: No community maintenance or shared amenities; Community type: Mobile/Manufactured, Non-gated
Exterior
- Parking: Attached carport (1 space)
- Utilities: Well water; Septic sewer; Electrical service (utility details not further specified)
- Home design: Manufactured residential home; 1 story / ranch; Rear exposure faces north; Located in Coconut Grove development
- Construction: Built in 1983; Manufactured construction; Vinyl siding exterior; Shingle roof; Foundational details not provided
- Exterior features: Patio; Casement windows; See remarks about windows
Interior
- Kitchen: Electric cooktop; Self-cleaning oven; Microwave; Dishwasher; Refrigerator / freezer with icemaker; Pantry
- Bedrooms: 3 bedrooms
- Flooring: Wood flooring
- Bathrooms: 2 full bathrooms; Master bathroom with shower (no tub)
- Heating & cooling: Central electric heating; Wall unit heating; Window-unit cooling; Cable available
- Interior features: Bar; Built-in cabinets; Cable prewire; Closet cabinets; Fireplace; Pantry; Smoke detectors; Walk-in closet; Den (study); Breakfast bar / dining in living area; Efficiency / great room / split-bedroom floor plan
- Laundry & utility: Washer (hookup provided); Washer/dryer hookup
Neighborhood map
What this means for you Summary
Snapshot
- This is a 3-bed/2.0-bath manufactured listed at $125k.
Deal economics
- At list price, monthly cash flow is $588 ($7k/yr) — positive.
- The deal already cash-flows at list — no discount required.
- Meets the 1% rule at list price ($2k rent vs $125k).
- Recommended offer: $121k (3.0% below list) — sets the bar for market timing.
Location & tenants
- Location reads 68/100 on livability (#510 in FL) — a middle-class / working-renter tenant base. Strengths: crime A+, housing A+, schools A-; Watch: employment C-, amenities F, commute F.
- Lee (suburban): math 47% / reading 50% proficiency, ranked #42 of 73 in FL (top 58%) — families likely to look elsewhere, expect single-tenant / working-renter base with shorter leases.
- Market conditions: 247 active listings in the ZIP; 1 comparable units currently listed for rent nearby; 15,411 units permitted in Lee County in 2024 (4,686 in 5+ unit buildings).
Forward outlook
- Local home prices are declining (-3.0%/yr); year-one equity from $864 of loan paydown is wiped out by about $4k of value loss. Plan a longer hold.
- Lee County population projected at +44% by 2050 — long-run rental-demand tailwind backs the buy-and-hold thesis.
- At projected returns (-3.0% appreciation + 3.0% rent growth), your $35k cash investment doubles in ~6 years — after that, you're playing with house money.
Negotiation context
- It's been on market 55 days — a 3% lower offer ($121k) is reasonable based on typical stale-listing flexibility.
- 3 sale attempts since 12y ago; this cycle's ask has dropped $54k (30%) from the opening price — seller is motivated, your offer sets the floor, not the list.
- Current owner paid $53k; list at $125k implies a 136% gain — meaningful room to come down on a strong offer.
Risks & watch-outs
- Watch-outs: flood insurance adds $427/mo.
- Climate carrying-cost: in FEMA flood zone AE (mandatory federal flood insurance); severe wind risk, 99% chance of damaging wind over 30y; extreme-heat days projected 7→27/yr by 2055 (HVAC capex compounding) — expect insurance premiums to compound above CPI over the hold.
Questions for the listing agent
- It's been on market 55 days. Have you received any prior offers? Is the seller open to a 3% concession, seller financing, or rate buy-down credit?
- What's the actual annual flood-insurance premium (NFIP or private), and is the property in a SFHA with mandatory coverage?
- Is there a deadline driving the sale (1031 exchange, divorce, estate, relocation)? That informs how much negotiation room exists.
- Schools are A-rated — typically a magnet for longer-tenancy family renters. What's the average tenant stay here, and is there a school-zone premium baked into asking?
- What's the average days-on-market for RENTAL listings here right now (not sales)? A rising rental-DOM trend means longer vacancies and softer asking-rent achievability than the comps imply.
- What's the recent tenant-quality profile in this submarket — average credit score on applications, eviction rate, late-payment / NSF rate, and stable-employment percentage? A property-management company in the area should have these aggregated.
- How much new for-sale + rental construction is in the pipeline within 1–3 miles? Heavy new supply typically softens prices + rents 12–24 months out; constrained supply supports both.
Investment metrics
- 1% rule
- 1.80% ✓
- Cap rate
- 16.04%
- Cash-on-cash
- 34.80%
- DSCR
- 2.55
- GRM
- 4.6
CMA / ARV
No comps found within radius.
Projected returns pro-forma
-3.0% appreciation · 3.0% rent growth · sell at horizon
- IRR
- 12.5%
- Equity multiple
- 1.50×
- Total profit
- $17,456
- Equity at exit
- $18,638
- IRR
- 21.5%
- Equity multiple
- 2.84×
- Total profit
- $64,409
- Equity at exit
- $10,808
Cash invested: $35,000 (down + closing). Projections, not guarantees.
Landlord ↔ Tenant lean methodology
- Overall (STATE)
- 87 Strongly Landlord-Friendly
- State Florida
- 87 Strongly Landlord-Friendly · R+3
- County
- — inherits STATE
- City
- — inherits STATE
ZIP-level market 33922
- Home prices YoY
- -18.9%
- Active inventory
- 247
- Price-to-rent
- 4.6×
Monthly cashflow live
- Estimated rent
- $2,250 medium interval (Pro) →
- Mortgage (P&I)
- −$656
- Tax from tax record
- −$55 /mo · $659/yr
- Insurance
- −$52
- Flood insurance flood zone
- −$427 /mo · $5,118/yr
- HOA
- −$0
- Vacancy / Maint / Mgmt
- −$472
- Net cashflow
- $588
Break-even live
Sensitivity live
| Price | -10% $659 | -5% $624 | +0% $588 | +5% $553 | +10% $518 |
|---|---|---|---|---|---|
| Rent | -10% $411 | -5% $500 | +0% $588 | +5% $677 | +10% $766 |
| Rate | -1.0pp $651 | -0.5pp $620 | base $588 | +0.5pp $556 | +1.0pp $523 |
UW: 25.0% down · 7.5% · 30yr · 1.5% tax · 5.0% vac · 8.0% maint · 8.0% mgmt
Financing live
Cash to close
- Down payment
- $31,250
- Closing costs
- $3,750
- Reserves months
- —
- Total cash needed
- —
Loan-product check · same deal, 3 products live
Conventional
25% down · 7.5% · 30yr
- Down + closing
- —
- Monthly P&I
- —
- Monthly cashflow
- —
- DSCR
- —
- Eligible?
- —
Personal DTI + credit; lowest rate.
DSCR
20% down · 8.5% · 30yr
- Down + closing
- —
- Monthly P&I
- —
- Monthly cashflow
- —
- DSCR
- —
- Eligible?
- —
No personal income docs; deal must DSCR.
Hard money
10% down · 12.0% · 12mo
- Down + closing
- —
- Monthly P&I
- —
- Monthly cashflow
- —
- DSCR
- —
- Eligible?
- —
Short-term bridge; refi at stabilization.
Rent comps 1 comps
| Address | Beds | Baths | Sqft | Rent | $/sqft | DOM | Units | Dist |
|---|---|---|---|---|---|---|---|---|
| 16276 Nautical Way #1404 Bokeelia, FL | 2.0 | 2.0 | 1081 | $2,250 | $2.08 | 24d | 1 | 1.10mi |
Listing history 23 events
-
2026-06-17days on market $125,000 Active 55 DOM
-
2026-06-16days on market $125,000 Active 54 DOM
-
2026-06-15days on market $125,000 Active 53 DOM
-
2026-06-13days on market $125,000 Active 51 DOM
-
2026-06-10days on market $125,000 Active 48 DOM
-
2026-06-09days on market $125,000 Active 47 DOM
-
2026-06-08pricedays on market $125,000 Active 46 DOM
-
2026-06-07days on market $129,000 Active 45 DOM
-
2026-06-03days on market $129,000 Active 41 DOM
-
2026-06-02days on market $129,000 Active 40 DOM
-
2026-06-01days on market $129,000 Active 39 DOM
-
2026-05-31days on market $129,000 Active 38 DOM
-
2026-05-18price $149,000
-
2026-05-08price $159,000
-
2026-05-02price $169,000
-
2026-04-23$179,000 Active
-
2017-03-13soldstatus $53,000
-
2015-02-09historical
-
2015-01-07$69,900 Active
-
2014-10-03historical
-
2014-04-04$84,000
-
2001-10-31soldstatus $40,000
-
1982-12-01soldstatus $10,300
ⓘ Source: listings_history table (triggers on properties + properties_extension) + one-shot
backfill from property_details.listing_events for pre-trigger history.
Tax reassessment forecast FL · Resets to sale price
- Current annual tax
- $659 · $55/mo
- Projected year-2 tax
- $1,038 · $86/mo
- Expected delta
- +$378/yr (+$32/mo · 57.4%)
ⓘ Screening estimate from a state-policy table — verify with the county assessor before closing.
Climate risk First Street
- Flood 10/10 Extreme FEMA zone AE · 99% chance over 30 yrs
- Wildfire 3/10 Moderate
- Heat 10/10 Extreme 7 d/yr ≥107°F today · 27 d/yr by 30 yrs out
- Wind 10/10 Extreme 99% chance of damaging wind over 30 yrs
- Air quality 3/10 Moderate 2 unhealthy d/yr today · 2 by 30 yrs out
Nearby sold comps map
Loading sold comps map…
Walkable amenities ~0.75 mi
Loading nearby amenities…
Taxation est. · year 1
- Rental income
- $27,000
- − Mortgage interest
- −$7,002
- − Property taxes
- −$659
- − Insurance
- −$5,744
- − Repairs & maintenance
- −$2,160
- − Management
- −$2,160
- − Depreciation
- −$3,636
- Taxable income
- $5,639
- Est. tax owed @ 24.0%
- −$1,353
- After-tax cash flow
- $5,708/yr
For passive investors: Depreciation is non-cash, so a rental often shows a tax loss while cash-flowing — sheltering income. Rental losses are passive: they offset passive income freely, and up to $25,000/yr can offset ordinary (W-2) income if you actively participate and your MAGI is under $100k (phasing out to $0 by $150k); unused losses carry forward. On sale, claimed depreciation is recaptured at up to 25%, and gains may owe capital-gains tax (a 1031 exchange can defer both). Figures are a year-1 estimate at your 24.0% rate — not tax advice; consult a CPA.
Schools (NCES district)
- District
- Lee
- NCES district ID
- 1201080
- Math proficiency
- 47% ▼ -11.00%
- Reading proficiency
- 50% ▼ -4.00%
- Median HH income
- $49,518
- Composite
- 41.49/100
- National rank
- #3458
- State rank
- #42 of 73 in FL
Livability — Bokeelia
- Score
- 68/100
- State rank
- #510
- US rank
- #9393
Category grades
Schools grade is shown separately in the Schools card above.
Census & demographics
- Census place
- Bokeelia, FL
- Population (ZIP)
- 4,179
Population outlook (Lee County) Hauer SSP2
- Today (2025)
- 871,946 people
- By 2030
- 955,468 · +9.6%
- By 2040
- 1,113,587 · +27.7%
- By 2050
- 1,256,891 · +44.1%
- By 2075
- 1,560,270 · +78.9%
- By 2100
- 1,726,848 · +98.0%
Race, ethnicity, and origin ACS 2023
- Neighborhood character
- Predominantly White (80%)
- Race & ethnicity
- White 80% Hispanic / Latino 19% Two or more races 15% Native American 2%
- Hispanic origin (detail)
- Mexican 5%
- Common ancestry
- Slovak 3% Lithuanian 2% Romanian 2%
- Foreign-born
- 14% · Canada
- Languages at home
- 81% English-only · Spanish 18% Vietnamese 1%
Political lean MEDSL · Lee
- 2024 margin
- Strong R (+28.4) · D 35.5% · R 63.9%
- 2008→2024 swing
- -18.0pp toward R · 2008: -10.4pp · 2024: -28.4pp
- All cycles
- 2024: R+28.4 2020: R+19.2 2016: R+20.4 2012: R+16.6 2008: R+10.4
Not yet ingested
- Civics
- —
Market trends
- HPI YoY
- ▼ -71.08%
- Current HPI
- 304.2139
- Rent YoY
- —
- Metro
- —
- State GDP YoY
- ▲ 3.28%
- F500 in state
- 36
Industry mix (Fortune 500 HQ in FL)
| Industry | F500 HQs | Revenue |
|---|---|---|
| Industrial Technology | 2 | $29B |
|
||
| Insurance | 2 | $17B |
|
||
| Retail | 1 | $60B |
|
||
| Technology Distribution | 1 | $58B |
|
||
| Homebuilding | 1 | $35B |
|
||
| Technology Manufacturing | 1 | $35B |
|
||
Price history
+1346.6% since first listed11 events — show timeline
- 2026-05-18 Price Changed $149,000 NAPLESMLS
- 2026-05-08 Price Changed $159,000 NAPLESMLS
- 2026-05-02 Price Changed $169,000 NAPLESMLS
- 2026-04-23 Listed $179,000 NAPLESMLS
- 2017-03-13 Sold (Public Records) $53,000 Public Records
- 2015-02-09 Listing Removed — FORTMLS
- 2015-01-07 Listed $69,900 FORTMLS
- 2014-10-03 Listing Removed — FORTMLS
- 2014-04-04 Listed $84,000 FORTMLS
- 2001-10-31 Sold (Public Records) $40,000 Public Records
- 1982-12-01 Sold (Public Records) $10,300 Public Records
Property tax history
-5.6%/yrLatest (2025): $659 · +8.6% YoY. Source: county tax records.
Cash-flow waterfall
monthlySold comps — $/sqft
last 12 mo · ≤1 miLoading sold comps…