 Multi-family
85 JEFFERSON St #13 · Hoboken, NJ
Flood risk No data
- FEMA flood zone
- —
- Chance of flooding over 30 yrs
- —
- Est. flood insurance / yr
- —
Fire risk No data
- Est. fire insurance / yr
- —
Heat risk No data
- Hot days now (above threshold)
- —
- Hot days in 30 yrs
- —
Wind risk No data
- Chance of severe wind over 30 yrs
- —
Air-quality risk No data
- Unhealthy air days now
- —
- Unhealthy air days in 30 yrs
- —
Risk factors via First Street. Map © Google.
Why this score? — see what drove the C+ grade
The composite is a weighted blend of 9 inputs, each scored 0–100. Each bar is that input's sub-score; the figure is the points it added to the 100-point composite (weight × sub-score).
- Cash flow +19.8/30.0
- ARV discount +7.5/15.0
- Appreciation +6.8/10.0
- 1% rule +6.4/10.0
- DSCR +6.3/10.0
- Schools +4.2/10.0
- Livability +4.1/5.0
- Condition / age +4.0/5.0
- Rent growth +3.6/5.0
$620,000
🖨 Deal sheet 📄 Offer letter ✓ Due diligence
Multi-family units
County records classify this as Multi-Family (5+ Unit). Listing-text estimate: 1 unit. estimate disagrees with records
5+ unit building — per-unit beds/baths from public records are typically unavailable; the breakdown below (if shown) is an estimate from the listing text.
Listing remarks
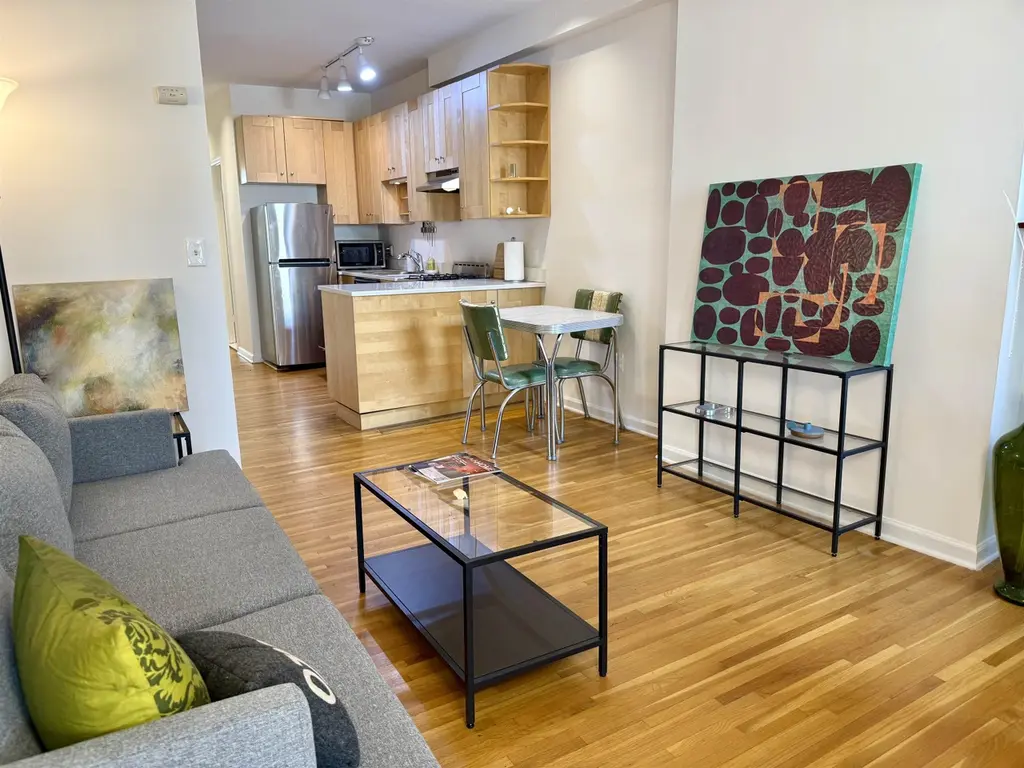
This beautiful condo expands in an open and roomy concept with high ceilings and a spacious feel, and a private one-car garage is included! Hardwood floors throughout and an East/West sun exposure. Large, equally sized bedrooms on opposite sides allow for privacy. The bathroom has been completely remodeled, and the kitchen has newly updated appliances and a countertop. Easy access to the laundry room, storage area, and a huge shared backyard on the lower level. The building is situated on a quiet block, yet just around the corner from restaurants & night-life. Convenient for commuters with the first bus stop going into NYC around the corner (first seat opportunities). Straight-shot up
Key facts
- Huge shared backyard
- Quiet block
- $540 HOA
Tags
Neighborhood map
What this means for you Summary
Snapshot
- This is a 2-bed/1.0-bath multifamily listed at $620k. Condition is rated good.
Deal economics
- At list price, monthly cash flow is $737 ($9k/yr) — positive.
- The deal already cash-flows at list — no discount required.
- Meets the 1% rule at list price ($7k rent vs $620k).
- Recommended offer: $611k (1.5% below list) — sets the bar for market timing.
- Cap rate 7.7% vs local median 1.5% in Hoboken — top-decile yield for the area; either an underpriced asset or a hidden risk that comps aren't pricing in. Stress-test before assuming the spread holds.
Location & tenants
- Location reads 82/100 on livability (#42 in NJ, #1,064 nationally) — a professional / high-income tenant draw. Strengths: schools A+, amenities A+, commute A+; Watch: cost of living F.
- Hoboken Public School District (suburban): math 36% / reading 47% proficiency, ranked #168 of 472 in NJ (top 36%) — families likely to look elsewhere, expect single-tenant / working-renter base with shorter leases.
- Market conditions: Rents rising fast (+4.4%/yr); 325 active listings in the ZIP; 40 comparable units currently listed for rent nearby; rentals at typical pace (median 17d on market — plan ~3-4 weeks tenant-placement turnaround); high-income renter base; 5,310 units permitted in Hudson County in 2024 (4,154 in 5+ unit buildings).
- At $7,040/mo this rent would consume 47% of the median local household income ($181k/yr) (locally 2533% of renters already pay >50% of income on rent) — very limited rent-growth headroom before tenants either downsize or default.
Forward outlook
- In year one you build about $27k of equity ($4k loan paydown + $23k appreciation (3.6% local appreciation)).
- Hudson County population projected at +29% by 2050 — long-run rental-demand tailwind backs the buy-and-hold thesis.
- At projected returns (3.6% appreciation + 4.4% rent growth), your $174k cash investment doubles in ~5 years — after that, you're playing with house money.
- By year 2, paydown + projected appreciation supports a ~$43k cash-out refi (75% LTV) — recoverable capital for the next deal without selling this one.
Negotiation context
- It's been on market 18 days — a 2% lower offer ($611k) is reasonable based on typical stale-listing flexibility.
- 2 sale attempts since 2y ago with the ask held roughly flat each time — persistent listings suggest the price (not the market) is what's stuck; bring a comps-based counter.
Questions for the listing agent
- What does the HOA fee cover, when was the last increase, and are there any pending special assessments or reserve-fund shortfalls?
- Is there a deadline driving the sale (1031 exchange, divorce, estate, relocation)? That informs how much negotiation room exists.
- Schools are A-rated — typically a magnet for longer-tenancy family renters. What's the average tenant stay here, and is there a school-zone premium baked into asking?
- What's the average days-on-market for RENTAL listings here right now (not sales)? A rising rental-DOM trend means longer vacancies and softer asking-rent achievability than the comps imply.
- What's the recent tenant-quality profile in this submarket — average credit score on applications, eviction rate, late-payment / NSF rate, and stable-employment percentage? A property-management company in the area should have these aggregated.
- How much new apartment / multifamily construction is in the pipeline within 1–3 miles? Heavy new supply (>2% of stock underway) typically softens rents 12–24 months out; light construction supports rent growth.
Investment metrics
- 1% rule
- 1.14% ✓
- Cap rate
- 7.72%
- Cash-on-cash
- 5.09%
- DSCR
- 1.23
- GRM
- 7.3
CMA / ARV
No comps found within radius.
Projected returns pro-forma
3.63% appreciation · 4.41% rent growth · sell at horizon
- IRR
- 14.8%
- Equity multiple
- 1.88×
- Total profit
- $153,260
- Equity at exit
- $301,195
- IRR
- 16.9%
- Equity multiple
- 3.71×
- Total profit
- $470,652
- Equity at exit
- $482,415
Cash invested: $173,600 (down + closing). Projections, not guarantees.
Landlord ↔ Tenant lean methodology
- Overall (STATE)
- 21 Tenant-Leaning
- State New Jersey
- 21 Tenant-Leaning · D+6
- County
- — inherits STATE
- City
- — inherits STATE
ZIP-level market 07030
- Home prices YoY
- 1.3%
- Rents YoY
- 4.4%
- Active inventory
- 325
- Price-to-rent
- 14.7×
Monthly cashflow live
- Estimated rent
- $7,040 high interval (Pro) →
- Mortgage (P&I)
- −$3,251
- Tax est. 1.5%
- −$775 /mo · $9,300/yr
- Insurance
- −$258
- HOA
- −$540
- Vacancy / Maint / Mgmt
- −$1,478
- Net cashflow
- $737
Break-even live
2-unit breakdown (identical units grouped — click to expand)
| Units | Beds | Baths | Est. rent |
|---|---|---|---|
| 2× units | 2 | 1 | $7,040 |
| #1 | 2 | 1 | $3,520 |
| #2 | 2 | 1 | $3,520 |
| Total (2 units) | $7,040 | ||
UW: 25.0% down · 7.5% · 30yr · 1.5% tax · 5.0% vac · 8.0% maint · 8.0% mgmt
Financing live
Cash to close
- Down payment
- $155,000
- Closing costs
- $18,600
- Reserves months
- —
- Total cash needed
- —
Loan-product check · same deal, 3 products live
Conventional
25% down · 7.5% · 30yr
- Down + closing
- —
- Monthly P&I
- —
- Monthly cashflow
- —
- DSCR
- —
- Eligible?
- —
Personal DTI + credit; lowest rate.
DSCR
20% down · 8.5% · 30yr
- Down + closing
- —
- Monthly P&I
- —
- Monthly cashflow
- —
- DSCR
- —
- Eligible?
- —
No personal income docs; deal must DSCR.
Hard money
10% down · 12.0% · 12mo
- Down + closing
- —
- Monthly P&I
- —
- Monthly cashflow
- —
- DSCR
- —
- Eligible?
- —
Short-term bridge; refi at stabilization.
Rent comps 40 comps
| Address | Beds | Baths | Sqft | Rent | $/sqft | DOM | Units | Dist |
|---|---|---|---|---|---|---|---|---|
| 367 1st St #2 Hoboken, NJ | 1.0 | 1.0 | 650 | $3,350 | $5.15 | 3d | 1 | 0.10mi |
| 360 1st St #3 Hoboken, NJ | 1.0 | 1.0 | 660 | $3,350 | $5.08 | 7d | 1 | 0.11mi |
| 360 1st St #3 Hoboken, NJ | 1.0 | 1.0 | 660 | $3,350 | $5.08 | 21d | 1 | 0.11mi |
| 132 Adams St #2 Hoboken, NJ | 1.0 | 1.0 | 533 | $2,900 | $5.44 | 1d | 1 | 0.13mi |
| 131 Madison St Unit 1L Hoboken, NJ | 1.0 | 1.0 | 610 | $2,750 | $4.51 | 13d | 1 | 0.14mi |
| 606 1st St #8 Hoboken, NJ | 1.0 | 1.0 | 630 | $2,800 | $4.44 | 24d | 1 | 0.16mi |
| 120 Monroe St Unit 3R Hoboken, NJ | 1.0 | 1.0 | 573 | $2,350 | $4.10 | 7d | 1 | 0.17mi |
| 218 Madison St Unit 2FS Hoboken, NJ | 1.0 | 1.0 | 738 | $3,650 | $4.95 | 20d | 1 | 0.21mi |
| 226 Jefferson St Unit 1N Hoboken, NJ | 1.0 | 1.0 | 490 | $2,500 | $5.10 | 24d | 1 | 0.21mi |
| 224 Madison St Unit 1B Hoboken, NJ | 2.0 | 1.0 | 590 | $3,550 | $6.02 | 14d | 1 | 0.22mi |
| 68 Park Ave #8 Hoboken, NJ | 1.0 | 1.0 | 700 | $3,300 | $4.71 | 6d | 1 | 0.22mi |
| 300 Grand St Hoboken, NJ | 1.0 | 1.0–1.5 | 625 | $4,495 | $7.19 | 18d | 1 | 0.24mi |
| 77 Park Ave Hoboken, NJ | 3.0 | 1.0–2.0 | 1037 | $5,614 | $5.41 | 1d | 11 | 0.26mi |
| 318 Jefferson St Unit 3L Hoboken, NJ | 1.0 | 1.0 | 600 | $2,150 | $3.58 | 21d | 1 | 0.28mi |
| 71 Garden St Unit 02 Hoboken, NJ | 1.0 | 1.0 | 680 | $3,400 | $5.00 | 24d | 1 | 0.29mi |
| 51 Garden St Hoboken, NJ | 1.0–2.0 | 1.0 | 724 | $5,335 | $7.36 | 1d | 6 | 0.29mi |
| 320 Madison St #5 Hoboken, NJ | 2.0 | 1.0 | 550 | $3,250 | $5.91 | 24d | 1 | 0.29mi |
| 159 Newark St Unit 3D Hoboken, NJ | 1.0 | 1.0 | 618 | $3,550 | $5.74 | 24d | 1 | 0.30mi |
| 407 4th St Unit 4L (7) Hoboken, NJ | 1.0 | 1.0 | 700 | $2,675 | $3.82 | 24d | 1 | 0.31mi |
| 327 Jackson St Hoboken, NJ | 1.0 | 1.0 | 600 | $2,050 | $3.42 | 19d | 2 | 0.33mi |
| 327 Jackson St Unit 13 Hoboken, NJ | 1.0 | 1.0 | 650 | $2,100 | $3.23 | 14d | 1 | 0.34mi |
| 207 3rd St Unit 3 Hoboken, NJ | 1.0 | 1.0 | 600 | $2,360 | $3.93 | 3d | 1 | 0.34mi |
| 111 Bloomfield St Unit 1 Hoboken, NJ | 1.0 | 1.0 | 650 | $3,395 | $5.22 | 24d | 1 | 0.34mi |
| 421 Adams St Unit 2L Hoboken, NJ | 1.0 | 1.0 | 560 | $2,800 | $5.00 | 24d | 1 | 0.37mi |
| 412 Monroe St #2 Hoboken, NJ | 1.0 | 1.0 | 700 | $3,700 | $5.29 | 16d | 1 | 0.38mi |
| 3 New York Ave Jersey City, NJ | 3.0 | 1.0–2.0 | 1155 | $6,352 | $5.50 | 2d | 9 | 0.39mi |
| 416 Monroe St Apt 1R Hoboken, NJ | 1.0 | 1.0 | 725 | $3,200 | $4.41 | 3d | 1 | 0.39mi |
| 300 Washington St Unit 4B Hoboken, NJ | 1.0 | 1.0 | 725 | $3,900 | $5.38 | 20d | 1 | 0.42mi |
| 509 Monroe St Unit 3L Hoboken, NJ | 1.0 | 1.0 | 502 | $2,550 | $5.08 | 24d | 1 | 0.43mi |
| 509 Monroe St Unit 4R Hoboken, NJ | 1.0 | 1.0 | 502 | $2,550 | $5.08 | 17d | 1 | 0.43mi |
| 509 Monroe St Unit 4R Hoboken, NJ | 1.0 | 1.0 | 502 | $2,600 | $5.18 | 24d | 1 | 0.43mi |
| 41 1st St Unit 2G Hoboken, NJ | 1.0 | 1.0 | 614 | $3,199 | $5.21 | 7d | 1 | 0.44mi |
| 519 Monroe St Unit 3B Hoboken, NJ | 2.0 | 1.0 | 733 | $4,200 | $5.73 | 14d | 1 | 0.45mi |
| 116 Ogden Ave Unit 1A Jersey City, NJ | 1.0 | 1.0 | 642 | $2,600 | $4.05 | 2d | 1 | 0.46mi |
| 326 Washington St Unit 4B Hoboken, NJ | 1.0 | 1.0 | 750 | $3,000 | $4.00 | 24d | 1 | 0.46mi |
| 519 Willow Ave #3 Hoboken, NJ | 2.0 | 1.0 | 684 | $3,350 | $4.90 | 20d | 1 | 0.47mi |
| 533 Monroe St Unit 4D Hoboken, NJ | 1.0 | 1.0 | 620 | $2,500 | $4.03 | 24d | 1 | 0.48mi |
| 11 Cuneo Pl Unit 3B Jersey City, NJ | 1.0 | 1.0 | 450 | $2,000 | $4.44 | 5d | 1 | 0.50mi |
| 273 16th St Jersey City, NJ | 3.0 | 1.0–3.0 | 1136 | $5,148 | $4.53 | 1d | 26 | 0.50mi |
| 332 Hudson St Unit 3 Hoboken, NJ | 1.0 | 1.0 | 750 | $3,200 | $4.27 | 17d | 1 | 0.52mi |
HOA detail
- Monthly dues
- $540 · $6,480/yr
Listing history 4 events
-
2026-05-04status Under Contract
-
2026-04-16$620,000 Active
-
2024-05-21historical $3,700
-
2024-03-29$3,700
ⓘ Source: listings_history table (triggers on properties + properties_extension) + one-shot
backfill from property_details.listing_events for pre-trigger history.
Nearby sold comps map
Loading sold comps map…
Walkable amenities ~0.75 mi
Loading nearby amenities…
Taxation est. · year 1
- Rental income
- $84,480
- − Mortgage interest
- −$34,730
- − Property taxes
- −$9,300
- − Insurance
- −$3,100
- − Repairs & maintenance
- −$6,758
- − Management
- −$6,758
- − HOA
- −$6,480
- − Depreciation
- −$18,036
- Taxable loss
- −$683
- Est. tax savings @ 24.0%
- +$164
- After-tax cash flow
- $9,007/yr
For passive investors: Depreciation is non-cash, so a rental often shows a tax loss while cash-flowing — sheltering income. Rental losses are passive: they offset passive income freely, and up to $25,000/yr can offset ordinary (W-2) income if you actively participate and your MAGI is under $100k (phasing out to $0 by $150k); unused losses carry forward. On sale, claimed depreciation is recaptured at up to 25%, and gains may owe capital-gains tax (a 1031 exchange can defer both). Figures are a year-1 estimate at your 24.0% rate — not tax advice; consult a CPA.
Condition & rehab AI · 12 photos
This well-maintained, open-concept condo with hardwood floors and updated kitchen and bathroom is ready for a fresh coat of paint and some minor updates to enhance its curb appeal and interior aesthetics.
Value-add opportunities
- Both Paint interior walls — Neutral paint can be updated to enhance curb appeal and interior aesthetics
- Both Replace cushions on couch — Worn cushions can detract from the overall appearance and comfort
- Both Add throw pillows to bed — Fresh pillows can improve the look and comfort of the bedroom
- Resale Replace kitchen faucet — A new faucet can enhance the kitchen's appearance and functionality
- Resale Replace kitchen light fixture — A modern light fixture can improve the kitchen's ambiance and value
Renovation cost estimate screening
Value-add ROI direction
- Both Paint interior walls — Neutral paint can be updated to enhance curb appeal and interior aesthetics ↑
- Both Replace cushions on couch — Worn cushions can detract from the overall appearance and comfort ↑
- Both Add throw pillows to bed — Fresh pillows can improve the look and comfort of the bedroom ↑
- Resale Replace kitchen faucet — A new faucet can enhance the kitchen's appearance and functionality ↑
- Resale Replace kitchen light fixture — A modern light fixture can improve the kitchen's ambiance and value ↑
ⓘ Cost ranges are severity-bucket heuristics (US national rule-of-thumb). Get contractor quotes + a written scope before underwriting a rehab budget.
Schools (NCES district)
- District
- Hoboken Public School District
- NCES district ID
- 3407350
- Math proficiency
- 36% ▲ 3.00%
- Reading proficiency
- 47% ▼ -7.00%
- Median HH income
- $112,905
- Composite
- 41.71/100
- National rank
- #3407
- State rank
- #168 of 472 in NJ
Livability — Hoboken
- Score
- 82/100
- State rank
- #42
- US rank
- #1064
Category grades
Schools grade is shown separately in the Schools card above.
Census & demographics
- Census place
- Hoboken, NJ
- County
- Hudson County · 718,323 people
- City population
- 58,668
- Metro
- New York-Newark-Jersey City, NY-NJ-PA
- Population (ZIP)
- 58,668
- Household income
- $180,579
- Rent vs Own
- Severe rent burden
- 2533.0
Population outlook (Hudson County) Hauer SSP2
- Today (2025)
- 771,834 people
- By 2030
- 818,028 · +6.0%
- By 2040
- 907,866 · +17.6%
- By 2050
- 994,480 · +28.8%
- By 2075
- 1,163,301 · +50.7%
- By 2100
- 1,254,703 · +62.6%
Race, ethnicity, and origin ACS 2023
- Neighborhood character
- Majority White (65%)
- Race & ethnicity
- White 65% Hispanic / Latino 14% Asian 13% Two or more races 11% Black 4%
- Hispanic origin (detail)
- Mexican 1% Puerto Rican 5% Dominican 2%
- Common ancestry
- Romanian 5% Scotch-Irish 3% Lithuanian 2%
- Foreign-born
- 19% · Canada, China, South Korea
- Languages at home
- 74% English-only · Spanish 10% Other Indo-European 5% Chinese 3%
Political lean MEDSL · Hudson
- 2024 margin
- Strong D (+28.1) · D 62.6% · R 34.6% · Other 2.8%
- 2008→2024 swing
- -18.7pp toward R · 2008: 46.7pp · 2024: 28.1pp
- All cycles
- 2024: D+28.1 2020: D+46.2 2016: D+51.8 2012: D+55.7 2008: D+46.7
Not yet ingested
- Civics
- —
Market trends
- HPI YoY
- ▲ 3.63%
- Current HPI
- 290.9806
- Rent YoY
- ▲ 4.41%
- Metro
- New York-Newark-Jersey City, NY-NJ-PA
- State GDP YoY
- ▲ 2.05%
- F500 in state
- 34
Industry mix (Fortune 500 HQ in NJ)
| Industry | F500 HQs | Revenue |
|---|---|---|
| Consumer Goods | 3 | $31B |
|
||
| Pharmaceuticals | 2 | $153B |
|
||
| Technology | 2 | $21B |
|
||
| Insurance | 2 | $20B |
|
||
| Healthcare | 2 | $19B |
|
||
| Financial Services | 1 | $70B |
|
||
Price history
+16656.8% since first listed4 events — show timeline
- 2026-05-04 Pending — HCMLS
- 2026-04-16 Listed $620,000 HCMLS
- 2024-05-21 Rental Removed $3,700 HCMLS
- 2024-03-29 Listed for Rent $3,700 HCMLS
Cash-flow waterfall
monthlySold comps — $/sqft
last 12 mo · ≤1 miLoading sold comps…