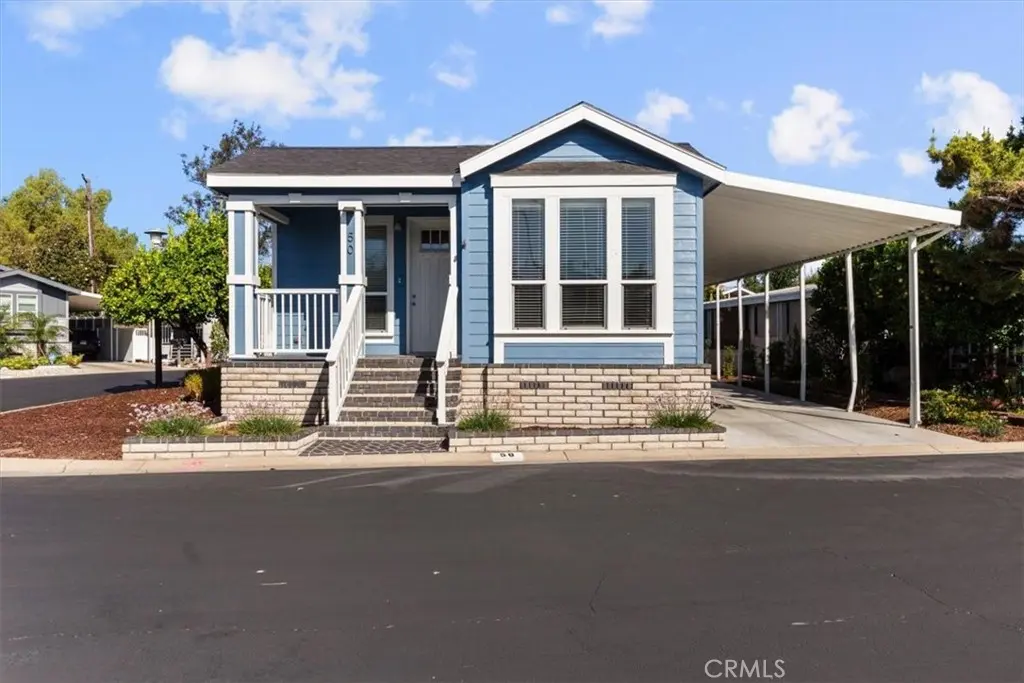
15111 Pipeline Ave #50 · Chino Hills, CA
Flood risk 4/10 · Minor
- FEMA flood zone
- X (unshaded)
- Chance of flooding over 30 yrs
- 0.22%
- Est. flood insurance / yr
- $507 – $1,088
Fire risk 5/10 · Moderate
- Est. fire insurance / yr
- $659 – $1,223
Heat risk 7/10 · Major
- Hot days now (above 100°F)
- 6 days/yr
- Hot days in 30 yrs
- 16 days/yr
Wind risk 1/10 · Minimal
- Chance of severe wind over 30 yrs
- —
Air-quality risk 7/10 · Major
- Unhealthy air days now
- 15 days/yr
- Unhealthy air days in 30 yrs
- 17 days/yr
Risk factors via First Street. Map © Google.
Why this score? — see what drove the B- grade
The composite is a weighted blend of 9 inputs, each scored 0–100. Each bar is that input's sub-score; the figure is the points it added to the 100-point composite (weight × sub-score).
- Cash flow +30.0/30.0
- DSCR +10.0/10.0
- 1% rule +8.7/10.0
- Schools +5.0/10.0
- Condition / age +4.0/5.0
- Livability +3.4/5.0
- ARV discount +3.0/15.0
- Rent growth +2.6/5.0
- Appreciation +0.0/10.0
$259,900
🖨 Deal sheet 📄 Offer letter ✓ Due diligence
Listing remarks
Welcome to beautiful Lake Los Serranos! This stunning newer manufactured home offers the perfect blend of modern luxury, comfort, and thoughtful design in one of Chino Hills’ most desirable 55+ communities. From the moment you step inside, you will notice the bright open-concept floor plan, abundant natural light, recessed lighting, and upscale finishes throughout. The spacious gourmet kitchen is a true showpiece featuring rich dark cabinetry, quartz countertops, stainless steel appliances, custom tile backsplash, large center island with additional storage, built-in microwave, and a sleek modern vent hood — ideal for entertaining or everyday living. The adjoining living and din
Key facts
- Dual-pane windows
- Gourmet kitchen
- Walking paths
Tags
Property features AI
Finance
- Other: Manager approval may be required; Pets allowed with breed restrictions
- Financial info: Land lease noted (monthly)
- HOA & community: Senior community; Park name: Lake Los Serranos; Community features include fishing, lake access, street lighting and sidewalks; Land lease $1,500 monthly (park-provided)
Exterior
- Parking: Covered tandem carport (attached) with 2 spaces
- Security: Resident manager (on-site management)
- Utilities: Standard electric service; Natural gas connected; Public (district) water connected; Public sewer connected; Cable available
- Home design: Single-story home; Entry on the south side; Faces east; Entry level: 1; Mobile home model: PACIFICA; Mobile home remains (23' x 56'); Turnkey condition
- Construction: Built with cement board and lap siding; Composition shingle roof; Raised permanent foundation with quake bracing and pier jacks
- Exterior features: Front porch and deck; Lighting; Porch and deck present; In-ground fenced community lap pool (gunite); Shed (one); Landscaped yard with front and back yard; Sprinkler system; Corner lot; Has view
Interior
- Kitchen: Kitchen open to family room; Kitchen island; Corian countertops; Pots & pan drawers; Self-closing cabinet doors; Garbage disposal; Microwave; Refrigerator; Gas range and gas oven; Dishwasher; Water line to refrigerator; Gas water heater
- Bedrooms: All bedrooms on main floor; Main floor primary bedroom; Primary suite; Walk-in closet(s)
- Flooring: Carpet; Laminate
- Bathrooms: Two full bathrooms; Shower in tub; Walk-in shower; Double sinks in primary bath
- Heating & cooling: Central heating (forced air / central furnace) on natural gas; Central cooling; Whole house fan; High-efficiency system
- Interior features: Crown moldings; Wired for data; Trey ceilings; Corian counters; Unfurnished; High (9+ foot) ceilings; Ceiling fans; Recessed lighting; Open floor plan; Double pane windows with screens; Resident manager; In-ground community gunite spa
- Laundry & utility: Laundry inside in a dedicated room; Washer and dryer included; Gas & electric dryer hookup
Neighborhood map
What this means for you Summary
Snapshot
- This is a 3-bed/2.0-bath manufactured listed at $260k. Condition is rated good.
Deal economics
- At list price, monthly cash flow is $1k ($15k/yr) — positive.
- The deal already cash-flows at list — no discount required.
- Meets the 1% rule at list price ($4k rent vs $260k).
- Recommended offer: $252k (3.0% below list) — sets the bar for market timing.
- Cap rate 12.2% vs local median 2.1% in Chino Hills — top-decile yield for the area; either an underpriced asset or a hidden risk that comps aren't pricing in. Stress-test before assuming the spread holds.
Location & tenants
- Location reads 68/100 on livability (#299 in CA) — a middle-class / working-renter tenant base. Strengths: employment A+, schools A, crime A; Watch: health & safety D, commute F, cost of living F.
- Chino Valley Unified (suburban): math 46% / reading 58% proficiency, ranked #334 of 1,400 in CA (top 24%) — acceptable for families but not a draw, mixed tenant base, ~2y average lease.
- Market conditions: Rents flat; 187 active listings in the ZIP; 18 comparable units currently listed for rent nearby; rentals at typical pace (median 22d on market — plan ~3-4 weeks tenant-placement turnaround); 44% of comp listings sitting > 30 days — soft ceiling on asking rent; high-income renter base; 5,458 units permitted in San Bernardino County in 2024 (1,500 in 5+ unit buildings).
- This rent runs 34% of the median local income ($126k/yr) — at the standard rent-burdened threshold; future hikes will face affordability resistance.
Forward outlook
- Local home prices are declining (-3.0%/yr); year-one equity from $2k of loan paydown is wiped out by about $8k of value loss. Plan a longer hold.
- San Bernardino County population projected at +15% by 2050 — modest demand growth; plan on rents tracking national, not racing it.
- At projected returns (-3.0% appreciation + 0.2% rent growth), your $73k cash investment doubles in ~7 years — after that, you're playing with house money.
Negotiation context
- It's been on market 34 days — a 3% lower offer ($252k) is reasonable based on typical stale-listing flexibility.
- 2 sale attempts with the ask held roughly flat each time — persistent listings suggest the price (not the market) is what's stuck; bring a comps-based counter.
Risks & watch-outs
- Climate carrying-cost: moderate wildfire risk; extreme-heat days projected 6→16/yr by 2055 (HVAC capex compounding) — expect insurance premiums to compound above CPI over the hold.
Questions for the listing agent
- It's been on market 34 days. Have you received any prior offers? Is the seller open to a 3% concession, seller financing, or rate buy-down credit?
- Is there a deadline driving the sale (1031 exchange, divorce, estate, relocation)? That informs how much negotiation room exists.
- Schools are A-rated — typically a magnet for longer-tenancy family renters. What's the average tenant stay here, and is there a school-zone premium baked into asking?
- What's the average days-on-market for RENTAL listings here right now (not sales)? A rising rental-DOM trend means longer vacancies and softer asking-rent achievability than the comps imply.
- What's the recent tenant-quality profile in this submarket — average credit score on applications, eviction rate, late-payment / NSF rate, and stable-employment percentage? A property-management company in the area should have these aggregated.
- How much new for-sale + rental construction is in the pipeline within 1–3 miles? Heavy new supply typically softens prices + rents 12–24 months out; constrained supply supports both.
Investment metrics
- 1% rule
- 1.37% ✓
- Cap rate
- 12.16%
- Cash-on-cash
- 20.96%
- DSCR
- 1.93
- GRM
- 6.1
CMA / ARV
- ARV (median comp)
- $236,450
- List price
- $259,900
- Delta
- 9.92%
- Verdict
- FAIR
- Comps
- 14 within 1.0 mi
Show comp detail 12 sales within ~0.75 mi
| Address | Dist | Beds/Ba | Sqft | Sold | Price | $/sf | Match |
|---|---|---|---|---|---|---|---|
| 15111 Pipeline #64 | 0.00mi | 3/2.0 | 1,245 (-2%) | 3mo | $280,000 | $225 | 94 |
| 15111 Pipeline Ave #274 | 0.00mi | 3/2.0 | 1,336 (+5%) | 3mo | $260,000 | $195 | 89 |
| 15111 Pipeline Ave #158 | 0.00mi | 3/2.0 | 1,344 (+6%) | 4mo | $260,000 | $193 | 87 |
| 15111 Pipeline Ave #75 | 0.00mi | 2/2.0 (-1) | 1,283 (+1%) | 15mo | $255,000 | $199 | 81 |
| 15111 PIPELINE Unit SP 281 | 0.00mi | 2/2.0 (-1) | 1,344 (+6%) | 7mo | $119,900 | $89 | 80 |
| 15111 Pipeline Ave #115 | 0.00mi | 2/2.0 (-1) | 1,220 (-4%) | 11mo | $260,000 | $213 | 79 |
| 15111 Pipeline Ave #196 | 0.00mi | 3/2.0 | 1,420 (+12%) | 2mo | $285,000 | $201 | 78 |
| 15111 Pipeline Ave #125 | 0.00mi | 2/2.0 (-1) | 1,200 (-6%) | 10mo | $220,000 | $183 | 77 |
| 15111 Pipeline Ave #66 | 0.00mi | 3/2.0 | 1,404 (+10%) | 12mo | $319,000 | $227 | 73 |
| 15111 Pipeline Ave #204 | 0.00mi | 2/2.0 (-1) | 1,440 (+13%) | 10mo | $143,000 | $99 | 65 |
| 15111 Pipeline Ave #185 | 0.00mi | 2/2.0 (-1) | 1,440 (+13%) | 11mo | $80,000 | $56 | 64 |
| 15111 Pipeline Ave #24 | 0.11mi | 2/2.0 (-1) | 1,440 (+13%) | 9mo | $110,000 | $76 | 60 |
Match score weights: distance 35% · size 25% · config 20% · recency 20%. Top-matched comps best support the ARV.
Projected returns pro-forma
-3.0% appreciation · 0.2% rent growth · sell at horizon
- IRR
- 10.4%
- Equity multiple
- 1.40×
- Total profit
- $28,977
- Equity at exit
- $38,752
- IRR
- 17.3%
- Equity multiple
- 2.25×
- Total profit
- $91,158
- Equity at exit
- $22,471
Cash invested: $72,772 (down + closing). Projections, not guarantees.
Landlord ↔ Tenant lean methodology
- Overall (STATE)
- 18 Strongly Tenant-Friendly
- State California
- 18 Strongly Tenant-Friendly · D+13
- County
- — inherits STATE
- City
- — inherits STATE
ZIP-level market 91709
- Home prices YoY
- -28.5%
- Rents YoY
- 0.2%
- Active inventory
- 187
- Price-to-rent
- 6.1×
Monthly cashflow live
- Estimated rent
- $3,567 high interval (Pro) →
- Mortgage (P&I)
- −$1,363
- Tax from tax record
- −$75 /mo · $904/yr
- Insurance
- −$108
- HOA
- −$0
- Vacancy / Maint / Mgmt
- −$749
- Net cashflow
- $1,271
Break-even live
UW: 25.0% down · 7.5% · 30yr · 1.5% tax · 5.0% vac · 8.0% maint · 8.0% mgmt
Financing live
Cash to close
- Down payment
- $64,975
- Closing costs
- $7,797
- Reserves months
- —
- Total cash needed
- —
Loan-product check · same deal, 3 products live
Conventional
25% down · 7.5% · 30yr
- Down + closing
- —
- Monthly P&I
- —
- Monthly cashflow
- —
- DSCR
- —
- Eligible?
- —
Personal DTI + credit; lowest rate.
DSCR
20% down · 8.5% · 30yr
- Down + closing
- —
- Monthly P&I
- —
- Monthly cashflow
- —
- DSCR
- —
- Eligible?
- —
No personal income docs; deal must DSCR.
Hard money
10% down · 12.0% · 12mo
- Down + closing
- —
- Monthly P&I
- —
- Monthly cashflow
- —
- DSCR
- —
- Eligible?
- —
Short-term bridge; refi at stabilization.
Rent comps 18 comps
| Address | Beds | Baths | Sqft | Rent | $/sqft | DOM | Units | Dist |
|---|---|---|---|---|---|---|---|---|
| 15040 Beechwood Ln Chino Hills, CA | 4.0 | 2.0 | 1640 | $3,600 | $2.20 | 43d | 1 | 0.26mi |
| 4432 Lilac Cir Chino Hills, CA | 3.0 | 3.5 | 1695 | $3,200 | $1.89 | 4d | 1 | 0.35mi |
| 15031 Ashwood Ln Chino Hills, CA | 4.0 | 2.0 | 1800 | $3,500 | $1.94 | 43d | 1 | 0.37mi |
| 4361 Los Serranos Blvd Chino Hills, CA | 3.0 | 2.0 | 1256 | $3,200 | $2.55 | 16d | 1 | 0.42mi |
| 4628 Bird Farm Rd Chino Hills, CA | 3.0 | 2.0 | 1152 | $3,250 | $2.82 | 43d | 1 | 0.57mi |
| 4186 Val Verde Ave Chino Hills, CA | 2.0 | 2.0 | 1000 | $8,000 | $8.00 | 43d | 1 | 0.63mi |
| 15345 Murray Ave Chino Hills, CA | 3.0 | 2.0 | 1527 | $3,395 | $2.22 | 2d | 1 | 0.74mi |
| 3724 Alder Pl Chino Hills, CA | 3.0 | 2.0 | 1240 | $3,600 | $2.90 | 21d | 1 | 0.81mi |
| 15101 Fairfield Ranch Rd Chino Hills, CA | 1.0–3.0 | 1.0–2.0 | 1053 | $3,600 | $3.42 | 1d | 19 | 0.96mi |
| 15447 Pomona Rincon Rd Chino Hills, CA | 3.0 | 2.5 | 1397 | $3,350 | $2.40 | 15d | 2 | 1.01mi |
| 16169 Singing Hills Dr Chino Hills, CA | 3.0 | 2.5 | 1478 | $3,600 | $2.44 | 43d | 1 | 1.26mi |
| 15996 Mihaylo Ct Chino Hills, CA | 3.0 | 2.5 | 1541 | $3,850 | $2.50 | 43d | 1 | 1.31mi |
| 3100 Chino Hills Pkwy Chino Hills, CA | 1.0–3.0 | 1.0–2.0 | 1025 | $4,033 | $3.93 | 1d | 18 | 1.40mi |
| 15583 Oak Springs Rd Chino Hills, CA | 4.0 | 3.0 | 1703 | $3,800 | $2.23 | 15d | 1 | 1.40mi |
| 3099 Oakview Ln Chino Hills, CA | 3.0 | 3.0 | 1640 | $3,500 | $2.13 | 43d | 1 | 1.41mi |
| 15773 High Knoll Dr Chino Hills, CA | 1.0–2.0 | 1.0–2.0 | 778 | $2,999 | $3.85 | 1d | 15 | 1.43mi |
| 14728 Fieldflower Cir Chino Hills, CA | 3.0 | 2.0 | 1700 | $3,800 | $2.24 | 43d | 1 | 1.45mi |
| 15886 Ellington Way Chino Hills, CA | 4.0 | 3.0 | 1848 | $3,300 | $1.79 | 16d | 1 | 1.45mi |
Listing history 13 events
-
2026-06-18days on market $259,900 Active 34 DOM
-
2026-06-17days on market $259,900 Active 33 DOM
-
2026-06-16days on market $259,900 Active 32 DOM
-
2026-06-15days on market $259,900 Active 31 DOM
-
2026-06-13days on market $259,900 Active 29 DOM
-
2026-06-09days on market $259,900 Active 25 DOM
-
2026-06-08pricedays on market $259,900 Active 24 DOM
-
2026-06-04days on market $260,000 Active 22 DOM
-
2026-06-03days on market $260,000 Active 21 DOM
-
2026-06-02days on market $260,000 Active 20 DOM
-
2026-06-01days on market $260,000 Active 19 DOM
-
2026-05-31days on market $260,000 Active 18 DOM
-
2026-05-13$260,000 Active 1791-char remark
ⓘ Source: listings_history table (triggers on properties + properties_extension) + one-shot
backfill from property_details.listing_events for pre-trigger history.
Tax reassessment forecast CA · Resets to sale price
- Current annual tax
- $904 · $75/mo
- Projected year-2 tax
- $1,975 · $165/mo
- Expected delta
- +$1,071/yr (+$89/mo · 118.5%)
ⓘ Screening estimate from a state-policy table — verify with the county assessor before closing.
Climate risk First Street
- Flood 4/10 Moderate FEMA zone X (unshaded) · 22% chance over 30 yrs
- Wildfire 5/10 Major
- Heat 7/10 Severe 6 d/yr ≥100°F today · 16 d/yr by 30 yrs out
- Wind 1/10 Low
- Air quality 7/10 Severe 15 unhealthy d/yr today · 17 by 30 yrs out
Nearby sold comps map
Loading sold comps map…
Walkable amenities ~0.75 mi
Loading nearby amenities…
Taxation est. · year 1
- Rental income
- $42,802
- − Mortgage interest
- −$14,558
- − Property taxes
- −$904
- − Insurance
- −$1,300
- − Repairs & maintenance
- −$3,424
- − Management
- −$3,424
- − Depreciation
- −$7,561
- Taxable income
- $11,631
- Est. tax owed @ 24.0%
- −$2,791
- After-tax cash flow
- $12,463/yr
For passive investors: Depreciation is non-cash, so a rental often shows a tax loss while cash-flowing — sheltering income. Rental losses are passive: they offset passive income freely, and up to $25,000/yr can offset ordinary (W-2) income if you actively participate and your MAGI is under $100k (phasing out to $0 by $150k); unused losses carry forward. On sale, claimed depreciation is recaptured at up to 25%, and gains may owe capital-gains tax (a 1031 exchange can defer both). Figures are a year-1 estimate at your 24.0% rate — not tax advice; consult a CPA.
Condition & rehab AI · 1 photo
This beautiful newer manufactured home in a desirable community is in good condition with minor cosmetic updates needed to enhance its curb appeal and value.
Value-add opportunities
- Both Paint exterior siding — Enhances curb appeal and value
- Resale Replace countertops — Quartz countertops are durable and attractive
- Resale Upgrade appliances — Stainless steel appliances are modern and attractive
Renovation cost estimate screening
Value-add ROI direction
- Both Paint exterior siding — Enhances curb appeal and value ↑
- Resale Replace countertops — Quartz countertops are durable and attractive ↑
- Resale Upgrade appliances — Stainless steel appliances are modern and attractive ↑
ⓘ Cost ranges are severity-bucket heuristics (US national rule-of-thumb). Get contractor quotes + a written scope before underwriting a rehab budget.
Schools (NCES district)
- District
- Chino Valley Unified
- NCES district ID
- 0608460
- Math proficiency
- 46% ▲ 1.00%
- Reading proficiency
- 58% ▲ 1.00%
- Median HH income
- $83,575
- Composite
- 49.56/100
- National rank
- #4275
- State rank
- #334 of 1400 in CA
Livability — Chino Hills
- Score
- 68/100
- State rank
- #299
- US rank
- #9993
Category grades
Schools grade is shown separately in the Schools card above.
Census & demographics
- Census place
- Chino Hills, CA
- County
- San Bernardino County · 2,030,291 people
- City population
- 78,006
- Metro
- Riverside-San Bernardino-Ontario, CA
- Population (ZIP)
- 78,006
- Household income
- $126,350
- Rent vs Own
- Severe rent burden
- 1964.0
Population outlook (San Bernardino County) Hauer SSP2
- Today (2025)
- 2,300,329 people
- By 2030
- 2,378,907 · +3.4%
- By 2040
- 2,523,137 · +9.7%
- By 2050
- 2,642,388 · +14.9%
- By 2075
- 2,880,769 · +25.2%
- By 2100
- 2,909,436 · +26.5%
Race, ethnicity, and origin ACS 2023
- Neighborhood character
- Highly diverse neighborhood (Simpson 0.70)
- Race & ethnicity
- Asian 40% Hispanic / Latino 28% White 24% Two or more races 14% Black 5%
- Hispanic origin (detail)
- Mexican 22%
- Common ancestry
- Italian 2% Lithuanian 1% Romanian 1%
- Foreign-born
- 33% · China, Canada, South Korea
- Languages at home
- 52% English-only · Chinese 18% Spanish 14% Tagalog/Filipino 5%
Political lean MEDSL · San Bernardino
- 2024 margin
- Toss-up / Even · D 47.5% · R 49.7% · Other 2.8%
- 2008→2024 swing
- -8.5pp toward R · 2008: 6.3pp · 2024: -2.1pp
- All cycles
- 2024: R+2.1 2020: D+10.7 2016: D+9.8 2012: D+5.4 2008: D+6.3
Not yet ingested
- Civics
- —
Market trends
- HPI YoY
- ▼ -152.62%
- Current HPI
- 383.5042
- Rent YoY
- ▲ 0.20%
- Metro
- Riverside-San Bernardino-Ontario, CA
- State GDP YoY
- ▲ 3.21%
- F500 in state
- 116
Industry mix (Fortune 500 HQ in CA)
| Industry | F500 HQs | Revenue |
|---|---|---|
| Technology | 27 | $1,492B |
|
||
| Financial Services | 3 | $174B |
|
||
| Retail | 3 | $44B |
|
||
| Insurance | 3 | $26B |
|
||
| Media / Entertainment | 2 | $115B |
|
||
| Pharmaceuticals / Biotech | 2 | $62B |
|
||
Price history
-0.0% since first listed3 events — show timeline
- 2026-06-08 Relisted — CRMLS
- 2026-06-08 Price Changed $259,900 CRMLS
- 2026-05-13 Listed $260,000 CRMLS
Property tax history
+0.6%/yrLatest (2025): $904 · +0.7% YoY. Source: county tax records.
Cash-flow waterfall
monthlySold comps — $/sqft
last 12 mo · ≤1 miLoading sold comps…