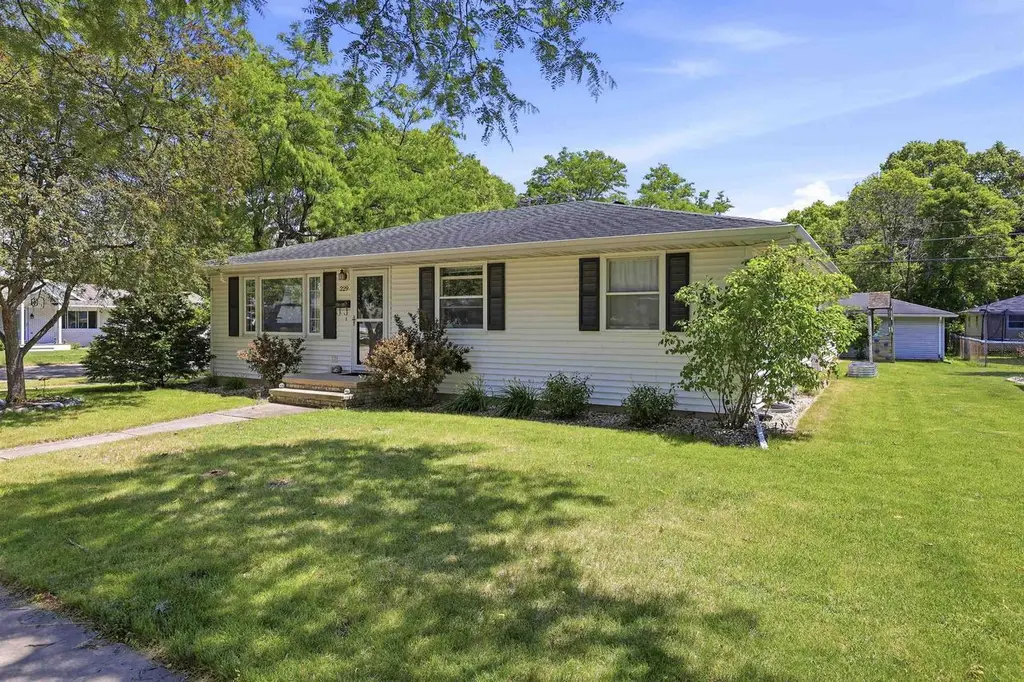
229 Paul Dr · Kimberly, WI
Flood risk 1/10 · Minimal
- FEMA flood zone
- X (unshaded)
- Chance of flooding over 30 yrs
- 0.0%
- Est. flood insurance / yr
- $473 – $860
Fire risk 1/10 · Minimal
- Est. fire insurance / yr
- $636 – $1,182
Heat risk 2/10 · Minimal
- Hot days now (above 98°F)
- 7 days/yr
- Hot days in 30 yrs
- 12 days/yr
Wind risk 2/10 · Minimal
- Chance of severe wind over 30 yrs
- —
Air-quality risk 3/10 · Minor
- Unhealthy air days now
- 2 days/yr
- Unhealthy air days in 30 yrs
- 3 days/yr
Risk factors via First Street. Map © Google.
Why this score? — see what drove the B grade
The composite is a weighted blend of 9 inputs, each scored 0–100. Each bar is that input's sub-score; the figure is the points it added to the 100-point composite (weight × sub-score).
- Cash flow +30.0/30.0
- 1% rule +10.0/10.0
- DSCR +10.0/10.0
- ARV discount +7.5/15.0
- Schools +5.0/10.0
- Livability +4.4/5.0
- Rent growth +2.5/5.0
- Condition / age +2.5/5.0
- Appreciation +0.0/10.0
$310,000
🖨 Deal sheet 📄 Offer letter ✓ Due diligence
Listing remarks
OPEN HOUSE SAT 6/20 11-12:30PM Move right into this beautifully updated 3-bedroom, 1.5-bath home in the heart of Kimberly! Every improvement has been made with care, creating a warm and welcoming space that's ready to enjoy from day one. The home's thoughtful remodeling and excellent maintenance make ownership easy, while the practical floor plan offers comfortable spaces for everyday living and entertaining. Located near parks, schools, and the community pool, you'll appreciate the convenience of this established neighborhood. From its attractive updates to its fantastic location within the Kimberly School District, this home is one you won't want to miss. Basement concrete floor is painte
Key facts
- Near schools
- Practical floor plan
- Updated home
Tags
Property features AI
Exterior
- Parking: Detached 2-car garage (total 2 garage spaces)
- Utilities: Municipal water; Municipal sewer; Natural gas service
- Home design: Single-family home; One-story design; Construction completed
- Construction: Finished above-grade area and finished below-grade area (finished below grade ~622); Information source lists year built from assessor/public record
- Exterior features: Vinyl exterior; Lot size approximately 0.17 acres; Zoned residential
Interior
- Kitchen: Dishwasher; Freezer; Microwave; Range/Oven; Refrigerator; Kitchen on main level (17 x 12)
- Bedrooms: Main level master bedroom (11 x 10); Main level bedroom 2 (11 x 10); Main level bedroom 3 (11 x 10)
- Bathrooms: One full bathroom; One half bathroom
- Heating & cooling: Forced air heating (natural gas); Central air conditioning
- Interior features: Finished full basement with poured concrete, sump pump, and finished spaces; Family room on main level; Den/office on lower level
Neighborhood map
What this means for you Summary
Snapshot
- This is a 3-bed/1.5-bath other listed at $310k.
Deal economics
- At list price, monthly cash flow is $2k ($24k/yr) — positive.
- The deal already cash-flows at list — no discount required.
- Meets the 1% rule at list price ($5k rent vs $310k).
- Cap rate 13.9% vs local median 3.4% in Kimberly — top-decile yield for the area; either an underpriced asset or a hidden risk that comps aren't pricing in. Stress-test before assuming the spread holds.
Location & tenants
- Location reads 88/100 on livability (#14 in WI, #182 nationally) — a professional / high-income tenant draw. Strengths: commute A+, cost of living A+, housing A+; Watch: amenities D.
- Kimberly Area School District (suburban): math 61% / reading 52% proficiency, ranked #26 of 342 in WI (top 8%) — acceptable for families but not a draw, mixed tenant base, ~2y average lease; only 10% free/reduced lunch — higher-income household profile.
- Market conditions: 11 active listings in the ZIP; 2 comparable units currently listed for rent nearby; 460 units permitted in Outagamie County in 2024 (30 in 5+ unit buildings).
Forward outlook
- Local home prices are declining (-3.0%/yr); year-one equity from $2k of loan paydown is wiped out by about $9k of value loss. Plan a longer hold.
- Outagamie County population projected at +8% by 2050 — modest demand growth; plan on rents tracking national, not racing it.
- At projected returns (-3.0% appreciation + 3.0% rent growth), your $87k cash investment doubles in ~5 years — after that, you're playing with house money.
Negotiation context
- Only 1 days on market — expect competitive offers; lowballing is unlikely to land.
- Current owner paid $250k; 24% above their basis — modest negotiation headroom, anchor on the comps not their cost.
Questions for the listing agent
- Built in 1972 — when were the roof, HVAC, electrical panel, plumbing, and water heater last replaced?
- Is there a deadline driving the sale (1031 exchange, divorce, estate, relocation)? That informs how much negotiation room exists.
- Schools are B-rated — typically a magnet for longer-tenancy family renters. What's the average tenant stay here, and is there a school-zone premium baked into asking?
- What's the average days-on-market for RENTAL listings here right now (not sales)? A rising rental-DOM trend means longer vacancies and softer asking-rent achievability than the comps imply.
- What's the recent tenant-quality profile in this submarket — average credit score on applications, eviction rate, late-payment / NSF rate, and stable-employment percentage? A property-management company in the area should have these aggregated.
- How much new for-sale + rental construction is in the pipeline within 1–3 miles? Heavy new supply typically softens prices + rents 12–24 months out; constrained supply supports both.
Investment metrics
- 1% rule
- 1.61% ✓
- Cap rate
- 13.90%
- Cash-on-cash
- 27.18%
- DSCR
- 2.21
- GRM
- 5.2
CMA / ARV
No comps found within radius.
Projected returns pro-forma
-3.0% appreciation · 3.0% rent growth · sell at horizon
- IRR
- 21.1%
- Equity multiple
- 1.86×
- Total profit
- $74,972
- Equity at exit
- $46,222
- IRR
- 29.3%
- Equity multiple
- 3.61×
- Total profit
- $226,453
- Equity at exit
- $26,803
Cash invested: $86,800 (down + closing). Projections, not guarantees.
Landlord ↔ Tenant lean methodology
- Overall (STATE)
- 73 Landlord-Friendly
- State Wisconsin
- 73 Landlord-Friendly · R+2
- County
- — inherits STATE
- City
- — inherits STATE
ZIP-level market 54136
- Home prices YoY
- -33.8%
- Active inventory
- 11
- Price-to-rent
- 5.2×
Monthly cashflow live
- Estimated rent
- $5,006 medium interval (Pro) →
- Mortgage (P&I)
- −$1,626
- Tax from tax record
- −$234 /mo · $2,803/yr
- Insurance
- −$129
- HOA
- −$0
- Vacancy / Maint / Mgmt
- −$1,051
- Net cashflow
- $1,966
Break-even live
UW: 25.0% down · 7.5% · 30yr · 1.5% tax · 5.0% vac · 8.0% maint · 8.0% mgmt
Financing live
Cash to close
- Down payment
- $77,500
- Closing costs
- $9,300
- Reserves months
- —
- Total cash needed
- —
Loan-product check · same deal, 3 products live
Conventional
25% down · 7.5% · 30yr
- Down + closing
- —
- Monthly P&I
- —
- Monthly cashflow
- —
- DSCR
- —
- Eligible?
- —
Personal DTI + credit; lowest rate.
DSCR
20% down · 8.5% · 30yr
- Down + closing
- —
- Monthly P&I
- —
- Monthly cashflow
- —
- DSCR
- —
- Eligible?
- —
No personal income docs; deal must DSCR.
Hard money
10% down · 12.0% · 12mo
- Down + closing
- —
- Monthly P&I
- —
- Monthly cashflow
- —
- DSCR
- —
- Eligible?
- —
Short-term bridge; refi at stabilization.
Rent comps 2 comps
| Address | Beds | Baths | Sqft | Rent | $/sqft | DOM | Units | Dist |
|---|---|---|---|---|---|---|---|---|
| W3183 Westowne Ct Appleton, WI | 3.0 | 2.0 | 1695 | $1,875 | $1.11 | 13d | 1 | 1.30mi |
| N307 Eastowne Ct Unit 1061648P Appleton, WI | 3.0 | 2.0 | 1743 | $8,165 | $4.68 | 21d | 1 | 1.34mi |
Listing history 2 events
-
2026-06-18remarks 699-char remark
-
2026-06-18$310,000 Active 1 DOM
ⓘ Source: listings_history table (triggers on properties + properties_extension) + one-shot
backfill from property_details.listing_events for pre-trigger history.
Tax reassessment forecast WI · Partial reset (capped growth)
- Current annual tax
- $2,803 · $234/mo
- Projected year-2 tax
- $4,269 · $356/mo
- Expected delta
- +$1,466/yr (+$122/mo · 52.3%)
ⓘ Screening estimate from a state-policy table — verify with the county assessor before closing.
Climate risk First Street
- Flood 1/10 Low FEMA zone X (unshaded) · 0% chance over 30 yrs
- Wildfire 1/10 Low
- Heat 2/10 Low 7 d/yr ≥98°F today · 12 d/yr by 30 yrs out
- Wind 2/10 Low
- Air quality 3/10 Moderate 2 unhealthy d/yr today · 3 by 30 yrs out
Nearby sold comps map
Loading sold comps map…
Walkable amenities ~0.75 mi
Loading nearby amenities…
Taxation est. · year 1
- Rental income
- $60,070
- − Mortgage interest
- −$17,365
- − Property taxes
- −$2,803
- − Insurance
- −$1,550
- − Repairs & maintenance
- −$4,806
- − Management
- −$4,806
- − Depreciation
- −$9,018
- Taxable income
- $19,722
- Est. tax owed @ 24.0%
- −$4,733
- After-tax cash flow
- $18,860/yr
For passive investors: Depreciation is non-cash, so a rental often shows a tax loss while cash-flowing — sheltering income. Rental losses are passive: they offset passive income freely, and up to $25,000/yr can offset ordinary (W-2) income if you actively participate and your MAGI is under $100k (phasing out to $0 by $150k); unused losses carry forward. On sale, claimed depreciation is recaptured at up to 25%, and gains may owe capital-gains tax (a 1031 exchange can defer both). Figures are a year-1 estimate at your 24.0% rate — not tax advice; consult a CPA.
Schools (NCES district)
- District
- Kimberly Area School District
- NCES district ID
- 5507470
- Math proficiency
- 61% ▼ -5.00%
- Reading proficiency
- 52% ▼ -11.00%
- Median HH income
- $71,408
- Composite
- 50.27/100
- National rank
- #1889
- State rank
- #26 of 342 in WI
Livability — Kimberly
- Score
- 88/100
- State rank
- #14
- US rank
- #182
Category grades
Schools grade is shown separately in the Schools card above.
Census & demographics
- Census place
- Kimberly, WI
- City population
- 6,936
- Population (ZIP)
- 6,936
Population outlook (Outagamie County) Hauer SSP2
- Today (2025)
- 195,863 people
- By 2030
- 201,154 · +2.7%
- By 2040
- 209,053 · +6.7%
- By 2050
- 211,957 · +8.2%
- By 2075
- 214,299 · +9.4%
- By 2100
- 200,825 · +2.5%
Race, ethnicity, and origin ACS 2023
- Neighborhood character
- Predominantly White (88%)
- Race & ethnicity
- White 88% Two or more races 8% Hispanic / Latino 4% Asian 3%
- Common ancestry
- Iranian 13% Lithuanian 7% Romanian 7%
- Foreign-born
- 3% · South Korea, Canada, Philippines
- Languages at home
- 97% English-only · Spanish 1% Other Asian/Pacific 1%
Political lean MEDSL · Outagamie
- 2024 margin
- R (+10.2) · D 44.2% · R 54.4% · Other 1.5%
- 2008→2024 swing
- -21.8pp toward R · 2008: 11.6pp · 2024: -10.2pp
- All cycles
- 2024: R+10.2 2020: R+9.9 2016: R+12.6 2012: R+1.8 2008: D+11.6
Not yet ingested
- Civics
- —
Market trends
- HPI YoY
- ▼ -116.18%
- Current HPI
- 228.0933
- Rent YoY
- —
- Metro
- —
- State GDP YoY
- ▲ 2.10%
- F500 in state
- 20
Industry mix (Fortune 500 HQ in WI)
| Industry | F500 HQs | Revenue |
|---|---|---|
| Industrial Machinery | 4 | $23B |
|
||
| Industrial Technology | 2 | $36B |
|
||
| Insurance | 1 | $36B |
|
||
| Professional Services | 1 | $19B |
|
||
| Utilities | 1 | $9B |
|
||
| Consumer Goods | 1 | $3B |
|
||
Price history
+189.7% since first listed3 events — show timeline
- 2026-06-18 Listed $310,000 RANW
- 2024-02-22 Sold (Public Records) $250,000 Public Records
- 2013-03-13 Sold (Public Records) $107,000 Public Records
Property tax history
+2.1%/yrLatest (2025): $2,803 · +4.8% YoY. Source: county tax records.
Cash-flow waterfall
monthlySold comps — $/sqft
last 12 mo · ≤1 miLoading sold comps…