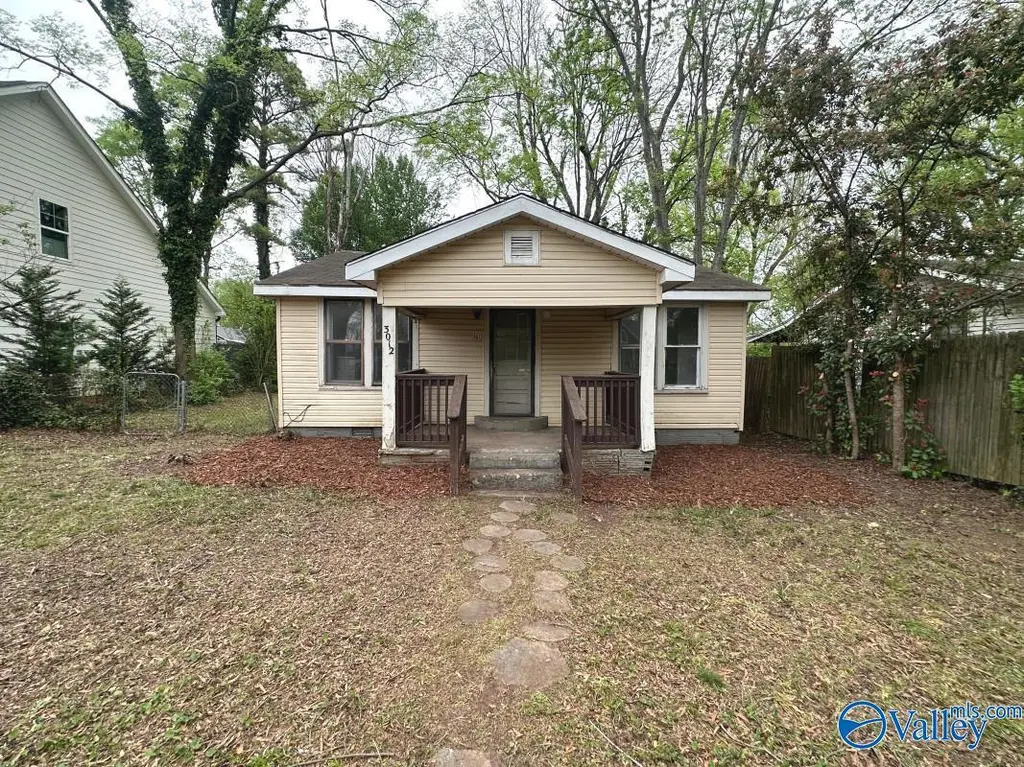
3012 7th Ave SW · Huntsville, AL
Flood risk 1/10 · Minimal
- FEMA flood zone
- X (unshaded)
- Chance of flooding over 30 yrs
- 0.0%
- Est. flood insurance / yr
- $507 – $1,088
Fire risk 1/10 · Minimal
- Est. fire insurance / yr
- $916 – $1,700
Heat risk 6/10 · Moderate
- Hot days now (above 105°F)
- 7 days/yr
- Hot days in 30 yrs
- 20 days/yr
Wind risk 4/10 · Minor
- Chance of severe wind over 30 yrs
- 17.0%
Air-quality risk 2/10 · Minimal
- Unhealthy air days now
- 1 days/yr
- Unhealthy air days in 30 yrs
- 1 days/yr
Risk factors via First Street. Map © Google.
Why this score? — see what drove the B+ grade
The composite is a weighted blend of 9 inputs, each scored 0–100. Each bar is that input's sub-score; the figure is the points it added to the 100-point composite (weight × sub-score).
- Cash flow +30.0/30.0
- ARV discount +15.0/15.0
- DSCR +10.0/10.0
- 1% rule +9.7/10.0
- Livability +4.1/5.0
- Rent growth +3.0/5.0
- Schools +2.9/10.0
- Condition / age +2.5/5.0
- Appreciation +0.0/10.0
$99,000
🖨 Deal sheet (PDF) 📄 Offer letter ✓ Due diligence
Listing remarks
45% ARV Lowe Mill Property. Located in the Heart of Huntsville Less than 1 Mile from Stovehouse, Campus 805 & New Developments the Range & Foundry!
Key facts
- 7,405 sq ft lot
- Built 1940
- Listed 19 days
Neighborhood map
What this means for you Summary
Snapshot
- This is a 3-bed/1.0-bath single-family listed at $99k.
Deal economics
- At list price, monthly cash flow is $553 ($7k/yr) — positive.
- The deal already cash-flows at list — no discount required.
- Meets the 1% rule at list price ($1k rent vs $99k).
- Recommended offer: $98k (1.5% below list) — sets the bar for market timing.
- Cap rate 13.0% vs local median 3.8% in Huntsville — top-decile yield for the area; either an underpriced asset or a hidden risk that comps aren't pricing in. Stress-test before assuming the spread holds.
Location & tenants
- Location reads 82/100 on livability (#3 in AL, #1,082 nationally) — a professional / high-income tenant draw. Strengths: commute A+, cost of living A+, housing A+; Watch: crime F.
- Huntsville City (urban): math 21% / reading 46% proficiency, ranked #48 of 129 in AL (top 37%) — families likely to look elsewhere, expect single-tenant / working-renter base with shorter leases.
- Zoned schools: Morris Elementary School (math 5% / reading 31%, grade F, #481 of 627 statewide, top 77%, 515 students, 90% FRL); Columbia High School (math 12% / reading 17%, grade F, #220 of 305 statewide, top 77%, 954 students, 50% FRL) — zoned schools average 70% FRL vs 46% district-wide (24 pts higher); higher-poverty schools than district average — tighter screening recommended.
- Zoned-school proficiency averages 16% at this address vs 34% district-wide (-17 pts) — the specific schools serving this property underperform the Huntsville City average; the district grade overstates school quality for this exact location.
- Market conditions: Rents rising (+1.8%/yr); 133 active listings in the ZIP; 40 comparable units currently listed for rent nearby; rentals at typical pace (median 24d on market — plan ~3-4 weeks tenant-placement turnaround); lower-income renter base — watch delinquency; 4,709 units permitted in Madison County in 2024 (1,186 in 5+ unit buildings).
Forward outlook
- Local home prices are declining (-3.0%/yr); year-one equity from $684 of loan paydown is wiped out by about $3k of value loss. Plan a longer hold.
- Madison County population projected at +18% by 2050 — long-run rental-demand tailwind backs the buy-and-hold thesis.
- At projected returns (-3.0% appreciation + 1.8% rent growth), your $28k cash investment doubles in ~6 years — after that, you're playing with house money.
Negotiation context
- It's been on market 19 days — a 2% lower offer ($98k) is reasonable based on typical stale-listing flexibility.
- Current owner paid $80k; 24% above their basis — modest negotiation headroom, anchor on the comps not their cost.
Risks & watch-outs
- Watch-outs: built in 1940 — expect roof / HVAC / electrical / plumbing capex.
- Climate carrying-cost: extreme-heat days projected 7→20/yr by 2055 (HVAC capex compounding) — expect insurance premiums to compound above CPI over the hold.
Questions for the listing agent
- Built in 1940 — when were the roof, HVAC, electrical panel, plumbing, and water heater last replaced?
- Is there a deadline driving the sale (1031 exchange, divorce, estate, relocation)? That informs how much negotiation room exists.
- Crime grade is F in this area — have there been break-ins, vandalism, or insurance claims at this property in the last 3 years? What carrier currently insures it and at what premium?
- What's the average days-on-market for RENTAL listings here right now (not sales)? A rising rental-DOM trend means longer vacancies and softer asking-rent achievability than the comps imply.
- What's the recent tenant-quality profile in this submarket — average credit score on applications, eviction rate, late-payment / NSF rate, and stable-employment percentage? A property-management company in the area should have these aggregated.
- How much new for-sale + rental construction is in the pipeline within 1–3 miles? Heavy new supply typically softens prices + rents 12–24 months out; constrained supply supports both.
Investment metrics
- 1% rule
- 1.47% ✓
- Cap rate
- 12.99%
- Cash-on-cash
- 23.92%
- DSCR
- 2.06
- GRM
- 5.7
CMA / ARV
- ARV (on-the-fly)
- $162,729
- Comps found
- 12
Show comp detail 12 sales within ~0.75 mi
| Address | Dist | Beds/Ba | Sqft | Sold | Price | $/sf | Match |
|---|---|---|---|---|---|---|---|
| 3012 7th Ave SW | 0.00mi | 3/1.0 | 1,132 (+2%) | 1mo | $88,000 | $78 | 96 |
| 2910 SW 7th Ave | 0.10mi | 3/1.0 | 1,125 (+2%) | 11mo | $165,000 | $147 | 84 |
| 3405 7th Ave SW | 0.31mi | 2/1.0 (-1) | 1,125 (+2%) | 8mo | $95,000 | $84 | 71 |
| 3503 7th Ave | 0.39mi | 2/1.0 (-1) | 1,149 (+4%) | 7mo | $133,100 | $116 | 65 |
| 2523 SW Roland Rd | 0.56mi | 3/1.0 | 1,085 (-2%) | 8mo | $139,000 | $128 | 64 |
| 2012 Summer St | 0.56mi | 3/2.0 | 1,188 (+7%) | 2mo | $142,800 | $120 | 56 |
| 702 9th St | 0.70mi | 3/1.0 | 1,054 (-5%) | 8mo | $175,000 | $166 | 53 |
| 3901 Beech Ave SW | 0.73mi | 3/1.0 | 1,131 (+2%) | 12mo | $175,000 | $155 | 52 |
| 3702 8th Ave SW | 0.57mi | 2/2.0 (-1) | 1,169 (+6%) | 8mo | $90,000 | $77 | 48 |
| 3900 Birch Ave SW | 0.74mi | 2/1.0 (-1) | 1,008 (-9%) | 2mo | $179,000 | $178 | 44 |
| 3811 8th Ave SW | 0.69mi | 2/1.0 (-1) | 960 (-13%) | 3mo | $200,000 | $208 | 38 |
| 2706 SW Biscayne St | 0.65mi | 3/2.0 | 1,225 (+11%) | 13mo | $200,000 | $163 | 37 |
Match score weights: distance 35% · size 25% · config 20% · recency 20%. Top-matched comps best support the ARV.
Projected returns pro-forma
-3.0% appreciation · 1.82% rent growth · sell at horizon
- IRR
- 15.8%
- Equity multiple
- 1.63×
- Total profit
- $17,418
- Equity at exit
- $14,761
- IRR
- 23.6%
- Equity multiple
- 2.93×
- Total profit
- $53,522
- Equity at exit
- $8,560
Cash invested: $27,720 (down + closing). Projections, not guarantees.
Landlord ↔ Tenant lean methodology
- Overall (STATE)
- 90 Strongly Landlord-Friendly
- State Alabama
- 90 Strongly Landlord-Friendly · R+15
- County
- — inherits STATE
- City
- — inherits STATE
ZIP-level market 35805
- Home prices YoY
- -17.4%
- Rents YoY
- 1.8%
- Active inventory
- 133
- Price-to-rent
- 5.7×
Monthly cashflow live
- Estimated rent
- $1,454 high interval (Pro) →
- Mortgage (P&I)
- −$519
- Tax from tax record
- −$36 /mo · $432/yr
- Insurance
- −$41
- HOA
- −$0
- Vacancy / Maint / Mgmt
- −$305
- Net cashflow
- $553
Break-even live
Sensitivity live
| Price | -10% $609 | -5% $581 | +0% $553 | +5% $525 | +10% $497 |
|---|---|---|---|---|---|
| Rent | -10% $438 | -5% $495 | +0% $553 | +5% $610 | +10% $668 |
| Rate | -1.0pp $603 | -0.5pp $578 | base $553 | +0.5pp $527 | +1.0pp $501 |
UW: 25.0% down · 7.5% · 30yr · 1.5% tax · 5.0% vac · 8.0% maint · 8.0% mgmt
Financing live
Cash to close
- Down payment
- $24,750
- Closing costs
- $2,970
- Reserves months
- —
- Total cash needed
- —
Loan-product check · same deal, 3 products live
Conventional
25% down · 7.5% · 30yr
- Down + closing
- —
- Monthly P&I
- —
- Monthly cashflow
- —
- DSCR
- —
- Eligible?
- —
Personal DTI + credit; lowest rate.
DSCR
20% down · 8.5% · 30yr
- Down + closing
- —
- Monthly P&I
- —
- Monthly cashflow
- —
- DSCR
- —
- Eligible?
- —
No personal income docs; deal must DSCR.
Hard money
10% down · 12.0% · 12mo
- Down + closing
- —
- Monthly P&I
- —
- Monthly cashflow
- —
- DSCR
- —
- Eligible?
- —
Short-term bridge; refi at stabilization.
Rent comps 40 comps
| Address | Beds | Baths | Sqft | Rent | $/sqft | DOM | Units | Dist |
|---|---|---|---|---|---|---|---|---|
| 2708 7th Ave SW Unit D Huntsville, AL | 2.0 | 1.0 | 1000 | $950 | $0.95 | 44d | 1 | 0.27mi |
| 2714 9th Ave SW Huntsville, AL | 3.0 | 2.0 | 1300 | $1,500 | $1.15 | 44d | 1 | 0.29mi |
| 2900 4th Ave NW Huntsville, AL | 2.0 | 1.0–2.0 | 765 | $1,804 | $2.36 | 14d | 81 | 0.34mi |
| 2700 9th Ave SW Huntsville, AL | 3.0 | 2.0 | 1469 | $1,495 | $1.02 | 44d | 1 | 0.35mi |
| 2400 1st St SW Huntsville, AL | 2.0–3.0 | 1.5–2.0 | 1067 | $1,300 | $1.22 | 44d | 2 | 0.46mi |
| 2500 9th Ave SW Huntsville, AL | 2.0 | 1.0–2.0 | 841 | $1,623 | $1.93 | 14d | 12 | 0.47mi |
| 3605 6th Ave SW Huntsville, AL | 2.0 | 1.5 | 1338 | $2,000 | $1.49 | 44d | 1 | 0.50mi |
| 3700 Governors Dr SW Huntsville, AL | 3.0 | 1.0–2.0 | 1547 | $2,588 | $1.67 | 14d | 58 | 0.60mi |
| 2999 Woodway Dr SW Huntsville, AL | 1.0–2.0 | 1.0 | 676 | $915 | $1.35 | 14d | 1 | 0.64mi |
| 609 10th St NW Huntsville, AL | 4.0 | 2.0 | 1140 | $1,650 | $1.45 | 24d | 1 | 0.66mi |
| 3801 6th Ave SW Huntsville, AL | 2.0 | 2.0 | 953 | $1,325 | $1.39 | 24d | 2 | 0.67mi |
| 612 Marguerite Dr NW Huntsville, AL | 3.0 | 1.0 | 1040 | $1,400 | $1.35 | 44d | 1 | 0.70mi |
| 2610 Mirabeau Dr Huntsville, AL | 2.0 | 1.0 | 715 | $999 | $1.40 | 21d | 13 | 0.71mi |
| 2321 Bob Wallace Ave SW Huntsville, AL | 2.0 | 1.0 | 700 | $1,350 | $1.93 | 44d | 1 | 0.78mi |
| 3912 Pine Ave SW Huntsville, AL | 3.0 | 1.0 | 1350 | $1,450 | $1.07 | 24d | 1 | 0.81mi |
| 3016 Holmes Ave NW Huntsville, AL | 3.0 | 1.0 | 1092 | $1,275 | $1.17 | 24d | 1 | 0.82mi |
| 804 Appleby St NW Huntsville, AL | 2.0 | 2.0 | 1170 | $1,295 | $1.11 | 14d | 1 | 0.86mi |
| 3208 Clopton St SW Huntsville, AL | 2.0 | 1.0 | 812 | $960 | $1.18 | 21d | 1 | 0.86mi |
| 3210 Clopton St SW Huntsville, AL | 2.0 | 1.0 | 812 | $960 | $1.18 | 14d | 1 | 0.88mi |
| 740 Constellation Place Dr SW Huntsville, AL | 3.0 | 1.0–2.0 | 1045 | $2,199 | $2.10 | 14d | 25 | 0.88mi |
| 4013 9th Ave SW Huntsville, AL | 2.0 | 1.0 | 1060 | $1,098 | $1.04 | 44d | 1 | 0.89mi |
| 2211 Pizitz Dr SW Huntsville, AL | 2.0 | 1.0 | 850 | $1,295 | $1.52 | 44d | 1 | 0.90mi |
| 1906 Vanderbilt Cir SW Huntsville, AL | 3.0 | 1.0 | 1045 | $1,595 | $1.53 | 44d | 1 | 0.92mi |
| 905 Fairway Dr NW Huntsville, AL | 2.0 | 1.0 | 1000 | $995 | $0.99 | 44d | 1 | 0.93mi |
| 2700 Union Dr NW Huntsville, AL | 3.0 | 2.0 | 1340 | $1,450 | $1.08 | 21d | 1 | 0.93mi |
| 4112 17th St SW Unit C Huntsville, AL | 2.0 | 2.0 | 750 | $1,095 | $1.46 | 44d | 1 | 0.99mi |
| 2006 Stanford Dr SW Huntsville, AL | 3.0 | 2.0 | 1276 | $1,995 | $1.56 | 44d | 1 | 1.04mi |
| 600 Clinton Ave W Huntsville, AL | 3.0 | 1.0–2.0 | 1034 | $3,645 | $3.52 | 24d | 168 | 1.08mi |
| 3206 Brook Manor Ave NW Huntsville, AL | 2.0 | 1.0 | 1156 | $1,100 | $0.95 | 14d | 1 | 1.08mi |
| 805 Monroe St SW Huntsville, AL | 2.0 | 1.0–2.0 | 928 | $2,865 | $3.09 | 14d | 183 | 1.09mi |
| 3902 Harwood Ave SW Huntsville, AL | 3.0 | 1.5 | 1248 | $1,400 | $1.12 | 24d | 1 | 1.10mi |
| 417 Holmes Ave NW Unit B Huntsville, AL | 2.0 | 1.0 | 850 | $1,150 | $1.35 | 24d | 1 | 1.12mi |
| 2028 Princeton Blvd SW Huntsville, AL | 2.0 | 1.0 | 1289 | $1,495 | $1.16 | 14d | 1 | 1.13mi |
| 3615 N Crestview Dr NW Unit 2 Huntsville, AL | 2.0 | 1.5 | 920 | $795 | $0.86 | 24d | 1 | 1.15mi |
| 521 Davis Cir SW Huntsville, AL | 3.0 | 1.0–3.0 | 1030 | $2,890 | $2.80 | 14d | 182 | 1.17mi |
| 3636 Chasewood Dr SW Huntsville, AL | 1.0–2.0 | 1.0 | 665 | $920 | $1.38 | 44d | 1 | 1.18mi |
| 3621 N Crestview Dr NW Unit 2 Huntsville, AL | 2.0 | 1.5 | 900 | $895 | $0.99 | 44d | 1 | 1.18mi |
| 401 Williams Ave SW Huntsville, AL | 2.0 | 1.0–2.0 | 911 | $2,278 | $2.50 | 21d | 36 | 1.20mi |
| 3009 Hillsboro Rd SW Huntsville, AL | 3.0 | 1.0 | 1000 | $1,250 | $1.25 | 24d | 1 | 1.21mi |
| 3505 Bradley St SW Huntsville, AL | 2.0 | 1.0 | 1192 | $950 | $0.80 | 24d | 1 | 1.21mi |
Listing history 3 events
-
2026-04-21status Pending
-
2026-04-02$99,000 Active
-
2026-02-23soldstatus $80,000
ⓘ Source: listings_history table (triggers on properties + properties_extension) + one-shot
backfill from property_details.listing_events for pre-trigger history.
Tax reassessment forecast AL · Resets to sale price
- Current annual tax
- $432 · $36/mo
- Projected year-2 tax
- $432 · $36/mo
- Expected delta
- $0/yr ($0/mo · 0.0%)
ⓘ Screening estimate from a state-policy table — verify with the county assessor before closing.
Climate risk First Street
- Flood 1/10 Low FEMA zone X (unshaded) · 0% chance over 30 yrs
- Wildfire 1/10 Low
- Heat 6/10 Major 7 d/yr ≥105°F today · 20 d/yr by 30 yrs out
- Wind 4/10 Moderate 17% chance of damaging wind over 30 yrs
- Air quality 2/10 Low 1 unhealthy d/yr today · 1 by 30 yrs out
Nearby sold comps map
Loading sold comps map…
Walkable amenities ~0.75 mi
Loading nearby amenities…
Taxation est. · year 1
- Rental income
- $17,454
- − Mortgage interest
- −$5,546
- − Property taxes
- −$432
- − Insurance
- −$495
- − Repairs & maintenance
- −$1,396
- − Management
- −$1,396
- − Depreciation
- −$2,880
- Taxable income
- $5,309
- Est. tax owed @ 24.0%
- −$1,274
- After-tax cash flow
- $5,358/yr
For passive investors: Depreciation is non-cash, so a rental often shows a tax loss while cash-flowing — sheltering income. Rental losses are passive: they offset passive income freely, and up to $25,000/yr can offset ordinary (W-2) income if you actively participate and your MAGI is under $100k (phasing out to $0 by $150k); unused losses carry forward. On sale, claimed depreciation is recaptured at up to 25%, and gains may owe capital-gains tax (a 1031 exchange can defer both). Figures are a year-1 estimate at your 24.0% rate — not tax advice; consult a CPA.
Schools (NCES district)
- District
- Huntsville City
- NCES district ID
- 0101800
- Math proficiency
- 21% ▼ -23.00%
- Reading proficiency
- 46% ▬ 0.00%
- Median HH income
- $48,264
- Composite
- 28.84/100
- National rank
- #6647
- State rank
- #48 of 129 in AL
Livability — Huntsville
- Score
- 82/100
- State rank
- #3
- US rank
- #1082
Category grades
Schools grade is shown separately in the Schools card above.
Census & demographics
- Census place
- Huntsville, AL
- County
- Madison County · 380,832 people
- City population
- 220,435
- Metro
- Huntsville, AL
- Population (ZIP)
- 20,856
- Household income
- $35,385
- Rent vs Own
- Severe rent burden
- 1750.0
Population outlook (Madison County) Hauer SSP2
- Today (2025)
- 392,086 people
- By 2030
- 409,788 · +4.5%
- By 2040
- 440,557 · +12.4%
- By 2050
- 460,990 · +17.6%
- By 2075
- 502,872 · +28.3%
- By 2100
- 513,623 · +31.0%
Race, ethnicity, and origin ACS 2023
- Neighborhood character
- Diverse neighborhood (Simpson 0.69)
- Race & ethnicity
- White 40% Black 31% Hispanic / Latino 24% Two or more races 8%
- Hispanic origin (detail)
- Mexican 17% Puerto Rican 2%
- Common ancestry
- Lithuanian 1% Slovak 1% Serbian 1%
- Foreign-born
- 16% · Canada, Jamaica
- Languages at home
- 76% English-only · Spanish 22% German/W. Germanic 1%
Political lean MEDSL · Madison
- 2024 margin
- Lean R (+9.0) · D 44.7% · R 53.7% · Other 1.6%
- 2008→2024 swing
- +6.0pp toward D · 2008: -14.9pp · 2024: -9.0pp
- All cycles
- 2024: R+9.0 2020: R+8.0 2016: R+16.8 2012: R+18.7 2008: R+14.9
Not yet ingested
- Civics
- —
Market trends
- HPI YoY
- ▼ -48.03%
- Current HPI
- 228.6963
- Rent YoY
- ▲ 1.82%
- Metro
- Huntsville, AL
- State GDP YoY
- ▲ 2.94%
- F500 in state
- 4
Industry mix (Fortune 500 HQ in AL)
| Industry | F500 HQs | Revenue |
|---|---|---|
| Financial Services | 1 | $8B |
|
||
| Healthcare | 1 | $5B |
|
||
Price history
+23.8% since first listed3 events — show timeline
- 2026-04-21 Pending — VMLS
- 2026-04-02 Listed $99,000 VMLS
- 2026-02-23 Sold (Public Records) $80,000 Public Records
Property tax history
+20.4%/yrLatest (2024): $432 · +33.3% YoY. Source: county tax records.
Cash-flow waterfall
monthlySold comps — $/sqft
last 12 mo · ≤1 miLoading sold comps…