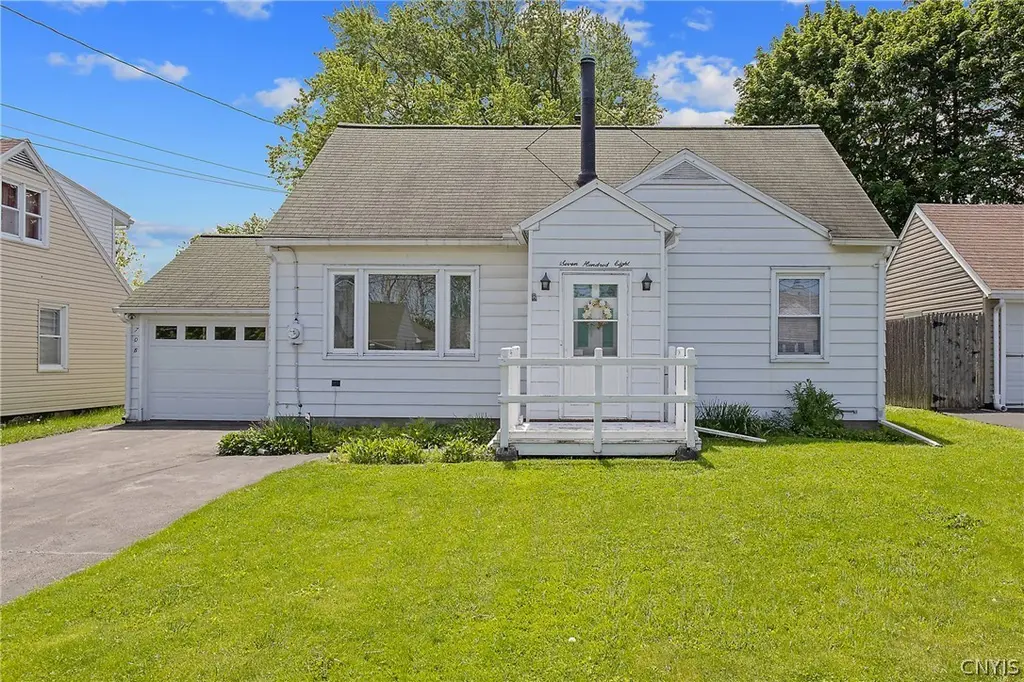
708 Orwood Pl · Lyncourt, NY
Flood risk 1/10 · Minimal
- FEMA flood zone
- X (unshaded)
- Chance of flooding over 30 yrs
- 0.0%
- Est. flood insurance / yr
- $473 – $860
Fire risk 1/10 · Minimal
- Est. fire insurance / yr
- $691 – $1,283
Heat risk 3/10 · Minor
- Hot days now (above 95°F)
- 7 days/yr
- Hot days in 30 yrs
- 16 days/yr
Wind risk 1/10 · Minimal
- Chance of severe wind over 30 yrs
- 1.0%
Air-quality risk 2/10 · Minimal
- Unhealthy air days now
- 0 days/yr
- Unhealthy air days in 30 yrs
- 1 days/yr
Risk factors via First Street. Map © Google.
Why this score? — see what drove the C+ grade
The composite is a weighted blend of 9 inputs, each scored 0–100. Each bar is that input's sub-score; the figure is the points it added to the 100-point composite (weight × sub-score).
- Cash flow +15.4/30.0
- ARV discount +15.0/15.0
- Appreciation +10.0/10.0
- 1% rule +5.9/10.0
- DSCR +4.7/10.0
- Livability +4.1/5.0
- Schools +3.0/10.0
- Rent growth +2.5/5.0
- Condition / age +2.5/5.0
$174,900
🖨 Deal sheet 📄 Offer letter ✓ Due diligence
Listing remarks
Welcome to 708 Orwood Place- A charming cape cod in desirable Lyncourt featuring 3 bedrooms and 1.5 baths with a flexible layout and incredible storage throughout! The main level offers two spacious bedrooms and a full bathroom for convenient first-floor living. Upstairs, you’ll find a private third bedroom, half bath, and an additional bonus room perfect for a home office, guest room, playroom, or potential fourth bedroom. A fantastic bonus room off the garage adds even more versatile living space — ideal for family parties, hobbies, a mudroom, or additional lounge area. The basement also offers great potential for a future family room, home gym, or recreation space. Recent upg
Key facts
- Newer furnace
- Flexible layout
- Bonus room
Tags
Property features AI
Exterior
- Parking: Attached garage (1 car)
- Utilities: Public water connected; Sewer connected
- Home design: Single-story home; Aluminum siding; Asphalt shingle roof; Block foundation; Resale property; City street frontage; Rectangular residential lot (approx. 0.1492 acres, 52 x 125)
- Construction: Aluminum siding construction; Asphalt shingle roof; Block foundation; Year built: existing
- Exterior features: Blacktop driveway; Fully fenced yard; Shed(s) / exterior storage; Full yard fencing
Interior
- Kitchen: Dishwasher; Gas oven and gas range; Refrigerator; Freezer; Eat-in kitchen
- Bedrooms: 2 bedrooms on the main level
- Flooring: Hardwood; Carpet; Tile; Variable flooring
- Bathrooms: 1 full bathroom; 1 half bathroom; 1 main-level bathroom
- Heating & cooling: Gas forced air heating; Central air conditioning
- Interior features: Eat-in kitchen; Home office; Basement recreation space; Full basement; Fireplace (1)
- Laundry & utility: Washer and dryer in basement; Gas water heater
Neighborhood map
What this means for you Summary
Snapshot
- This is a 3-bed/1.5-bath single-family listed at $175k.
Deal economics
- At list price, monthly cash flow is $67 ($809/yr) — positive.
- The deal already cash-flows at list — no discount required.
- Meets the 1% rule at list price ($2k rent vs $175k).
Location & tenants
- Location reads 82/100 on livability (#72 in NY, #1,075 nationally) — a professional / high-income tenant draw. Strengths: cost of living A+, housing A+, health & safety A+; Watch: schools C-, amenities C-.
- Lyncourt Union Free School District (suburban): math 33% / reading 30% proficiency, ranked #719 of 755 in NY (top 95%) — families likely to look elsewhere, expect single-tenant / working-renter base with shorter leases.
- Market conditions: 99 active listings in the ZIP; 12 comparable units currently listed for rent nearby; rentals leasing fast (median 14d on market — plan ~1-2 weeks tenant-placement turnaround); lower-income renter base — watch delinquency; 616 units permitted in Onondaga County in 2024 (256 in 5+ unit buildings).
- At $1,901/mo this rent would consume 51% of the median local household income ($45k/yr) (locally 1437% of renters already pay >50% of income on rent) — very limited rent-growth headroom before tenants either downsize or default.
Forward outlook
- In year one you build about $19k of equity ($1k loan paydown + $17k appreciation (10.0% local appreciation)).
- Onondaga County population projected to shrink 9% by 2050 — rents likely to lag national; underwrite the cash flow, not the appreciation.
- At projected returns (10.0% appreciation + 3.0% rent growth), your $49k cash investment doubles in ~3 years — after that, you're playing with house money.
- By year 2, paydown + projected appreciation supports a ~$30k cash-out refi (75% LTV) — recoverable capital for the next deal without selling this one.
Negotiation context
- Only 4 days on market — expect competitive offers; lowballing is unlikely to land.
Risks & watch-outs
- Watch-outs: property tax is 3.0% of price; built in 1950 — expect roof / HVAC / electrical / plumbing capex.
Questions for the listing agent
- Built in 1950 — when were the roof, HVAC, electrical panel, plumbing, and water heater last replaced?
- Property tax is high relative to price — has the assessment been appealed recently, and will the sale trigger a re-assessment?
- Is there a deadline driving the sale (1031 exchange, divorce, estate, relocation)? That informs how much negotiation room exists.
- What's the average days-on-market for RENTAL listings here right now (not sales)? A rising rental-DOM trend means longer vacancies and softer asking-rent achievability than the comps imply.
- What's the recent tenant-quality profile in this submarket — average credit score on applications, eviction rate, late-payment / NSF rate, and stable-employment percentage? A property-management company in the area should have these aggregated.
- How much new for-sale + rental construction is in the pipeline within 1–3 miles? Heavy new supply typically softens prices + rents 12–24 months out; constrained supply supports both.
Investment metrics
- 1% rule
- 1.09% ✓
- Cap rate
- 6.76%
- Cash-on-cash
- 1.65%
- DSCR
- 1.07
- GRM
- 7.7
CMA / ARV
- ARV (on-the-fly)
- $227,976
- Comps found
- 12
Show comp detail 12 sales within ~0.75 mi
| Address | Dist | Beds/Ba | Sqft | Sold | Price | $/sf | Match |
|---|---|---|---|---|---|---|---|
| 215 Tower Ave | 0.42mi | 3/1.0 | 1,416 (0%) | 3mo | $241,500 | $171 | 76 |
| 2908 Court St | 0.25mi | 3/2.0 | 1,312 (-7%) | 2mo | $170,000 | $130 | 72 |
| 116 Berwick Rd N | 0.47mi | 3/2.0 | 1,349 (-5%) | 0mo | $232,500 | $172 | 68 |
| 709 Darlington Rd | 0.65mi | 3/1.5 | 1,416 (0%) | 3mo | $207,000 | $146 | 67 |
| 339 Orwood Pl | 0.38mi | 4/2.0 (+1) | 1,320 (-7%) | 5mo | $226,000 | $171 | 60 |
| 252 Medford Rd | 0.66mi | 4/2.0 (+1) | 1,422 (+0%) | 5mo | $250,000 | $176 | 58 |
| 303 Snyder Ave | 0.35mi | 3/1.0 | 1,225 (-14%) | 4mo | $220,000 | $180 | 56 |
| 158 Darlington Rd | 0.69mi | 3/1.0 | 1,329 (-6%) | 2mo | $186,000 | $140 | 54 |
| 129 Noble Ave | 0.60mi | 3/2.0 | 1,276 (-10%) | 1mo | $205,000 | $161 | 53 |
| 308 Kenwick Dr | 0.54mi | 3/1.0 | 1,248 (-12%) | 3mo | $180,000 | $144 | 50 |
| 263 Wayland Rd | 0.65mi | 3/1.5 | 1,267 (-10%) | 3mo | $200,000 | $158 | 49 |
| 222 Maplehurst Ave | 0.72mi | 4/1.0 (+1) | 1,248 (-12%) | 6mo | $110,000 | $88 | 35 |
Match score weights: distance 35% · size 25% · config 20% · recency 20%. Top-matched comps best support the ARV.
Projected returns pro-forma
10.0% appreciation · 3.0% rent growth · sell at horizon
- IRR
- 25.5%
- Equity multiple
- 3.04×
- Total profit
- $99,718
- Equity at exit
- $157,564
- IRR
- 22.5%
- Equity multiple
- 6.93×
- Total profit
- $290,608
- Equity at exit
- $339,792
Cash invested: $48,972 (down + closing). Projections, not guarantees.
Landlord ↔ Tenant lean methodology
- Overall (STATE)
- 15 Strongly Tenant-Friendly
- State New York
- 15 Strongly Tenant-Friendly · D+10
- County
- — inherits STATE
- City
- — inherits STATE
ZIP-level market 13208
- Home prices YoY
- 8.4%
- Active inventory
- 99
- Price-to-rent
- 7.7×
Monthly cashflow live
- Estimated rent
- $1,901 high interval (Pro) →
- Mortgage (P&I)
- −$917
- Tax from tax record
- −$444 /mo · $5,327/yr
- Insurance
- −$73
- HOA
- −$0
- Vacancy / Maint / Mgmt
- −$399
- Net cashflow
- $67
Break-even live
UW: 25.0% down · 7.5% · 30yr · 1.5% tax · 5.0% vac · 8.0% maint · 8.0% mgmt
Financing live
Cash to close
- Down payment
- $43,725
- Closing costs
- $5,247
- Reserves months
- —
- Total cash needed
- —
Loan-product check · same deal, 3 products live
Conventional
25% down · 7.5% · 30yr
- Down + closing
- —
- Monthly P&I
- —
- Monthly cashflow
- —
- DSCR
- —
- Eligible?
- —
Personal DTI + credit; lowest rate.
DSCR
20% down · 8.5% · 30yr
- Down + closing
- —
- Monthly P&I
- —
- Monthly cashflow
- —
- DSCR
- —
- Eligible?
- —
No personal income docs; deal must DSCR.
Hard money
10% down · 12.0% · 12mo
- Down + closing
- —
- Monthly P&I
- —
- Monthly cashflow
- —
- DSCR
- —
- Eligible?
- —
Short-term bridge; refi at stabilization.
Rent comps 12 comps
| Address | Beds | Baths | Sqft | Rent | $/sqft | DOM | Units | Dist |
|---|---|---|---|---|---|---|---|---|
| 417 Hazelhurst Ave Syracuse, NY | 2.0 | 1.0 | 1536 | $1,250 | $0.81 | 20d | 1 | 0.65mi |
| 423 Wendell Ter Syracuse, NY | 4.0 | 1.0 | 1312 | $2,500 | $1.91 | 13d | 1 | 0.78mi |
| 297 Norwood Ave Syracuse, NY | 3.0 | 1.0 | 1188 | $2,050 | $1.73 | 20d | 1 | 0.92mi |
| 225 Marlborough Rd Syracuse, NY | 2.0 | 1.0 | 1040 | $1,800 | $1.73 | 13d | 1 | 0.96mi |
| 126 Woodruff Ave Syracuse, NY | 3.0 | 1.0 | 1200 | $1,675 | $1.40 | 43d | 1 | 1.03mi |
| 1801 James St #2 Syracuse, NY | 3.0 | 1.0 | 1244 | $1,800 | $1.45 | 13d | 1 | 1.06mi |
| 286 Ross Park Syracuse, NY | 3.0 | 1.0 | 1100 | $1,500 | $1.36 | 44d | 1 | 1.14mi |
| 1618 James St #3 Syracuse, NY | 2.0 | 1.0 | 1150 | $2,200 | $1.91 | 13d | 1 | 1.21mi |
| 202 Stafford Ave Syracuse, NY | 3.0 | 1.0 | 1692 | $1,800 | $1.06 | 13d | 1 | 1.21mi |
| 204 Mariposa St Unit pvt house Syracuse, NY | 3.0 | 1.0 | 1128 | $2,137 | $1.89 | 13d | 1 | 1.35mi |
| 106 Harrington St Syracuse, NY | 3.0 | 1.0 | 1168 | $1,875 | $1.61 | 43d | 1 | 1.39mi |
| 2802 Lemoyne Ave Unit 1 Syracuse, NY | 3.0 | 1.0 | 988 | $1,700 | $1.72 | 13d | 1 | 1.47mi |
Listing history 3 events
-
2026-05-31status $174,900 Pending 4 DOM
-
2026-05-30days on market $174,900 Active 4 DOM
-
2026-05-26$174,900 Active
ⓘ Source: listings_history table (triggers on properties + properties_extension) + one-shot
backfill from property_details.listing_events for pre-trigger history.
Tax reassessment forecast NY · Partial reset (capped growth)
- Current annual tax
- $5,327 · $444/mo
- Projected year-2 tax
- $5,327 · $444/mo
- Expected delta
- $0/yr ($0/mo · 0.0%)
ⓘ Screening estimate from a state-policy table — verify with the county assessor before closing.
Climate risk First Street
- Flood 1/10 Low FEMA zone X (unshaded) · 0% chance over 30 yrs
- Wildfire 1/10 Low
- Heat 3/10 Moderate 7 d/yr ≥95°F today · 16 d/yr by 30 yrs out
- Wind 1/10 Low 100% chance of damaging wind over 30 yrs
- Air quality 2/10 Low 0 unhealthy d/yr today · 1 by 30 yrs out
Nearby sold comps map
Loading sold comps map…
Walkable amenities ~0.75 mi
Loading nearby amenities…
Taxation est. · year 1
- Rental income
- $22,806
- − Mortgage interest
- −$9,797
- − Property taxes
- −$5,327
- − Insurance
- −$874
- − Repairs & maintenance
- −$1,825
- − Management
- −$1,825
- − Depreciation
- −$5,088
- Taxable loss
- −$1,929
- Est. tax savings @ 24.0%
- +$463
- After-tax cash flow
- $1,272/yr
For passive investors: Depreciation is non-cash, so a rental often shows a tax loss while cash-flowing — sheltering income. Rental losses are passive: they offset passive income freely, and up to $25,000/yr can offset ordinary (W-2) income if you actively participate and your MAGI is under $100k (phasing out to $0 by $150k); unused losses carry forward. On sale, claimed depreciation is recaptured at up to 25%, and gains may owe capital-gains tax (a 1031 exchange can defer both). Figures are a year-1 estimate at your 24.0% rate — not tax advice; consult a CPA.
Schools (NCES district)
- District
- Lyncourt Union Free School District
- NCES district ID
- 3617940
- Math proficiency
- 33% ▲ 3.00%
- Reading proficiency
- 30% ▲ 5.00%
- Median HH income
- $44,650
- Composite
- 29.71/100
- National rank
- #11736
- State rank
- #719 of 755 in NY
Livability — Lyncourt
- Score
- 82/100
- State rank
- #72
- US rank
- #1075
Category grades
Schools grade is shown separately in the Schools card above.
Census & demographics
- Census place
- Lyncourt, NY
- County
- Onondaga County · 247,257 people
- City population
- 152,627
- Metro
- Syracuse, NY
- Population (ZIP)
- 22,993
- Household income
- $44,712
- Rent vs Own
- Severe rent burden
- 1437.0
Population outlook (Onondaga County) Hauer SSP2
- Today (2025)
- 467,894 people
- By 2030
- 463,381 · -1.0%
- By 2040
- 447,697 · -4.3%
- By 2050
- 426,399 · -8.9%
- By 2075
- 373,661 · -20.1%
- By 2100
- 307,967 · -34.2%
Race, ethnicity, and origin ACS 2023
- Neighborhood character
- Highly diverse neighborhood (Simpson 0.70)
- Race & ethnicity
- White 46% Black 24% Asian 14% Two or more races 10% Hispanic / Latino 6%
- Hispanic origin (detail)
- Puerto Rican 4% Dominican 1%
- Common ancestry
- Romanian 3% Swedish 3% Italian 1%
- Foreign-born
- 22% · Vietnam, Philippines, Canada
- Languages at home
- 70% English-only · Spanish 6% Other Asian/Pacific 5% Vietnamese 4%
Political lean MEDSL · Onondaga
- 2024 margin
- D (+17.3) · D 58.6% · R 41.4%
- 2008→2024 swing
- -3.0pp toward R · 2008: 20.3pp · 2024: 17.3pp
- All cycles
- 2024: D+17.3 2020: D+20.6 2016: D+12.8 2012: D+21.1 2008: D+20.3
Not yet ingested
- Civics
- —
Market trends
- HPI YoY
- ▲ 30.91%
- Current HPI
- 399.3284
- Rent YoY
- —
- Metro
- Syracuse, NY
- State GDP YoY
- ▲ 2.60%
- F500 in state
- 92
Industry mix (Fortune 500 HQ in NY)
| Industry | F500 HQs | Revenue |
|---|---|---|
| Financial Services | 10 | $950B |
|
||
| Consumer Goods | 9 | $162B |
|
||
| Insurance | 4 | $225B |
|
||
| Telecommunications | 2 | $144B |
|
||
| Pharmaceuticals | 2 | $112B |
|
||
| Media / Entertainment | 2 | $69B |
|
||
Price history
1 event — show timeline
- 2026-05-26 Listed $174,900 CNYIS
Property tax history
+2.7%/yrLatest (2025): $5,327 · +1.1% YoY. Source: county tax records.
Cash-flow waterfall
monthlySold comps — $/sqft
last 12 mo · ≤1 miLoading sold comps…