 Multi-family
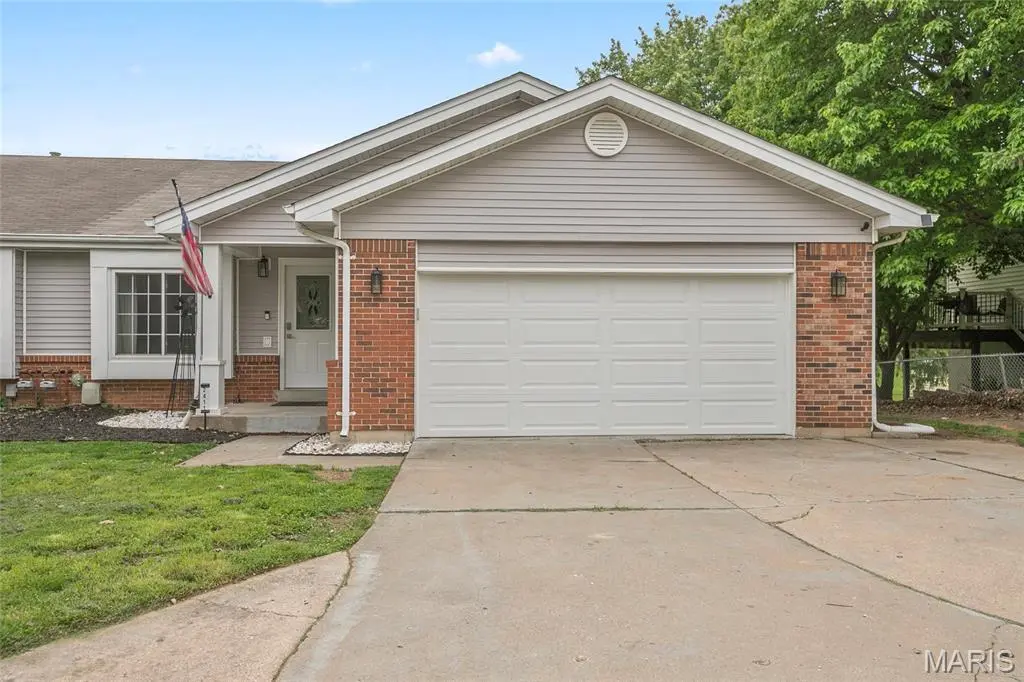
2411 Muegge Rd · St. Charles, MO
Flood risk 1/10 · Minimal
- FEMA flood zone
- X (unshaded)
- Chance of flooding over 30 yrs
- 0.0%
- Est. flood insurance / yr
- $473 – $860
Fire risk 1/10 · Minimal
- Est. fire insurance / yr
- $1,054 – $1,958
Heat risk 5/10 · Moderate
- Hot days now (above 107°F)
- 7 days/yr
- Hot days in 30 yrs
- 20 days/yr
Wind risk 2/10 · Minimal
- Chance of severe wind over 30 yrs
- 1.0%
Air-quality risk 2/10 · Minimal
- Unhealthy air days now
- 2 days/yr
- Unhealthy air days in 30 yrs
- 2 days/yr
Risk factors via First Street. Map © Google.
Why this score? — see what drove the B- grade
The composite is a weighted blend of 9 inputs, each scored 0–100. Each bar is that input's sub-score; the figure is the points it added to the 100-point composite (weight × sub-score).
- Cash flow +29.9/30.0
- DSCR +10.0/10.0
- 1% rule +7.9/10.0
- ARV discount +7.5/15.0
- Schools +4.1/10.0
- Rent growth +3.3/5.0
- Livability +2.5/5.0
- Condition / age +2.5/5.0
- Appreciation +0.0/10.0
$255,000
🖨 Deal sheet 📄 Offer letter ✓ Due diligence
Multi-family units
County records classify this as Multi-Family (2-4 Unit). Listing-text estimate: 1 unit. estimate disagrees with records
Listing remarks
Turnkey and move-in ready, this beautifully updated 3-bedroom, 2-bath end-unit duplex offers comfort, convenience, and exceptional value. Freshly painted throughout, the home features new laminate flooring on the upper level, tile in the kitchen and bathrooms, and brand-new carpeting in the partially finished lower level with walkout access. The spacious primary suite includes private access to a deck, while the kitchen opens to an additional deck overlooking extensive landscaping—perfect for relaxing or entertaining. The inviting living room features a charming window seat, and all bedrooms are equipped with closet organizers for added functionality. A parquet entry foyer adds charac
Key facts
- 2 garage spots
- Built 1987
- Listed 3 days
Property features AI
Finance
- Financial info: Lease not considered
Exterior
- Parking: 2-car garage
- Utilities: Public water; Public sewer; Electricity connected (Ameren)
- Home design: Residential condominium; Two levels
- Construction: Brick and vinyl siding exterior; Architectural shingle roof
- Exterior features: Covered patio/porch with awning; Back yard and front yard; Level lot with some trees
Interior
- Kitchen: Large kitchen about 21 x 15
- Bedrooms: 3 bedrooms total, including 2 on the main level and 1 on the lower level; Typical bedroom size about 12 x 10
- Bathrooms: 2 full bathrooms (both on the main level)
- Heating & cooling: Forced air heating (natural gas); Central air conditioning with electric service; Ceiling fans
- Interior features: Partially finished full basement; 4 total rooms
- Laundry & utility: Dedicated laundry room about 12 x 12
Neighborhood map
What this means for you Summary
Snapshot
- This is a 2-bed/2.0-bath multifamily listed at $255k.
Deal economics
- At list price, monthly cash flow is $940 ($11k/yr) — positive.
- The deal already cash-flows at list — no discount required.
- Meets the 1% rule at list price ($3k rent vs $255k).
- Cap rate 10.7% vs local median 3.3% in St. Charles — top-decile yield for the area; either an underpriced asset or a hidden risk that comps aren't pricing in. Stress-test before assuming the spread holds.
Location & tenants
- Location reads: area grade B — affects rentability + tenant quality, not the cash-flow math above.
- St. Charles R-VI (urban): math 44% / reading 52% proficiency, ranked #51 of 324 in MO (top 16%) — families likely to look elsewhere, expect single-tenant / working-renter base with shorter leases.
- Zoned schools: Harris Elem. (math 47% / reading 57%, grade C-, #231 of 1,115 statewide, top 24%, 408 students, 30% FRL); St. Charles West High (math 42% / reading 57%, grade D, #124 of 521 statewide, top 28%, 631 students, 30% FRL).
- Market conditions: Rents rising (+3.3%/yr); 192 active listings in the ZIP; 7 comparable units currently listed for rent nearby; rentals leasing fast (median 5d on market — plan ~1-2 weeks tenant-placement turnaround); solid renter incomes; 2,021 units permitted in St. Charles County in 2024 (568 in 5+ unit buildings).
- This rent runs 40% of the median local income ($99k/yr) — at the standard rent-burdened threshold; future hikes will face affordability resistance.
Forward outlook
- Local home prices are declining (-3.0%/yr); year-one equity from $2k of loan paydown is wiped out by about $8k of value loss. Plan a longer hold.
- St. Charles County population projected at +22% by 2050 — long-run rental-demand tailwind backs the buy-and-hold thesis.
- At projected returns (-3.0% appreciation + 3.3% rent growth), your $71k cash investment doubles in ~8 years — after that, you're playing with house money.
Negotiation context
- Only 3 days on market — expect competitive offers; lowballing is unlikely to land.
- Current owner paid $86k; list at $255k implies a 198% gain — meaningful room to come down on a strong offer.
Risks & watch-outs
- Climate carrying-cost: extreme-heat days projected 7→20/yr by 2055 (HVAC capex compounding) — expect insurance premiums to compound above CPI over the hold.
Questions for the listing agent
- Is there a deadline driving the sale (1031 exchange, divorce, estate, relocation)? That informs how much negotiation room exists.
- What's the average days-on-market for RENTAL listings here right now (not sales)? A rising rental-DOM trend means longer vacancies and softer asking-rent achievability than the comps imply.
- What's the recent tenant-quality profile in this submarket — average credit score on applications, eviction rate, late-payment / NSF rate, and stable-employment percentage? A property-management company in the area should have these aggregated.
- How much new apartment / multifamily construction is in the pipeline within 1–3 miles? Heavy new supply (>2% of stock underway) typically softens rents 12–24 months out; light construction supports rent growth.
Investment metrics
- 1% rule
- 1.29% ✓
- Cap rate
- 10.72%
- Cash-on-cash
- 15.80%
- DSCR
- 1.70
- GRM
- 6.5
CMA / ARV
- ARV (median comp)
- $758,950
- List price
- $255,000
- Delta
- -66.40%
- Verdict
- UNDERPRICED
- Comps
- 1 within 2.0 mi
Projected returns pro-forma
-3.0% appreciation · 3.27% rent growth · sell at horizon
- IRR
- 7.0%
- Equity multiple
- 1.27×
- Total profit
- $19,442
- Equity at exit
- $38,021
- IRR
- 16.5%
- Equity multiple
- 2.37×
- Total profit
- $97,653
- Equity at exit
- $22,048
Cash invested: $71,400 (down + closing). Projections, not guarantees.
Landlord ↔ Tenant lean methodology
- Overall (STATE)
- 81 Strongly Landlord-Friendly
- State Missouri
- 81 Strongly Landlord-Friendly · R+10
- County
- — inherits STATE
- City
- — inherits STATE
ZIP-level market 63303
- Rents YoY
- 3.3%
- Active inventory
- 192
- Price-to-rent
- 13.0×
Monthly cashflow live
- Estimated rent
- $3,279 medium interval (Pro) →
- Mortgage (P&I)
- −$1,337
- Tax from tax record
- −$207 /mo · $2,479/yr
- Insurance
- −$106
- HOA
- −$0
- Vacancy / Maint / Mgmt
- −$689
- Net cashflow
- $940
Break-even live
2-unit breakdown (identical units grouped — click to expand)
| Units | Beds | Baths | Est. rent |
|---|---|---|---|
| 2× units | 3 | 2 | $3,280 |
| #1 | 3 | 2 | $1,640 |
| #2 | 3 | 2 | $1,640 |
| Total (2 units) | $3,279 | ||
UW: 25.0% down · 7.5% · 30yr · 1.5% tax · 5.0% vac · 8.0% maint · 8.0% mgmt
Financing live
Cash to close
- Down payment
- $63,750
- Closing costs
- $7,650
- Reserves months
- —
- Total cash needed
- —
Loan-product check · same deal, 3 products live
Conventional
25% down · 7.5% · 30yr
- Down + closing
- —
- Monthly P&I
- —
- Monthly cashflow
- —
- DSCR
- —
- Eligible?
- —
Personal DTI + credit; lowest rate.
DSCR
20% down · 8.5% · 30yr
- Down + closing
- —
- Monthly P&I
- —
- Monthly cashflow
- —
- DSCR
- —
- Eligible?
- —
No personal income docs; deal must DSCR.
Hard money
10% down · 12.0% · 12mo
- Down + closing
- —
- Monthly P&I
- —
- Monthly cashflow
- —
- DSCR
- —
- Eligible?
- —
Short-term bridge; refi at stabilization.
Rent comps 7 comps
| Address | Beds | Baths | Sqft | Rent | $/sqft | DOM | Units | Dist |
|---|---|---|---|---|---|---|---|---|
| 3545 Veterans Memorial Pkwy St Charles, MO | 1.0–3.0 | 1.0–2.0 | 877 | $1,456 | $1.66 | 1d | 21 | 0.67mi |
| 1366 Brandywine Ln Saint Peters, MO | 3.0 | 2.0 | 1198 | $2,151 | $1.80 | 43d | 1 | 0.73mi |
| 2717 Greenleaf Dr Saint Charles, MO | 3.0 | 2.0 | 1189 | $2,379 | $2.00 | 4d | 1 | 0.76mi |
| 10 San Miguel Dr St Charles, MO | 1.0–2.0 | 1.0–1.5 | 897 | $1,794 | $2.00 | 1d | 13 | 0.81mi |
| 1517 Shadow Wood Dr Saint Charles, MO | 3.0 | 2.0 | 1064 | $2,250 | $2.11 | 11d | 1 | 1.10mi |
| 43 Plum Tree Dr Saint Peters, MO | 3.0 | 2.0 | 1477 | $2,530 | $1.71 | 4d | 1 | 1.20mi |
| 1306 Garden Valley Dr Unit C St Peters, MO | 1.0 | 1.0 | 720 | $1,000 | $1.39 | 19d | 1 | 1.26mi |
Listing history 7 events
-
2026-05-13status Pending 1155-char remark
-
2026-05-09$255,000 Active 1155-char remark
-
2026-05-02historical $255,000 1155-char remark
-
2024-03-25soldstatus $85,500
-
1999-08-10soldstatus $92,000
-
1999-05-28soldstatus
-
1993-08-01soldstatus $112,500
ⓘ Source: listings_history table (triggers on properties + properties_extension) + one-shot
backfill from property_details.listing_events for pre-trigger history.
Tax reassessment forecast MO · Resets to sale price
- Current annual tax
- $2,479 · $207/mo
- Projected year-2 tax
- $2,479 · $207/mo
- Expected delta
- $0/yr ($0/mo · 0.0%)
ⓘ Screening estimate from a state-policy table — verify with the county assessor before closing.
Climate risk First Street
- Flood 1/10 Low FEMA zone X (unshaded) · 0% chance over 30 yrs
- Wildfire 1/10 Low
- Heat 5/10 Major 7 d/yr ≥107°F today · 20 d/yr by 30 yrs out
- Wind 2/10 Low 100% chance of damaging wind over 30 yrs
- Air quality 2/10 Low 2 unhealthy d/yr today · 2 by 30 yrs out
Nearby sold comps map
Loading sold comps map…
Walkable amenities ~0.75 mi
Loading nearby amenities…
Taxation est. · year 1
- Rental income
- $39,348
- − Mortgage interest
- −$14,284
- − Property taxes
- −$2,479
- − Insurance
- −$1,275
- − Repairs & maintenance
- −$3,148
- − Management
- −$3,148
- − Depreciation
- −$7,418
- Taxable income
- $7,596
- Est. tax owed @ 24.0%
- −$1,823
- After-tax cash flow
- $9,461/yr
For passive investors: Depreciation is non-cash, so a rental often shows a tax loss while cash-flowing — sheltering income. Rental losses are passive: they offset passive income freely, and up to $25,000/yr can offset ordinary (W-2) income if you actively participate and your MAGI is under $100k (phasing out to $0 by $150k); unused losses carry forward. On sale, claimed depreciation is recaptured at up to 25%, and gains may owe capital-gains tax (a 1031 exchange can defer both). Figures are a year-1 estimate at your 24.0% rate — not tax advice; consult a CPA.
Schools (NCES district)
- District
- St. Charles R-VI
- NCES district ID
- 2928920
- Math proficiency
- 44% ▼ -4.00%
- Reading proficiency
- 52% ▼ -1.00%
- Median HH income
- $52,897
- Composite
- 41.38/100
- National rank
- #3486
- State rank
- #51 of 324 in MO
Livability — St. Charles
No livability data for this city. (Only ~50 U.S. cities are tracked.)
Census & demographics
- Census place
- St. Charles, MO
- County
- Saint Charles County · 399,703 people
- Metro
- St. Louis, MO-IL
- Population (ZIP)
- 46,089
- Household income
- $99,138
- Rent vs Own
- Severe rent burden
- 1026.0
Population outlook (St. Charles County) Hauer SSP2
- Today (2025)
- 437,857 people
- By 2030
- 461,707 · +5.4%
- By 2040
- 503,222 · +14.9%
- By 2050
- 534,684 · +22.1%
- By 2075
- 597,047 · +36.4%
- By 2100
- 609,682 · +39.2%
Race, ethnicity, and origin ACS 2023
- Neighborhood character
- Predominantly White (79%)
- Race & ethnicity
- White 79% Black 6% Asian 6% Two or more races 6% Hispanic / Latino 5%
- Common ancestry
- Lithuanian 3% Romanian 3% Slovak 2%
- Foreign-born
- 7% · Canada, China, South Korea
- Languages at home
- 91% English-only · Spanish 3% Other Indo-European 1% Other Asian/Pacific 1%
Political lean MEDSL · St. Charles
- 2024 margin
- R (+17.0) · D 40.8% · R 57.8% · Other 1.4%
- 2008→2024 swing
- -7.2pp toward R · 2008: -9.7pp · 2024: -17.0pp
- All cycles
- 2024: R+17.0 2020: R+17.5 2016: R+26.4 2012: R+21.0 2008: R+9.7
Not yet ingested
- Civics
- —
Market trends
- HPI YoY
- ▼ -260.84%
- Current HPI
- 224.7406
- Rent YoY
- ▲ 3.27%
- Metro
- St. Louis, MO-IL
- State GDP YoY
- ▲ 1.84%
- F500 in state
- 20
Industry mix (Fortune 500 HQ in MO)
| Industry | F500 HQs | Revenue |
|---|---|---|
| Healthcare | 1 | $163B |
|
||
| Insurance | 1 | $21B |
|
||
| Industrial Technology | 1 | $17B |
|
||
| Retail | 1 | $16B |
|
||
| Industrial Distribution | 1 | $10B |
|
||
| Utilities | 1 | $9B |
|
||
Price history
+126.7% since first listed8 events — show timeline
- 2026-06-10 Sold (MLS) — MARIS as Distributed by MLS Grid
- 2026-05-13 Pending — MARIS as Distributed by MLS Grid
- 2026-05-09 Listed $255,000 MARIS as Distributed by MLS Grid
- 2026-05-02 Coming Soon $255,000 MARIS as Distributed by MLS Grid
- 2024-03-25 Sold (Public Records) $85,500 Public Records
- 1999-08-10 Sold (Public Records) $92,000 Public Records
- 1999-05-28 Sold (Public Records) — Public Records
- 1993-08-01 Sold (Public Records) $112,500 Public Records
Property tax history
+3.1%/yrLatest (2025): $2,479 · +9.5% YoY. Source: county tax records.
Cash-flow waterfall
monthlySold comps — $/sqft
last 12 mo · ≤1 miLoading sold comps…