 10-Plex
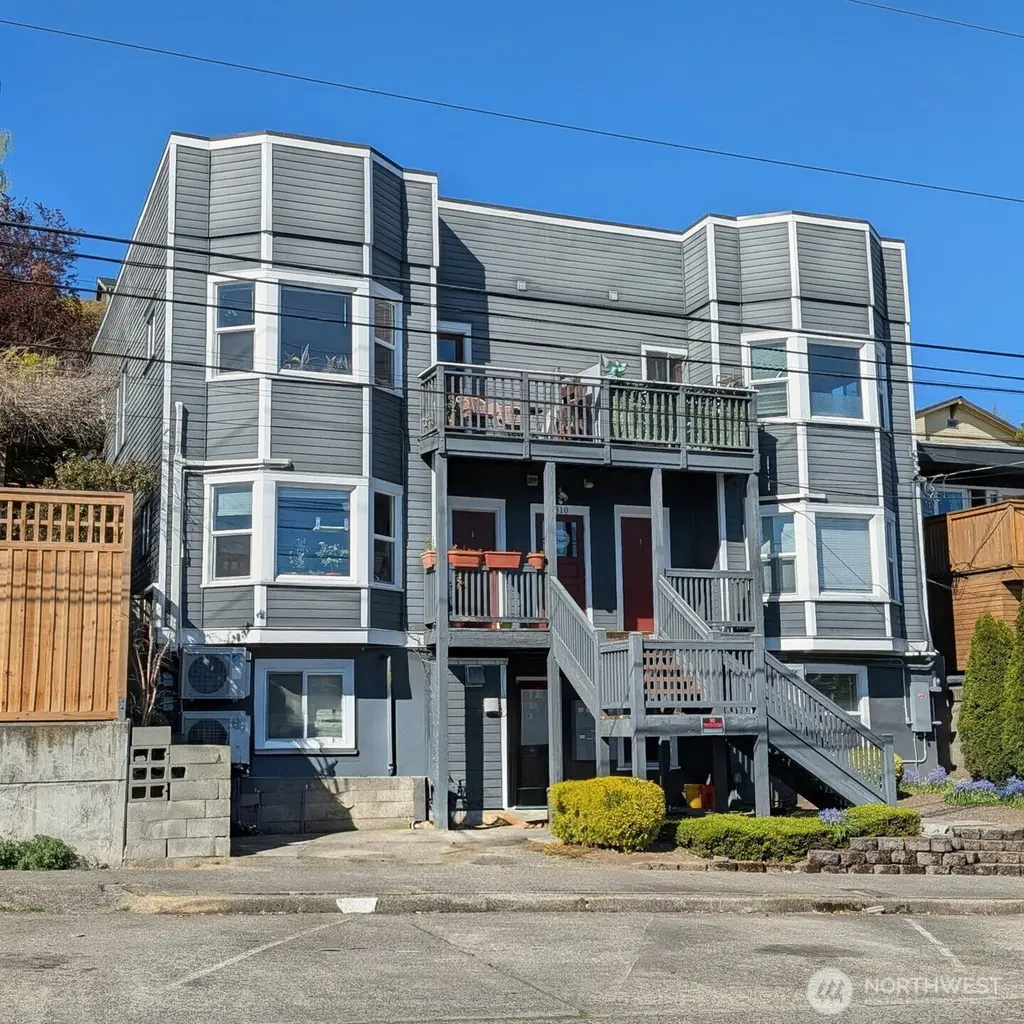
310 Aloha St · Seattle, WA
Flood risk 1/10 · Minimal
- FEMA flood zone
- X (unshaded)
- Chance of flooding over 30 yrs
- 0.0%
- Est. flood insurance / yr
- $507 – $1,088
Fire risk 1/10 · Minimal
- Est. fire insurance / yr
- $604 – $1,122
Heat risk 3/10 · Minor
- Hot days now (above 86°F)
- 7 days/yr
- Hot days in 30 yrs
- 15 days/yr
Wind risk 1/10 · Minimal
- Chance of severe wind over 30 yrs
- —
Air-quality risk 7/10 · Major
- Unhealthy air days now
- 11 days/yr
- Unhealthy air days in 30 yrs
- 12 days/yr
Risk factors via First Street. Map © Google.
Why this score? — see what drove the C grade
The composite is a weighted blend of 9 inputs, each scored 0–100. Each bar is that input's sub-score; the figure is the points it added to the 100-point composite (weight × sub-score).
- Cash flow +25.9/30.0
- DSCR +8.7/10.0
- 1% rule +6.2/10.0
- Schools +6.1/10.0
- Livability +3.8/5.0
- ARV discount +2.6/15.0
- Rent growth +2.5/5.0
- Condition / age +2.5/5.0
- Appreciation +0.0/10.0
$2,500,000
🖨 Deal sheet 📄 Offer letter ✓ Due diligence
Multi-family units
County records classify this as Multi-Family (5+ Unit). Listing-text estimate: 10 units. confirmed
5+ unit building — per-unit beds/baths from public records are typically unavailable; the breakdown below (if shown) is an estimate from the listing text.
Listing remarks
Amazing Investment Opportunity! Welcome to the Anne Marie Apartment, a well-maintained and extensively renovated 10-unit classic building located in the highly sought-after Lower Queen Anne neighborhood (South Slope). Situated on a 6,000 SF lot, this property is incredibly walkable—just steps from the Seattle Center, Gates Foundation, Belltown, South Lake Union, and the waterfront. Tenants enjoy a vibrant area boasting cafes, restaurants, parks, excellent public transit access, and breathtaking views of the Space Needle and the city skyline. Generate significant cash flow right away with the building's numerous reliable, long-term tenants. Alternatively, the property offers fantastic
Key facts
- Breathtaking views
- Turnkey investment
- Well maintained
Tags
Neighborhood map
What this means for you Summary
Snapshot
- This is a 10 × 11-bed/?-bath units multifamily listed at $2.50M.
Deal economics
- At list price, monthly cash flow is $6k ($74k/yr) — positive. Per door: $616/mo.
- The deal already cash-flows at list — no discount required.
- Meets the 1% rule at list price ($28k rent vs $2.50M).
- Recommended offer: $2.42M (3.0% below list) — sets the bar for market timing.
- Cap rate 9.3% vs local median 1.6% in Seattle — top-decile yield for the area; either an underpriced asset or a hidden risk that comps aren't pricing in. Stress-test before assuming the spread holds.
Location & tenants
- Location reads 75/100 on livability (#166 in WA, #4,033 nationally) — a middle-class / working-renter tenant base. Strengths: amenities A+, commute A+, employment A+; Watch: crime F, cost of living F.
- Seattle Public Schools (urban): math 64% / reading 72% proficiency, ranked #19 of 291 in WA (top 6%) — acceptable for families but not a draw, mixed tenant base, ~2y average lease.
- Market conditions: Rents flat; 189 active listings in the ZIP; high-income renter base; 10,555 units permitted in King County in 2024 (7,119 in 5+ unit buildings).
- At $27,965/mo this rent would consume 251% of the median local household income ($134k/yr) (locally 2558% of renters already pay >50% of income on rent) — very limited rent-growth headroom before tenants either downsize or default.
Forward outlook
- Local home prices are declining (-3.0%/yr); year-one equity from $17k of loan paydown is wiped out by about $75k of value loss. Plan a longer hold.
- King County population projected at +44% by 2050 — long-run rental-demand tailwind backs the buy-and-hold thesis.
Negotiation context
- It's been on market 53 days — a 3% lower offer ($2.42M) is reasonable based on typical stale-listing flexibility.
- 11 sale attempts since 21y ago with the ask held roughly flat each time — persistent listings suggest the price (not the market) is what's stuck; bring a comps-based counter.
- Current owner paid $1.85M; 35% above their basis — modest negotiation headroom, anchor on the comps not their cost.
Risks & watch-outs
- Watch-outs: built in 1909 — expect roof / HVAC / electrical / plumbing capex.
Questions for the listing agent
- It's been on market 53 days. Have you received any prior offers? Is the seller open to a 3% concession, seller financing, or rate buy-down credit?
- Can we see the unit-by-unit rent roll, current vacancy, and any below-market leases? What's the average tenancy length?
- What capital expenditures (roof, boiler, parking lot, exteriors) have been made in the last 5 years, and what's planned in the next 2?
- Built in 1909 — when were the roof, HVAC, electrical panel, plumbing, and water heater last replaced?
- Is there a deadline driving the sale (1031 exchange, divorce, estate, relocation)? That informs how much negotiation room exists.
- Schools are A-rated — typically a magnet for longer-tenancy family renters. What's the average tenant stay here, and is there a school-zone premium baked into asking?
- Crime grade is F in this area — have there been break-ins, vandalism, or insurance claims at this property in the last 3 years? What carrier currently insures it and at what premium?
- What's the average days-on-market for RENTAL listings here right now (not sales)? A rising rental-DOM trend means longer vacancies and softer asking-rent achievability than the comps imply.
- What's the recent tenant-quality profile in this submarket — average credit score on applications, eviction rate, late-payment / NSF rate, and stable-employment percentage? A property-management company in the area should have these aggregated.
- How much new apartment / multifamily construction is in the pipeline within 1–3 miles? Heavy new supply (>2% of stock underway) typically softens rents 12–24 months out; light construction supports rent growth.
Investment metrics
- 1% rule
- 1.12% ✓
- Cap rate
- 9.25%
- Cash-on-cash
- 10.56%
- DSCR
- 1.47
- GRM
- 7.4
CMA / ARV
- ARV (median comp)
- $2,254,162
- List price
- $2,500,000
- Delta
- 10.91%
- Verdict
- OVERPRICED
- Comps
- 14 within 1.0 mi
Projected returns pro-forma
-3.0% appreciation · 0.04% rent growth · sell at horizon
- IRR
- -3.7%
- Equity multiple
- 0.87×
- Total profit
- $-94,011
- Equity at exit
- $372,758
- IRR
- 2.5%
- Equity multiple
- 1.16×
- Total profit
- $108,895
- Equity at exit
- $216,154
Cash invested: $700,000 (down + closing). Projections, not guarantees.
Landlord ↔ Tenant lean methodology
- Overall (CITY)
- 0 Strongly Tenant-Friendly
- State Washington
- 28 Tenant-Leaning · D+8
- County
- — inherits STATE
- City Seattle
- 0 Strongly Tenant-Friendly · D+52
ZIP-level market 98109
- Rents YoY
- 0.0%
- Active inventory
- 189
- Price-to-rent
- 74.5×
Monthly cashflow live
- Estimated rent
- $27,965 medium interval (Pro) →
- Mortgage (P&I)
- −$13,110
- Tax from tax record
- −$1,779 /mo · $21,353/yr
- Insurance
- −$1,042
- HOA
- −$0
- Vacancy / Maint / Mgmt
- −$5,873
- Net cashflow
- $6,161
Break-even live
10-unit breakdown (identical units grouped — click to expand)
| Units | Beds | Baths | Est. rent |
|---|---|---|---|
| 10× units | 11 | — | $27,960 |
| #1 | 11 | — | $2,796 |
| #2 | 11 | — | $2,796 |
| #3 | 11 | — | $2,796 |
| #4 | 11 | — | $2,796 |
| #5 | 11 | — | $2,796 |
| #6 | 11 | — | $2,796 |
| #7 | 11 | — | $2,796 |
| #8 | 11 | — | $2,796 |
| #9 | 11 | — | $2,796 |
| #10 | 11 | — | $2,796 |
| Total (10 units) | $27,965 | ||
UW: 25.0% down · 7.5% · 30yr · 1.5% tax · 5.0% vac · 8.0% maint · 8.0% mgmt
Financing live
Cash to close
- Down payment
- $625,000
- Closing costs
- $75,000
- Reserves months
- —
- Total cash needed
- —
Loan-product check · same deal, 3 products live
Conventional
25% down · 7.5% · 30yr
- Down + closing
- —
- Monthly P&I
- —
- Monthly cashflow
- —
- DSCR
- —
- Eligible?
- —
Personal DTI + credit; lowest rate.
DSCR
20% down · 8.5% · 30yr
- Down + closing
- —
- Monthly P&I
- —
- Monthly cashflow
- —
- DSCR
- —
- Eligible?
- —
No personal income docs; deal must DSCR.
Hard money
10% down · 12.0% · 12mo
- Down + closing
- —
- Monthly P&I
- —
- Monthly cashflow
- —
- DSCR
- —
- Eligible?
- —
Short-term bridge; refi at stabilization.
Listing history 48 events
-
2026-06-19days on market $2,500,000 Active 53 DOM
-
2026-06-18days on market $2,500,000 Active 52 DOM
-
2026-06-17days on market $2,500,000 Active 51 DOM
-
2026-06-16days on market $2,500,000 Active 50 DOM
-
2026-06-15days on market $2,500,000 Active 49 DOM
-
2026-06-15days on market $2,500,000 Active 48 DOM
-
2026-06-13days on market $2,500,000 Active 47 DOM
-
2026-06-12days on market $2,500,000 Active 46 DOM
-
2026-06-10days on market $2,500,000 Active 44 DOM
-
2026-06-09days on market $2,500,000 Active 43 DOM
-
2026-06-08days on market $2,500,000 Active 42 DOM
-
2026-06-07days on market $2,500,000 Active 41 DOM
-
2026-06-07days on market $2,500,000 Active 40 DOM
-
2026-06-04days on market $2,500,000 Active 38 DOM
-
2026-06-03days on market $2,500,000 Active 37 DOM
-
2026-06-02days on market $2,500,000 Active 36 DOM
-
2026-06-01days on market $2,500,000 Active 35 DOM
-
2026-05-31days on market $2,500,000 Active 34 DOM
-
2026-04-27$2,500,000 Active
-
2025-07-14historical $1,250
-
2025-04-23$1,250
-
2024-12-23historical $1,700
-
2024-11-07$1,700
-
2024-08-30historical $1,700
-
2024-08-16$1,700
-
2023-09-15historical $1,480
-
2023-09-06$1,480
-
2023-09-06historical $1,600
-
2023-08-30$1,600
-
2023-08-22historical $1,600
-
2023-08-20$1,600
-
2023-08-14historical $1,600
-
2023-08-10$1,600
-
2015-08-07soldstatus $1,847,000
-
2013-09-10historical
-
2013-05-29soldstatus $885,000 Sold
-
2013-05-29soldstatus $884,900
-
2012-12-03status Pending Feasibility
-
2012-09-20status Active
-
2012-08-23status Pending Feasibility
-
2012-08-08$995,000 Active
-
2005-05-05soldstatus $825,000
-
2005-05-04soldstatus $820,000
-
2005-01-06$849,950
-
1997-09-10soldstatus $499,100
-
1984-06-26soldstatus $235,000
-
1980-04-23soldstatus $160,000
-
1977-12-23soldstatus $96,000
ⓘ Source: listings_history table (triggers on properties + properties_extension) + one-shot
backfill from property_details.listing_events for pre-trigger history.
Tax reassessment forecast WA · Resets to sale price
- Current annual tax
- $21,353 · $1,779/mo
- Projected year-2 tax
- $24,500 · $2,042/mo
- Expected delta
- +$3,147/yr (+$262/mo · 14.7%)
ⓘ Screening estimate from a state-policy table — verify with the county assessor before closing.
Climate risk First Street
- Flood 1/10 Low FEMA zone X (unshaded) · 0% chance over 30 yrs
- Wildfire 1/10 Low
- Heat 3/10 Moderate 7 d/yr ≥86°F today · 15 d/yr by 30 yrs out
- Wind 1/10 Low
- Air quality 7/10 Severe 11 unhealthy d/yr today · 12 by 30 yrs out
Nearby sold comps map
Loading sold comps map…
Walkable amenities ~0.75 mi
Loading nearby amenities…
Taxation est. · year 1
- Rental income
- $335,580
- − Mortgage interest
- −$140,039
- − Property taxes
- −$21,353
- − Insurance
- −$12,500
- − Repairs & maintenance
- −$26,846
- − Management
- −$26,846
- − Depreciation
- −$72,727
- Taxable income
- $35,268
- Est. tax owed @ 24.0%
- −$8,464
- After-tax cash flow
- $65,467/yr
For passive investors: Depreciation is non-cash, so a rental often shows a tax loss while cash-flowing — sheltering income. Rental losses are passive: they offset passive income freely, and up to $25,000/yr can offset ordinary (W-2) income if you actively participate and your MAGI is under $100k (phasing out to $0 by $150k); unused losses carry forward. On sale, claimed depreciation is recaptured at up to 25%, and gains may owe capital-gains tax (a 1031 exchange can defer both). Figures are a year-1 estimate at your 24.0% rate — not tax advice; consult a CPA.
Schools (NCES district)
- District
- Seattle Public Schools
- NCES district ID
- 5307710
- Math proficiency
- 64% ▼ -1.00%
- Reading proficiency
- 72% ▬ 0.00%
- Median HH income
- $68,695
- Composite
- 60.76/100
- National rank
- #1649
- State rank
- #19 of 291 in WA
Livability — Seattle
- Score
- 75/100
- State rank
- #166
- US rank
- #4033
Category grades
Schools grade is shown separately in the Schools card above.
Census & demographics
- Census place
- Seattle, WA
- County
- King County · 2,251,916 people
- City population
- 706,262
- Metro
- Seattle-Tacoma-Bellevue, WA
- Population (ZIP)
- 34,328
- Household income
- $133,663
- Rent vs Own
- Severe rent burden
- 2558.0
Population outlook (King County) Hauer SSP2
- Today (2025)
- 2,576,485 people
- By 2030
- 2,803,316 · +8.8%
- By 2040
- 3,255,921 · +26.4%
- By 2050
- 3,706,444 · +43.9%
- By 2075
- 4,746,063 · +84.2%
- By 2100
- 5,407,730 · +109.9%
Race, ethnicity, and origin ACS 2023
- Neighborhood character
- Diverse neighborhood (Simpson 0.63)
- Race & ethnicity
- White 53% Asian 28% Two or more races 10% Hispanic / Latino 8% Black 3%
- Hispanic origin (detail)
- Mexican 4%
- Common ancestry
- Italian 4% Lithuanian 3% Romanian 3%
- Foreign-born
- 29% · China, Canada, South Korea
- Languages at home
- 71% English-only · Other Indo-European 9% Chinese 6% Spanish 5%
Political lean MEDSL · King
- 2024 margin
- Solid D (+51.7) · D 74.2% · R 22.5% · Other 3.4%
- 2008→2024 swing
- +9.6pp toward D · 2008: 42.1pp · 2024: 51.7pp
- All cycles
- 2024: D+51.7 2020: D+52.7 2016: D+50.4 2012: D+39.9 2008: D+42.1
Not yet ingested
- Civics
- —
Market trends
- HPI YoY
- ▼ -856.11%
- Current HPI
- 239.2734
- Rent YoY
- ▬ 0.04%
- Metro
- Seattle-Tacoma-Bellevue, WA
- State GDP YoY
- ▲ 4.65%
- F500 in state
- 22
Industry mix (Fortune 500 HQ in WA)
| Industry | F500 HQs | Revenue |
|---|---|---|
| Retail | 2 | $269B |
|
||
| Technology / Retail | 1 | $638B |
|
||
| Technology | 1 | $245B |
|
||
| Telecommunications | 1 | $38B |
|
||
| Food / Beverage | 1 | $36B |
|
||
| Automotive / Trucks | 1 | $34B |
|
||
Price history
+2504.2% since first listed30 events — show timeline
- 2026-04-27 Listed $2,500,000 NWMLS as Distributed by MLS Grid
- 2025-07-14 Rental Removed $1,250 LEASESTAR
- 2025-04-23 Listed for Rent $1,250 LEASESTAR
- 2024-12-23 Rental Removed $1,700 LEASESTAR
- 2024-11-07 Listed for Rent $1,700 LEASESTAR
- 2024-08-30 Rental Removed $1,700 LEASESTAR
- 2024-08-16 Listed for Rent $1,700 LEASESTAR
- 2023-09-15 Rental Removed $1,480 LEASESTAR
- 2023-09-06 Listed for Rent $1,480 LEASESTAR
- 2023-09-06 Rental Removed $1,600 LEASESTAR
- 2023-08-30 Listed for Rent $1,600 LEASESTAR
- 2023-08-22 Rental Removed $1,600 LEASESTAR
- 2023-08-20 Listed for Rent $1,600 LEASESTAR
- 2023-08-14 Rental Removed $1,600 LEASESTAR
- 2023-08-10 Listed for Rent $1,600 LEASESTAR
- 2015-08-07 Sold (Public Records) $1,847,000 Public Records
- 2013-09-10 Delisted — NWMLS as Distributed by MLS Grid
- 2013-05-29 Sold (Public Records) $884,900 Public Records
- 2013-05-29 Sold (MLS) $885,000 NWMLS as Distributed by MLS Grid
- 2012-12-03 Pending — NWMLS as Distributed by MLS Grid
- 2012-09-20 Relisted — NWMLS as Distributed by MLS Grid
- 2012-08-23 Pending — NWMLS as Distributed by MLS Grid
- 2012-08-08 Listed $995,000 NWMLS as Distributed by MLS Grid
- 2005-05-05 Sold (MLS) $825,000 NWMLS as Distributed by MLS Grid
- 2005-05-04 Sold (Public Records) $820,000 Public Records
- 2005-01-06 Listed $849,950 NWMLS as Distributed by MLS Grid
- 1997-09-10 Sold (Public Records) $499,100 Public Records
- 1984-06-26 Sold (Public Records) $235,000 Public Records
- 1980-04-23 Sold (Public Records) $160,000 Public Records
- 1977-12-23 Sold (Public Records) $96,000 Public Records
Property tax history
+6.1%/yrLatest (2025): $21,353 · -0.0% YoY. Source: county tax records.
Cash-flow waterfall
monthlySold comps — $/sqft
last 12 mo · ≤1 miLoading sold comps…