1130 Tyree St · Lynchburg, VA
Flood risk 1/10 · Minimal
- FEMA flood zone
- X (unshaded)
- Chance of flooding over 30 yrs
- 0.0%
- Est. flood insurance / yr
- $507 – $1,088
Fire risk 4/10 · Minor
- Est. fire insurance / yr
- $666 – $1,236
Heat risk 6/10 · Moderate
- Hot days now (above 102°F)
- 7 days/yr
- Hot days in 30 yrs
- 18 days/yr
Wind risk 2/10 · Minimal
- Chance of severe wind over 30 yrs
- 2.0%
Air-quality risk 2/10 · Minimal
- Unhealthy air days now
- 0 days/yr
- Unhealthy air days in 30 yrs
- 1 days/yr
Risk factors via First Street. Map © Google.
Why this score? — see what drove the B+ grade
The composite is a weighted blend of 9 inputs, each scored 0–100. Each bar is that input's sub-score; the figure is the points it added to the 100-point composite (weight × sub-score).
- Cash flow +30.0/30.0
- ARV discount +15.0/15.0
- 1% rule +10.0/10.0
- DSCR +10.0/10.0
- Livability +4.5/5.0
- Schools +4.0/10.0
- Rent growth +3.6/5.0
- Condition / age +2.5/5.0
- Appreciation +0.0/10.0
$70,000
🖨 Deal sheet 📄 Offer letter ✓ Due diligence
Listing remarks MLS
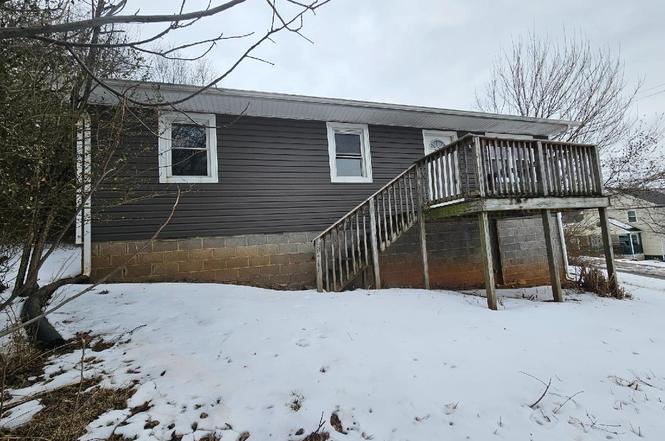
Completely remodeled & Move-in-Ready! New Ceiling fans, light fixtures, hardwood floors refinished, new paint and doors, completely updated bathroom and kitchen with new stainless steel appliances and white granite countertop. New front and back doors, new windows, roof, and siding. HVAC recently serviced. Schedule your showing before this one is gone!
Key facts
- 0.25 acre lot
- Built 1967
- Listed 14 days
Neighborhood map
What this means for you Summary
Snapshot
- This is a 3-bed/1.0-bath single-family listed at $70k.
Deal economics
- At list price, monthly cash flow is $513 ($6k/yr) — positive.
- The deal already cash-flows at list — no discount required.
- Meets the 1% rule at list price ($1k rent vs $70k).
- Cap rate 15.1% vs local median 4.0% in Lynchburg — top-decile yield for the area; either an underpriced asset or a hidden risk that comps aren't pricing in. Stress-test before assuming the spread holds.
Location & tenants
- Location reads 91/100 on livability (#1 in VA, #58 nationally) — a professional / high-income tenant draw. Strengths: amenities A+, commute A+, cost of living A+; Watch: crime C-, employment D+.
- Lynchburg City Public School District (urban): math 36% / reading 61% proficiency, ranked #104 of 131 in VA (top 79%) — families likely to look elsewhere, expect single-tenant / working-renter base with shorter leases; 61% free/reduced lunch — lower-income household profile, screen leases tightly.
- Zoned schools: Sandusky Middle (math 29% / reading 52%, grade F, #303 of 342 statewide, top 89%, 568 students, 96% FRL); Heritage High (math 32% / reading 77%, grade C-, #281 of 319 statewide, top 90%, 1,073 students, 94% FRL) — zoned schools average 95% FRL vs 61% district-wide (34 pts higher); higher-poverty schools than district average — tighter screening recommended.
- Market conditions: Rents rising fast (+4.6%/yr); 105 active listings in the ZIP; 3 comparable units currently listed for rent nearby; rentals lingering (median 44d on market — plan ~5-8 weeks vacancy on turnover, expect pricing pressure); 67% of comp listings sitting > 30 days — soft ceiling on asking rent; 472 units permitted in Lynchburg city in 2024 (240 in 5+ unit buildings).
Forward outlook
- Local home prices are declining (-3.0%/yr); year-one equity from $484 of loan paydown is wiped out by about $2k of value loss. Plan a longer hold.
- Lynchburg County population projected at +37% by 2050 — long-run rental-demand tailwind backs the buy-and-hold thesis.
- At projected returns (-3.0% appreciation + 4.6% rent growth), your $20k cash investment doubles in ~4 years — after that, you're playing with house money.
Negotiation context
- Only 14 days on market — expect competitive offers; lowballing is unlikely to land.
- 5 sale attempts since 6y ago with the ask held roughly flat each time — persistent listings suggest the price (not the market) is what's stuck; bring a comps-based counter.
Risks & watch-outs
- Climate carrying-cost: extreme-heat days projected 7→18/yr by 2055 (HVAC capex compounding) — expect insurance premiums to compound above CPI over the hold.
Questions for the listing agent
- Built in 1967 — when were the roof, HVAC, electrical panel, plumbing, and water heater last replaced?
- Is there a deadline driving the sale (1031 exchange, divorce, estate, relocation)? That informs how much negotiation room exists.
- Schools are A-rated — typically a magnet for longer-tenancy family renters. What's the average tenant stay here, and is there a school-zone premium baked into asking?
- What's the average days-on-market for RENTAL listings here right now (not sales)? A rising rental-DOM trend means longer vacancies and softer asking-rent achievability than the comps imply.
- What's the recent tenant-quality profile in this submarket — average credit score on applications, eviction rate, late-payment / NSF rate, and stable-employment percentage? A property-management company in the area should have these aggregated.
- How much new for-sale + rental construction is in the pipeline within 1–3 miles? Heavy new supply typically softens prices + rents 12–24 months out; constrained supply supports both.
Investment metrics
- 1% rule
- 1.80% ✓
- Cap rate
- 15.09%
- Cash-on-cash
- 31.42%
- DSCR
- 2.40
- GRM
- 4.6
CMA / ARV
- ARV (on-the-fly)
- $121,100
- Comps found
- 12
Show comp detail 12 sales within ~0.75 mi
| Address | Dist | Beds/Ba | Sqft | Sold | Price | $/sf | Match |
|---|---|---|---|---|---|---|---|
| 1130 Tyree St | 0.00mi | 3/1.0 | 792 (+13%) | 0mo | $65,539 | $83 | 78 |
| 2204 Preston St | 0.03mi | 2/1.0 (-1) | 750 (+7%) | 15mo | $115,900 | $155 | 69 |
| 1112 Virginia St | 0.09mi | 2/1.0 (-1) | 768 (+10%) | 13mo | $149,900 | $195 | 64 |
| 2024 Poplar St | 0.30mi | 2/1.0 (-1) | 741 (+6%) | 11mo | $115,000 | $155 | 62 |
| 626 Florida Ave | 0.35mi | 2/1.0 (-1) | 663 (-5%) | 18mo | $27,000 | $41 | 55 |
| 2022 Hughes Ave | 0.68mi | 2/1.0 (-1) | 736 (+5%) | 1mo | $129,900 | $176 | 54 |
| 1846 Easley Ave | 0.63mi | 2/1.0 (-1) | 728 (+4%) | 16mo | $127,500 | $175 | 46 |
| 1107 14th St | 0.70mi | 2/1.0 (-1) | 768 (+10%) | 0mo | $55,000 | $72 | 46 |
| 3301 Missouri Ave | 0.69mi | 2/1.0 (-1) | 682 (-3%) | 19mo | $139,900 | $205 | 43 |
| 2 Powhatan St | 0.75mi | 2/1.0 (-1) | 689 (-2%) | 20mo | $119,900 | $174 | 41 |
| 1805 Ridge Ave | 0.73mi | 2/1.0 (-1) | 771 (+10%) | 6mo | $89,500 | $116 | 39 |
| 2417 Campbell Ave | 0.67mi | 2/1.0 (-1) | 768 (+10%) | 20mo | $132,900 | $173 | 31 |
Match score weights: distance 35% · size 25% · config 20% · recency 20%. Top-matched comps best support the ARV.
Projected returns pro-forma
-3.0% appreciation · 4.56% rent growth · sell at horizon
- IRR
- 28.1%
- Equity multiple
- 2.19×
- Total profit
- $23,367
- Equity at exit
- $10,437
- IRR
- 36.4%
- Equity multiple
- 4.62×
- Total profit
- $71,012
- Equity at exit
- $6,052
Cash invested: $19,600 (down + closing). Projections, not guarantees.
Landlord ↔ Tenant lean methodology
- Overall (STATE)
- 55 Moderately Landlord-Leaning
- State Virginia
- 55 Moderately Landlord-Leaning · D+2
- County
- — inherits STATE
- City
- — inherits STATE
ZIP-level market 24504
- Home prices YoY
- -12.7%
- Rents YoY
- 4.6%
- Active inventory
- 105
- Price-to-rent
- 4.6×
Monthly cashflow live
- Estimated rent
- $1,260 medium interval (Pro) →
- Mortgage (P&I)
- −$367
- Tax from tax record
- −$86 /mo · $1,027/yr
- Insurance
- −$29
- HOA
- −$0
- Vacancy / Maint / Mgmt
- −$265
- Net cashflow
- $513
Break-even live
UW: 25.0% down · 7.5% · 30yr · 1.5% tax · 5.0% vac · 8.0% maint · 8.0% mgmt
Financing live
Cash to close
- Down payment
- $17,500
- Closing costs
- $2,100
- Reserves months
- —
- Total cash needed
- —
Loan-product check · same deal, 3 products live
Conventional
25% down · 7.5% · 30yr
- Down + closing
- —
- Monthly P&I
- —
- Monthly cashflow
- —
- DSCR
- —
- Eligible?
- —
Personal DTI + credit; lowest rate.
DSCR
20% down · 8.5% · 30yr
- Down + closing
- —
- Monthly P&I
- —
- Monthly cashflow
- —
- DSCR
- —
- Eligible?
- —
No personal income docs; deal must DSCR.
Hard money
10% down · 12.0% · 12mo
- Down + closing
- —
- Monthly P&I
- —
- Monthly cashflow
- —
- DSCR
- —
- Eligible?
- —
Short-term bridge; refi at stabilization.
Rent comps 3 comps
| Address | Beds | Baths | Sqft | Rent | $/sqft | DOM | Units | Dist |
|---|---|---|---|---|---|---|---|---|
| 1810 Laurel St Lynchburg, VA | 2.0 | 1.0 | 720 | $995 | $1.38 | 43d | 1 | 0.58mi |
| 2734 Fort Ave Lynchburg, VA | 1.0–2.0 | 1.0–2.0 | 875 | $1,450 | $1.66 | 43d | 1 | 1.32mi |
| 612 Commerce St Lynchburg, VA | 1.0–2.0 | 1.0–2.0 | 716 | $1,250 | $1.74 | 13d | 2 | 1.36mi |
Listing history 14 events
-
2026-04-27status Pending
-
2026-04-23status Active
-
2026-02-20status Pending
-
2026-02-10$70,000 Active
-
2025-12-22soldstatus $96,635
-
2025-09-25historical
-
2025-08-27$125,000 Active
-
2020-08-26soldstatus $104,000
-
2020-08-24soldstatus $104,000 360-char remark
Show marketing remark (360 chars)
Completely remodeled & Move-in-Ready! New Ceiling fans, light fixtures, hardwood floors refinished, new paint and doors, completely updated bathroom and kitchen with new stainless steel appliances and white granite countertop. New front and back doors, new windows, roof, and siding. HVAC recently serviced. Schedule your showing before this one is gone!
-
2020-06-03$104,900 360-char remark
Show marketing remark (360 chars)
Completely remodeled & Move-in-Ready! New Ceiling fans, light fixtures, hardwood floors refinished, new paint and doors, completely updated bathroom and kitchen with new stainless steel appliances and white granite countertop. New front and back doors, new windows, roof, and siding. HVAC recently serviced. Schedule your showing before this one is gone!
-
2020-02-19soldstatus $22,500
-
2020-02-19soldstatus $22,500
-
2020-02-03$22,200
-
1992-08-12soldstatus $18,150
ⓘ Source: listings_history table (triggers on properties + properties_extension) + one-shot
backfill from property_details.listing_events for pre-trigger history.
Tax reassessment forecast VA · Resets to sale price
- Current annual tax
- $1,027 · $86/mo
- Projected year-2 tax
- $1,027 · $86/mo
- Expected delta
- $0/yr ($0/mo · 0.0%)
ⓘ Screening estimate from a state-policy table — verify with the county assessor before closing.
Climate risk First Street
- Flood 1/10 Low FEMA zone X (unshaded) · 0% chance over 30 yrs
- Wildfire 4/10 Moderate
- Heat 6/10 Major 7 d/yr ≥102°F today · 18 d/yr by 30 yrs out
- Wind 2/10 Low 2% chance of damaging wind over 30 yrs
- Air quality 2/10 Low 0 unhealthy d/yr today · 1 by 30 yrs out
Nearby sold comps map
Loading sold comps map…
Walkable amenities ~0.75 mi
Loading nearby amenities…
Taxation est. · year 1
- Rental income
- $15,115
- − Mortgage interest
- −$3,921
- − Property taxes
- −$1,027
- − Insurance
- −$350
- − Repairs & maintenance
- −$1,209
- − Management
- −$1,209
- − Depreciation
- −$2,036
- Taxable income
- $5,361
- Est. tax owed @ 24.0%
- −$1,287
- After-tax cash flow
- $4,871/yr
For passive investors: Depreciation is non-cash, so a rental often shows a tax loss while cash-flowing — sheltering income. Rental losses are passive: they offset passive income freely, and up to $25,000/yr can offset ordinary (W-2) income if you actively participate and your MAGI is under $100k (phasing out to $0 by $150k); unused losses carry forward. On sale, claimed depreciation is recaptured at up to 25%, and gains may owe capital-gains tax (a 1031 exchange can defer both). Figures are a year-1 estimate at your 24.0% rate — not tax advice; consult a CPA.
Schools (NCES district)
- District
- Lynchburg City Public School District
- NCES district ID
- 5102340
- Math proficiency
- 36% ▼ -38.00%
- Reading proficiency
- 61% ▼ -8.00%
- Median HH income
- $39,097
- Composite
- 40.4/100
- National rank
- #3730
- State rank
- #104 of 131 in VA
Livability — Lynchburg
- Score
- 91/100
- State rank
- #1
- US rank
- #58
Category grades
Schools grade is shown separately in the Schools card above.
Census & demographics
- Census place
- Lynchburg, VA
- County
- Lynchburg City · 97,036 people
- City population
- 97,036
- Metro
- Lynchburg, VA
- Population (ZIP)
- 9,632
- Household income
- $52,571
- Rent vs Own
- Severe rent burden
- 552.0
Population outlook (Lynchburg County) Hauer SSP2
- Today (2025)
- 87,977 people
- By 2030
- 93,626 · +6.4%
- By 2040
- 106,145 · +20.7%
- By 2050
- 120,783 · +37.3%
- By 2075
- 162,249 · +84.4%
- By 2100
- 191,358 · +117.5%
Race, ethnicity, and origin ACS 2023
- Neighborhood character
- Diverse neighborhood (Simpson 0.57)
- Race & ethnicity
- White 51% Black 40% Two or more races 6% Hispanic / Latino 4%
- Common ancestry
- Italian 3% Lithuanian 1% Serbian 1%
- Foreign-born
- 4% · Canada, China
- Languages at home
- 95% English-only · Spanish 3% Chinese 1%
Political lean MEDSL · Lynchburg
- 2024 margin
- Lean R (+7.9) · D 45.4% · R 53.3% · Other 1.3%
- 2008→2024 swing
- -3.9pp toward R · 2008: -4.0pp · 2024: -7.9pp
- All cycles
- 2024: R+7.9 2020: D+2.6 2016: R+9.0 2012: R+10.6 2008: R+4.0
Not yet ingested
- Civics
- —
Market trends
- HPI YoY
- ▼ -33.39%
- Current HPI
- 229.4423
- Rent YoY
- ▲ 4.56%
- Metro
- Lynchburg, VA
- State GDP YoY
- ▲ 2.40%
- F500 in state
- 50
Industry mix (Fortune 500 HQ in VA)
| Industry | F500 HQs | Revenue |
|---|---|---|
| Aerospace / Defense | 4 | $236B |
|
||
| Technology / Defense | 3 | $32B |
|
||
| Financial Services | 2 | $176B |
|
||
| Utilities | 2 | $27B |
|
||
| Insurance | 2 | $25B |
|
||
| Technology | 2 | $15B |
|
||
Price history
+285.7% since first listed14 events — show timeline
- 2026-04-27 Pending — LMLS
- 2026-04-23 Relisted — LMLS
- 2026-02-20 Pending — LMLS
- 2026-02-10 Listed $70,000 LMLS
- 2025-12-22 Sold (Public Records) $96,635 Public Records
- 2025-09-25 Listing Removed — CVRMLS
- 2025-08-27 Listed $125,000 CVRMLS
- 2020-08-26 Sold (Public Records) $104,000 Public Records
- 2020-08-24 Sold (MLS) $104,000 LMLS
- 2020-06-03 Listed $104,900 LMLS
- 2020-02-19 Sold (Public Records) $22,500 Public Records
- 2020-02-19 Sold (MLS) $22,500 LMLS
- 2020-02-03 Listed $22,200 LMLS
- 1992-08-12 Sold (Public Records) $18,150 Public Records
Property tax history
+10.9%/yrLatest (2025): $1,027 · +12.0% YoY. Source: county tax records.
Cash-flow waterfall
monthlySold comps — $/sqft
last 12 mo · ≤1 miLoading sold comps…