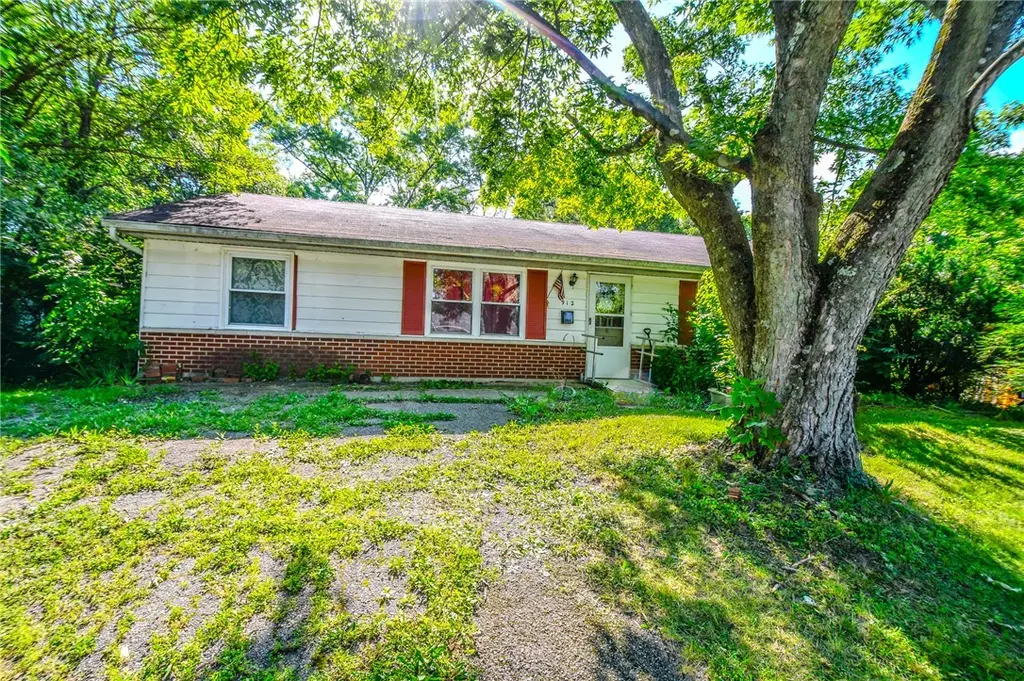
912 Greenheart Dr · New Carlisle, OH
Flood risk 1/10 · Minimal
- FEMA flood zone
- X (unshaded)
- Chance of flooding over 30 yrs
- 0.0%
- Est. flood insurance / yr
- $507 – $1,088
Fire risk 1/10 · Minimal
- Est. fire insurance / yr
- $713 – $1,323
Heat risk 3/10 · Minor
- Hot days now (above 100°F)
- 7 days/yr
- Hot days in 30 yrs
- 18 days/yr
Wind risk 2/10 · Minimal
- Chance of severe wind over 30 yrs
- —
Air-quality risk 3/10 · Minor
- Unhealthy air days now
- 3 days/yr
- Unhealthy air days in 30 yrs
- 5 days/yr
Risk factors via First Street. Map © Google.
Why this score? — see what drove the B- grade
The composite is a weighted blend of 9 inputs, each scored 0–100. Each bar is that input's sub-score; the figure is the points it added to the 100-point composite (weight × sub-score).
- Cash flow +24.9/30.0
- ARV discount +15.0/15.0
- DSCR +8.1/10.0
- 1% rule +6.3/10.0
- Schools +3.8/10.0
- Livability +3.2/5.0
- Rent growth +2.5/5.0
- Condition / age +2.5/5.0
- Appreciation +0.0/10.0
$119,900
🖨 Deal sheet 📄 Offer letter ✓ Due diligence
Listing remarks
Don't miss this opportunity for home ownership. This ranch, built in 1971, offers 1250 square feet of living space. It features updated HVAC for efficient heating and cooling, along with replacement windows. While the home needs significant TLC, it presents an excellent opportunity for those looking to customize and restore a solid foundation in a desirable neighborhood.
Key facts
- Solid foundation
- Updated hvac
- Replacement windows
Tags
Property features AI
Finance
- Financial info: Offered for sale
Exterior
- Parking: No garage
- Utilities: Central air conditioning; Natural gas heating
- Home design: Single-story frame home; Slab foundation
- Construction: Frame construction; Slab foundation; One story
- Exterior features: Residential lot approximately 0.20 acres (70 x 125)
Interior
- Kitchen: Eat-in kitchen with extended space (27 x 11)
- Bedrooms: Three main-level bedrooms
- Bathrooms: One full bathroom (main level)
- Heating & cooling: Central air conditioning; Forced air heating (natural gas)
- Interior features: Eat-in kitchen; Bonus room
- Laundry & utility: Main-level laundry room (7 x 6)
Neighborhood map
What this means for you Summary
Snapshot
- This is a 3-bed/1.0-bath single-family listed at $120k.
Deal economics
- At list price, monthly cash flow is $257 ($3k/yr) — positive.
- The deal already cash-flows at list — no discount required.
- Meets the 1% rule at list price ($1k rent vs $120k).
- Cap rate 8.9% vs local median 2.4% in New Carlisle — top-decile yield for the area; either an underpriced asset or a hidden risk that comps aren't pricing in. Stress-test before assuming the spread holds.
Location & tenants
- Location reads 63/100 on livability (#857 in OH) — a middle-class / working-renter tenant base. Strengths: cost of living A+, housing A+; Watch: schools D+, amenities F, commute F.
- Tecumseh Local (rural): math 41% / reading 48% proficiency, ranked #501 of 656 in OH (top 76%) — families likely to look elsewhere, expect single-tenant / working-renter base with shorter leases.
- Market conditions: 107 active listings in the ZIP; 1 comparable units currently listed for rent nearby; 232 units permitted in Clark County in 2024 (116 in 5+ unit buildings).
Forward outlook
- Local home prices are declining (-3.0%/yr); year-one equity from $829 of loan paydown is wiped out by about $4k of value loss. Plan a longer hold.
- Clark County population projected at -16% by 2050 — secular population decline; favor cash flow + early exit over multi-decade hold.
Negotiation context
- Only 1 days on market — expect competitive offers; lowballing is unlikely to land.
- Current owner paid $64k; list at $120k implies a 87% gain — meaningful room to come down on a strong offer.
Questions for the listing agent
- Built in 1971 — when were the roof, HVAC, electrical panel, plumbing, and water heater last replaced?
- Is there a deadline driving the sale (1031 exchange, divorce, estate, relocation)? That informs how much negotiation room exists.
- Schools are D-rated, which usually means shorter tenancies and higher turnover. Who's the typical renter profile here, and what's been the actual vacancy rate?
- What's the average days-on-market for RENTAL listings here right now (not sales)? A rising rental-DOM trend means longer vacancies and softer asking-rent achievability than the comps imply.
- What's the recent tenant-quality profile in this submarket — average credit score on applications, eviction rate, late-payment / NSF rate, and stable-employment percentage? A property-management company in the area should have these aggregated.
- How much new for-sale + rental construction is in the pipeline within 1–3 miles? Heavy new supply typically softens prices + rents 12–24 months out; constrained supply supports both.
Investment metrics
- 1% rule
- 1.13% ✓
- Cap rate
- 8.86%
- Cash-on-cash
- 9.17%
- DSCR
- 1.41
- GRM
- 7.4
CMA / ARV
- ARV (on-the-fly)
- $207,500
- Comps found
- 12
Show comp detail 12 sales within ~0.75 mi
| Address | Dist | Beds/Ba | Sqft | Sold | Price | $/sf | Match |
|---|---|---|---|---|---|---|---|
| 930 Firwood Dr | 0.10mi | 4/1.0 (+1) | 1,250 (0%) | 6mo | $187,000 | $150 | 85 |
| 1113 Langdale Ave | 0.45mi | 3/1.5 | 1,201 (-4%) | 4mo | $216,200 | $180 | 67 |
| 1215 W Lake Ave | 0.14mi | 3/1.0 | 1,107 (-11%) | 9mo | $175,000 | $158 | 67 |
| 613 Spinning Rd | 0.32mi | 3/1.0 | 1,180 (-6%) | 12mo | $205,000 | $174 | 66 |
| 1201 Edgebrook Ave | 0.40mi | 3/1.5 | 1,232 (-1%) | 13mo | $240,000 | $195 | 66 |
| 1300 Edgebrook Ave | 0.32mi | 3/2.0 | 1,380 (+10%) | 2mo | $234,900 | $170 | 62 |
| 503 Pease Dr | 0.73mi | 3/2.0 | 1,248 (-0%) | 1mo | $170,000 | $136 | 61 |
| 1138 Edgebrook Ave | 0.42mi | 3/1.5 | 1,342 (+7%) | 10mo | $265,000 | $197 | 58 |
| 706 Bayberry Dr | 0.37mi | 4/1.0 (+1) | 1,170 (-6%) | 12mo | $184,500 | $158 | 58 |
| 1001 Langdale Ave | 0.60mi | 3/1.5 | 1,336 (+7%) | 4mo | $145,000 | $109 | 55 |
| 809 Bayberry Dr | 0.34mi | 3/2.0 | 1,379 (+10%) | 10mo | $229,000 | $166 | 55 |
| 322 Galewood Dr | 0.60mi | 3/1.0 | 1,184 (-5%) | 11mo | $180,000 | $152 | 54 |
Match score weights: distance 35% · size 25% · config 20% · recency 20%. Top-matched comps best support the ARV.
Projected returns pro-forma
-3.0% appreciation · 3.0% rent growth · sell at horizon
- IRR
- -2.4%
- Equity multiple
- 0.91×
- Total profit
- $-3,083
- Equity at exit
- $17,877
- IRR
- 7.3%
- Equity multiple
- 1.55×
- Total profit
- $18,389
- Equity at exit
- $10,367
Cash invested: $33,572 (down + closing). Projections, not guarantees.
Landlord ↔ Tenant lean methodology
- Overall (STATE)
- 73 Landlord-Friendly
- State Ohio
- 73 Landlord-Friendly · R+6
- County
- — inherits STATE
- City
- — inherits STATE
ZIP-level market 45344
- Active inventory
- 107
- Price-to-rent
- 7.4×
Monthly cashflow live
- Estimated rent
- $1,350 medium interval (Pro) →
- Mortgage (P&I)
- −$629
- Tax from tax record
- −$131 /mo · $1,575/yr
- Insurance
- −$50
- HOA
- −$0
- Vacancy / Maint / Mgmt
- −$284
- Net cashflow
- $257
Break-even live
UW: 25.0% down · 7.5% · 30yr · 1.5% tax · 5.0% vac · 8.0% maint · 8.0% mgmt
Financing live
Cash to close
- Down payment
- $29,975
- Closing costs
- $3,597
- Reserves months
- —
- Total cash needed
- —
Loan-product check · same deal, 3 products live
Conventional
25% down · 7.5% · 30yr
- Down + closing
- —
- Monthly P&I
- —
- Monthly cashflow
- —
- DSCR
- —
- Eligible?
- —
Personal DTI + credit; lowest rate.
DSCR
20% down · 8.5% · 30yr
- Down + closing
- —
- Monthly P&I
- —
- Monthly cashflow
- —
- DSCR
- —
- Eligible?
- —
No personal income docs; deal must DSCR.
Hard money
10% down · 12.0% · 12mo
- Down + closing
- —
- Monthly P&I
- —
- Monthly cashflow
- —
- DSCR
- —
- Eligible?
- —
Short-term bridge; refi at stabilization.
Rent comps 1 comps
| Address | Beds | Baths | Sqft | Rent | $/sqft | DOM | Units | Dist |
|---|---|---|---|---|---|---|---|---|
| 1118 Cambridge Ct Unit 1118 New Carlisle, OH | 3.0 | 1.5 | 1450 | $1,350 | $0.93 | 14d | 1 | 0.64mi |
Listing history 2 events
-
2026-06-13remarks 373-char remark
-
2026-06-13$119,900 Pending 1 DOM
ⓘ Source: listings_history table (triggers on properties + properties_extension) + one-shot
backfill from property_details.listing_events for pre-trigger history.
Tax reassessment forecast OH · Partial reset (capped growth)
- Current annual tax
- $1,575 · $131/mo
- Projected year-2 tax
- $1,723 · $144/mo
- Expected delta
- +$148/yr (+$12/mo · 9.4%)
ⓘ Screening estimate from a state-policy table — verify with the county assessor before closing.
Climate risk First Street
- Flood 1/10 Low FEMA zone X (unshaded) · 0% chance over 30 yrs
- Wildfire 1/10 Low
- Heat 3/10 Moderate 7 d/yr ≥100°F today · 18 d/yr by 30 yrs out
- Wind 2/10 Low
- Air quality 3/10 Moderate 3 unhealthy d/yr today · 5 by 30 yrs out
Nearby sold comps map
Loading sold comps map…
Walkable amenities ~0.75 mi
Loading nearby amenities…
Taxation est. · year 1
- Rental income
- $16,200
- − Mortgage interest
- −$6,716
- − Property taxes
- −$1,575
- − Insurance
- −$600
- − Repairs & maintenance
- −$1,296
- − Management
- −$1,296
- − Depreciation
- −$3,488
- Taxable income
- $1,229
- Est. tax owed @ 24.0%
- −$295
- After-tax cash flow
- $2,783/yr
For passive investors: Depreciation is non-cash, so a rental often shows a tax loss while cash-flowing — sheltering income. Rental losses are passive: they offset passive income freely, and up to $25,000/yr can offset ordinary (W-2) income if you actively participate and your MAGI is under $100k (phasing out to $0 by $150k); unused losses carry forward. On sale, claimed depreciation is recaptured at up to 25%, and gains may owe capital-gains tax (a 1031 exchange can defer both). Figures are a year-1 estimate at your 24.0% rate — not tax advice; consult a CPA.
Schools (NCES district)
- District
- Tecumseh Local
- NCES district ID
- 3904624
- Math proficiency
- 41% ▼ -12.00%
- Reading proficiency
- 48% ▼ -8.00%
- Median HH income
- $45,927
- Composite
- 37.81/100
- National rank
- #4336
- State rank
- #501 of 656 in OH
Livability — New Carlisle
- Score
- 63/100
- State rank
- #857
- US rank
- #16079
Category grades
Schools grade is shown separately in the Schools card above.
Census & demographics
- Census place
- New Carlisle, OH
- County
- Clark · 134,280 people
- City population
- 16,841
- Metro
- Springfield, OH
- Population (ZIP)
- 16,841
- Household income
- $71,627
- Rent vs Own
- Severe rent burden
- 15.0
Population outlook (Clark County) Hauer SSP2
- Today (2025)
- 130,703 people
- By 2030
- 126,952 · -2.9%
- By 2040
- 118,344 · -9.5%
- By 2050
- 109,590 · -16.2%
- By 2075
- 89,464 · -31.6%
- By 2100
- 68,810 · -47.4%
Race, ethnicity, and origin ACS 2023
- Neighborhood character
- Predominantly White (89%)
- Race & ethnicity
- White 89% Hispanic / Latino 8% Two or more races 5%
- Hispanic origin (detail)
- Mexican 6% Puerto Rican 2%
- Common ancestry
- Italian 4% Lithuanian 2% Slovak 2%
- Foreign-born
- 3% · Canada
- Languages at home
- 92% English-only · Spanish 7% Other Indo-European 1%
Political lean MEDSL · Clark
- 2024 margin
- Strong R (+29.5) · D 34.8% · R 64.3%
- 2008→2024 swing
- -27.0pp toward R · 2008: -2.5pp · 2024: -29.5pp
- All cycles
- 2024: R+29.5 2020: R+23.3 2016: R+19.5 2012: R+1.8 2008: R+2.5
Not yet ingested
- Civics
- —
Market trends
- HPI YoY
- ▼ -185.40%
- Current HPI
- 244.7603
- Rent YoY
- —
- Metro
- —
- State GDP YoY
- ▲ 1.98%
- F500 in state
- 48
Industry mix (Fortune 500 HQ in OH)
| Industry | F500 HQs | Revenue |
|---|---|---|
| Insurance | 3 | $145B |
|
||
| Industrial Machinery | 3 | $49B |
|
||
| Financial Services | 3 | $24B |
|
||
| Consumer Goods | 2 | $93B |
|
||
| Aerospace / Defense | 2 | $47B |
|
||
| Utilities | 2 | $33B |
|
||
Price history
+233.1% since first listed4 events — show timeline
- 2026-06-11 Pending — Dayton MLS
- 2026-06-09 Listed $119,900 Dayton MLS
- 1995-05-16 Sold (Public Records) $64,000 Public Records
- 1987-11-19 Sold (Public Records) $36,000 Public Records
Property tax history
+4.4%/yrLatest (2025): $1,575 · +15.5% YoY. Source: county tax records.
Cash-flow waterfall
monthlySold comps — $/sqft
last 12 mo · ≤1 miLoading sold comps…