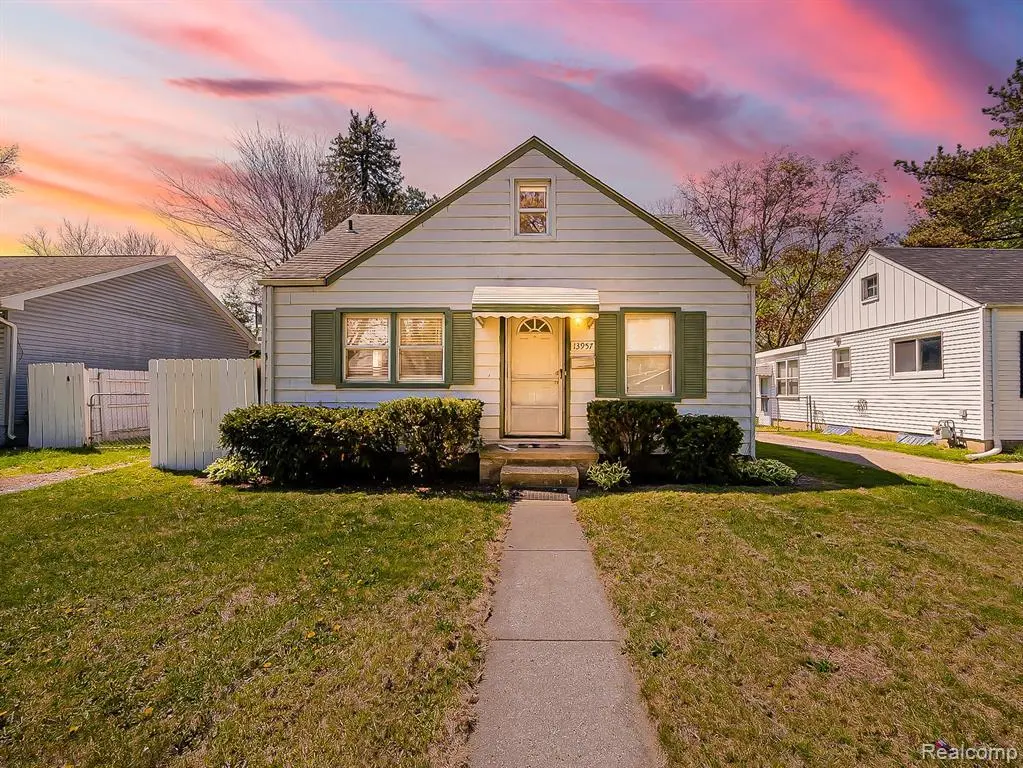
13957 San Jose Ave · Redford, MI
Flood risk 3/10 · Minor
- FEMA flood zone
- X (shaded)
- Chance of flooding over 30 yrs
- 0.2%
- Est. flood insurance / yr
- $507 – $1,088
Fire risk 1/10 · Minimal
- Est. fire insurance / yr
- $784 – $1,456
Heat risk 3/10 · Minor
- Hot days now (above 98°F)
- 7 days/yr
- Hot days in 30 yrs
- 14 days/yr
Wind risk 2/10 · Minimal
- Chance of severe wind over 30 yrs
- —
Air-quality risk 3/10 · Minor
- Unhealthy air days now
- 2 days/yr
- Unhealthy air days in 30 yrs
- 3 days/yr
Risk factors via First Street. Map © Google.
Why this score? — see what drove the C grade
The composite is a weighted blend of 9 inputs, each scored 0–100. Each bar is that input's sub-score; the figure is the points it added to the 100-point composite (weight × sub-score).
- Cash flow +21.6/30.0
- ARV discount +15.0/15.0
- DSCR +6.9/10.0
- 1% rule +6.1/10.0
- Rent growth +3.3/5.0
- Livability +2.5/5.0
- Condition / age +2.5/5.0
- Schools +1.8/10.0
- Appreciation +0.0/10.0
$139,900
🖨 Deal sheet 📄 Offer letter ✓ Due diligence
Listing remarks MLS
Adorable, affordable bungalow. 1 bedroom down and finished upper level could possibly be 2 bedrooms. Large yard, 1 car extra long garage, central air. Newer roof and HWH. Updated bath. Appliances stay! Move in ready. South Redford schools.
Key facts
- Outdoor space
- Oversized lot
- Detached garage
Tags
Property features AI
Exterior
- Parking: Detached 1-car garage
- Utilities: Public water; Public sewer
- Home design: Single-family residence; Two levels; Ground-level entry; Aluminum siding
- Construction: Asphalt roof
- Exterior features: Awning(s); Front porch; Back yard with fencing; Paved road access
Interior
- Bathrooms: One full bathroom
- Heating & cooling: Forced air heating (natural gas); No central air
- Interior features: Crawl space basement; Five total rooms
Neighborhood map
What this means for you Summary
Snapshot
- This is a 2-bed/1.0-bath single-family listed at $140k.
Deal economics
- At list price, monthly cash flow is $211 ($3k/yr) — positive.
- The deal already cash-flows at list — no discount required.
- Meets the 1% rule at list price ($2k rent vs $140k).
- Recommended offer: $136k (3.0% below list) — sets the bar for market timing.
Location & tenants
- Location reads: area grade C — affects rentability + tenant quality, not the cash-flow math above.
- South Redford School District (suburban): math 11% / reading 29% proficiency, ranked #455 of 540 in MI (top 84%) — low school quality limits family demand, transient renter base, plan for 1-2y turnover.
- Market conditions: Rents rising (+3.2%/yr); 188 active listings in the ZIP; 5 comparable units currently listed for rent nearby; rentals at typical pace (median 17d on market — plan ~3-4 weeks tenant-placement turnaround); 2,639 units permitted in Wayne County in 2024 (1,216 in 5+ unit buildings).
Forward outlook
- Local home prices are declining (-3.0%/yr); year-one equity from $967 of loan paydown is wiped out by about $4k of value loss. Plan a longer hold.
- Wayne County population projected at -17% by 2050 — secular population decline; favor cash flow + early exit over multi-decade hold.
Negotiation context
- It's been on market 42 days — a 3% lower offer ($136k) is reasonable based on typical stale-listing flexibility.
- 7 sale attempts since 16y ago; this cycle's ask has dropped $10k (7%) from the opening price — seller is motivated, your offer sets the floor, not the list.
- Current owner paid $35k; list at $140k implies a 300% gain — meaningful room to come down on a strong offer.
Risks & watch-outs
- Watch-outs: built in 1940 — expect roof / HVAC / electrical / plumbing capex.
Questions for the listing agent
- It's been on market 42 days. Have you received any prior offers? Is the seller open to a 3% concession, seller financing, or rate buy-down credit?
- Built in 1940 — when were the roof, HVAC, electrical panel, plumbing, and water heater last replaced?
- Is there a deadline driving the sale (1031 exchange, divorce, estate, relocation)? That informs how much negotiation room exists.
- What's the average days-on-market for RENTAL listings here right now (not sales)? A rising rental-DOM trend means longer vacancies and softer asking-rent achievability than the comps imply.
- What's the recent tenant-quality profile in this submarket — average credit score on applications, eviction rate, late-payment / NSF rate, and stable-employment percentage? A property-management company in the area should have these aggregated.
- How much new for-sale + rental construction is in the pipeline within 1–3 miles? Heavy new supply typically softens prices + rents 12–24 months out; constrained supply supports both.
Investment metrics
- 1% rule
- 1.11% ✓
- Cap rate
- 8.11%
- Cash-on-cash
- 6.47%
- DSCR
- 1.29
- GRM
- 7.5
CMA / ARV
- ARV (median comp)
- $168,441
- List price
- $139,900
- Delta
- -16.94%
- Verdict
- UNDERPRICED
- Comps
- 20 within 1.0 mi
Show comp detail 6 sales within ~0.75 mi
| Address | Dist | Beds/Ba | Sqft | Sold | Price | $/sf | Match |
|---|---|---|---|---|---|---|---|
| 14078 Mercedes | 0.12mi | 2/1.0 | 750 (-8%) | 13mo | $147,000 | $196 | 71 |
| 14396 Inkster Rd | 0.38mi | 2/1.0 | 846 (+4%) | 7mo | $139,000 | $164 | 69 |
| 14173 San Jose Ave | 0.22mi | 2/1.0 | 701 (-14%) | 4mo | $167,500 | $239 | 64 |
| 14028 Mercedes | 0.07mi | 3/1.0 (+1) | 912 (+12%) | 22mo | $165,500 | $181 | 53 |
| 14851 Cavell St | 0.73mi | 3/1.0 (+1) | 892 (+10%) | 14mo | $190,000 | $213 | 32 |
| 13544 Centralia | 0.75mi | 3/1.0 (+1) | 900 (+11%) | 18mo | $177,000 | $197 | 27 |
Match score weights: distance 35% · size 25% · config 20% · recency 20%. Top-matched comps best support the ARV.
Projected returns pro-forma
-3.0% appreciation · 3.25% rent growth · sell at horizon
- IRR
- -6.0%
- Equity multiple
- 0.78×
- Total profit
- $-8,766
- Equity at exit
- $20,860
- IRR
- 4.0%
- Equity multiple
- 1.29×
- Total profit
- $11,531
- Equity at exit
- $12,096
Cash invested: $39,172 (down + closing). Projections, not guarantees.
Landlord ↔ Tenant lean methodology
- Overall (STATE)
- 62 Landlord-Friendly
- State Michigan
- 62 Landlord-Friendly · EVEN
- County
- — inherits STATE
- City
- — inherits STATE
ZIP-level market 48239
- Rents YoY
- 3.2%
- Active inventory
- 188
- Price-to-rent
- 7.5×
Monthly cashflow live
- Estimated rent
- $1,554 high interval (Pro) →
- Mortgage (P&I)
- −$734
- Tax from tax record
- −$224 /mo · $2,692/yr
- Insurance
- −$58
- HOA
- −$0
- Vacancy / Maint / Mgmt
- −$326
- Net cashflow
- $211
Break-even live
UW: 25.0% down · 7.5% · 30yr · 1.5% tax · 5.0% vac · 8.0% maint · 8.0% mgmt
Financing live
Cash to close
- Down payment
- $34,975
- Closing costs
- $4,197
- Reserves months
- —
- Total cash needed
- —
Loan-product check · same deal, 3 products live
Conventional
25% down · 7.5% · 30yr
- Down + closing
- —
- Monthly P&I
- —
- Monthly cashflow
- —
- DSCR
- —
- Eligible?
- —
Personal DTI + credit; lowest rate.
DSCR
20% down · 8.5% · 30yr
- Down + closing
- —
- Monthly P&I
- —
- Monthly cashflow
- —
- DSCR
- —
- Eligible?
- —
No personal income docs; deal must DSCR.
Hard money
10% down · 12.0% · 12mo
- Down + closing
- —
- Monthly P&I
- —
- Monthly cashflow
- —
- DSCR
- —
- Eligible?
- —
Short-term bridge; refi at stabilization.
Rent comps 5 comps
| Address | Beds | Baths | Sqft | Rent | $/sqft | DOM | Units | Dist |
|---|---|---|---|---|---|---|---|---|
| 13231 Hemingway Redford, MI | 3.0 | 1.5 | 1074 | $1,700 | $1.58 | 16d | 1 | 0.34mi |
| 12097 Cavell St Livonia, MI | 3.0 | 1.0 | 985 | $1,200 | $1.22 | 1d | 1 | 0.92mi |
| 12107 Centralia Redford, MI | 3.0 | 1.0 | 912 | $1,800 | $1.97 | 43d | 1 | 1.07mi |
| 15195 Aubrey Redford, MI | 3.0 | 1.0 | 769 | $1,395 | $1.81 | 16d | 1 | 1.34mi |
| 28940 Lancaster St Livonia, MI | 1.0–2.0 | 1.0 | 800 | $1,365 | $1.71 | 24d | 5 | 1.43mi |
Listing history 25 events
-
2026-06-09days on market $139,900 Active 42 DOM
-
2026-06-08days on market $139,900 Active 41 DOM
-
2026-06-07days on market $139,900 Active 40 DOM
-
2026-06-04days on market $139,900 Active 37 DOM
-
2026-06-03days on market $139,900 Active 36 DOM
-
2026-06-02days on market $139,900 Active 35 DOM
-
2026-06-02$139,900 Active 34 DOM
-
2026-06-01days on market $139,900 Active 34 DOM
-
2026-05-31days on market $139,900 Active 33 DOM
-
2026-05-14price $139,900 660-char remark
-
2026-05-13price $139,900 660-char remark
-
2026-04-28$149,900 Active 660-char remark
-
2026-04-28$149,900 Active 660-char remark
-
2013-08-09soldstatus $35,000
Show marketing remark (240 chars)
Adorable, affordable bungalow. 1 bedroom down and finished upper level could possibly be 2 bedrooms. Large yard, 1 car extra long garage, central air. Newer roof and HWH. Updated bath. Appliances stay! Move in ready. South Redford schools.
-
2013-07-21historical
Show marketing remark (240 chars)
Adorable, affordable bungalow. 1 bedroom down and finished upper level could possibly be 2 bedrooms. Large yard, 1 car extra long garage, central air. Newer roof and HWH. Updated bath. Appliances stay! Move in ready. South Redford schools.
-
2013-07-21historical
Show marketing remark (240 chars)
Adorable, affordable bungalow. 1 bedroom down and finished upper level could possibly be 2 bedrooms. Large yard, 1 car extra long garage, central air. Newer roof and HWH. Updated bath. Appliances stay! Move in ready. South Redford schools.
-
2013-07-16$39,000
Show marketing remark (240 chars)
Adorable, affordable bungalow. 1 bedroom down and finished upper level could possibly be 2 bedrooms. Large yard, 1 car extra long garage, central air. Newer roof and HWH. Updated bath. Appliances stay! Move in ready. South Redford schools.
-
2013-07-16$39,000
Show marketing remark (240 chars)
Adorable, affordable bungalow. 1 bedroom down and finished upper level could possibly be 2 bedrooms. Large yard, 1 car extra long garage, central air. Newer roof and HWH. Updated bath. Appliances stay! Move in ready. South Redford schools.
-
2010-06-04soldstatus $28,000
-
2010-03-31$32,500
-
2010-03-01soldstatus $15,511
-
2010-01-29$14,000
-
2003-11-21soldstatus $107,000
-
1999-10-01soldstatus $66,500
ⓘ Source: listings_history table (triggers on properties + properties_extension) + one-shot
backfill from property_details.listing_events for pre-trigger history.
Tax reassessment forecast MI · Partial reset (capped growth)
- Current annual tax
- $2,692 · $224/mo
- Projected year-2 tax
- $2,692 · $224/mo
- Expected delta
- $0/yr ($0/mo · 0.0%)
ⓘ Screening estimate from a state-policy table — verify with the county assessor before closing.
Climate risk First Street
- Flood 3/10 Moderate FEMA zone X (shaded) · 20% chance over 30 yrs
- Wildfire 1/10 Low
- Heat 3/10 Moderate 7 d/yr ≥98°F today · 14 d/yr by 30 yrs out
- Wind 2/10 Low
- Air quality 3/10 Moderate 2 unhealthy d/yr today · 3 by 30 yrs out
Nearby sold comps map
Loading sold comps map…
Walkable amenities ~0.75 mi
Loading nearby amenities…
Taxation est. · year 1
- Rental income
- $18,647
- − Mortgage interest
- −$7,837
- − Property taxes
- −$2,692
- − Insurance
- −$700
- − Repairs & maintenance
- −$1,492
- − Management
- −$1,492
- − Depreciation
- −$4,070
- Taxable income
- $365
- Est. tax owed @ 24.0%
- −$88
- After-tax cash flow
- $2,448/yr
For passive investors: Depreciation is non-cash, so a rental often shows a tax loss while cash-flowing — sheltering income. Rental losses are passive: they offset passive income freely, and up to $25,000/yr can offset ordinary (W-2) income if you actively participate and your MAGI is under $100k (phasing out to $0 by $150k); unused losses carry forward. On sale, claimed depreciation is recaptured at up to 25%, and gains may owe capital-gains tax (a 1031 exchange can defer both). Figures are a year-1 estimate at your 24.0% rate — not tax advice; consult a CPA.
Schools (NCES district)
- District
- South Redford School District
- NCES district ID
- 2632280
- Math proficiency
- 11% ▼ -9.00%
- Reading proficiency
- 29% ▼ -7.00%
- Median HH income
- $52,775
- Composite
- 18.1/100
- National rank
- #8972
- State rank
- #455 of 540 in MI
Livability — Redford
No livability data for this city. (Only ~50 U.S. cities are tracked.)
Census & demographics
- County
- Wayne County · 1,562,939 people
- City population
- 36,976
- Metro
- Detroit-Warren-Dearborn, MI
- Population (ZIP)
- 36,976
- Household income
- $71,151
- Rent vs Own
- Severe rent burden
- 1052.0
Population outlook (Wayne County) Hauer SSP2
- Today (2025)
- 1,675,273 people
- By 2030
- 1,620,300 · -3.3%
- By 2040
- 1,502,341 · -10.3%
- By 2050
- 1,384,039 · -17.4%
- By 2075
- 1,124,592 · -32.9%
- By 2100
- 881,193 · -47.4%
Race, ethnicity, and origin ACS 2023
- Neighborhood character
- Majority Black (58%)
- Race & ethnicity
- Black 58% White 34% Hispanic / Latino 4% Two or more races 4%
- Common ancestry
- Romanian 7% Slovak 2% Lithuanian 2%
- Foreign-born
- 2% · Canada
- Languages at home
- 96% English-only · Spanish 1% Other Indo-European 1% Arabic 1%
Political lean MEDSL · Wayne
- 2024 margin
- Strong D (+29.0) · D 62.7% · R 33.7% · Other 3.6%
- 2008→2024 swing
- -20.5pp toward R · 2008: 49.5pp · 2024: 29.0pp
- All cycles
- 2024: D+29.0 2020: D+38.1 2016: D+37.3 2012: D+46.9 2008: D+49.5
Not yet ingested
- Civics
- —
Market trends
- HPI YoY
- ▼ -202.97%
- Current HPI
- 236.1136
- Rent YoY
- ▲ 3.25%
- Metro
- Detroit-Warren-Dearborn, MI
- State GDP YoY
- ▲ 1.37%
- F500 in state
- 28
Industry mix (Fortune 500 HQ in MI)
| Industry | F500 HQs | Revenue |
|---|---|---|
| Automotive Parts | 3 | $48B |
|
||
| Automotive | 2 | $372B |
|
||
| Chemicals | 1 | $45B |
|
||
| Automotive Retail | 1 | $29B |
|
||
| Healthcare / Medical Devices | 1 | $23B |
|
||
| Automotive Technology | 1 | $20B |
|
||
Price history
+110.4% since first listed20 events — show timeline
- 2026-06-11 Listing Removed — REALCOMP
- 2026-06-11 Listing Removed — MiRealSource-MiMLS
- 2026-06-02 Relisted — REALCOMP
- 2026-06-01 Listing Removed — REALCOMP
- 2026-05-14 Price Changed $139,900 MiRealSource-MiMLS
- 2026-05-13 Price Changed $139,900 REALCOMP
- 2026-04-28 Listed $149,900 REALCOMP
- 2026-04-28 Listed $149,900 MiRealSource-MiMLS
- 2013-08-09 Sold (MLS) $35,000 MiRealSource-MiMLS
- 2013-08-09 Sold (MLS) $35,000 REALCOMP
- 2013-07-21 Listing Removed — MiRealSource-MiMLS
- 2013-07-21 Listing Removed — REALCOMP
- 2013-07-16 Listed $39,000 MiRealSource-MiMLS
- 2013-07-16 Listed $39,000 REALCOMP
- 2010-06-04 Sold (MLS) $28,000 REALCOMP
- 2010-03-31 Listed $32,500 REALCOMP
- 2010-03-01 Sold (MLS) $15,511 REALCOMP
- 2010-01-29 Listed $14,000 REALCOMP
- 2003-11-21 Sold (Public Records) $107,000 Public Records
- 1999-10-01 Sold (Public Records) $66,500 Public Records
Property tax history
+6.9%/yrLatest (2025): $2,692 · +8.3% YoY. Source: county tax records.
Cash-flow waterfall
monthlySold comps — $/sqft
last 12 mo · ≤1 miLoading sold comps…