205-207 W Perkins St · Payson, IL
Flood risk 1/10 · Minimal
- FEMA flood zone
- X (unshaded)
- Chance of flooding over 30 yrs
- 0.0%
- Est. flood insurance / yr
- $473 – $860
Fire risk 1/10 · Minimal
- Est. fire insurance / yr
- $804 – $1,492
Heat risk 3/10 · Minor
- Hot days now (above 106°F)
- 7 days/yr
- Hot days in 30 yrs
- 18 days/yr
Wind risk 2/10 · Minimal
- Chance of severe wind over 30 yrs
- 0.0%
Air-quality risk 1/10 · Minimal
- Unhealthy air days now
- 0 days/yr
- Unhealthy air days in 30 yrs
- 0 days/yr
Risk factors via First Street. Map © Google.
Why this score? — see what drove the D+ grade
The composite is a weighted blend of 9 inputs, each scored 0–100. Each bar is that input's sub-score; the figure is the points it added to the 100-point composite (weight × sub-score).
- Cash flow +20.3/30.0
- ARV discount +7.5/15.0
- DSCR +6.4/10.0
- 1% rule +5.4/10.0
- Livability +3.4/5.0
- Rent growth +2.5/5.0
- Condition / age +2.2/5.0
- Schools +1.6/10.0
- Appreciation +0.0/10.0
$108,750
🖨 Deal sheet 📄 Offer letter ✓ Due diligence
Listing remarks MLS
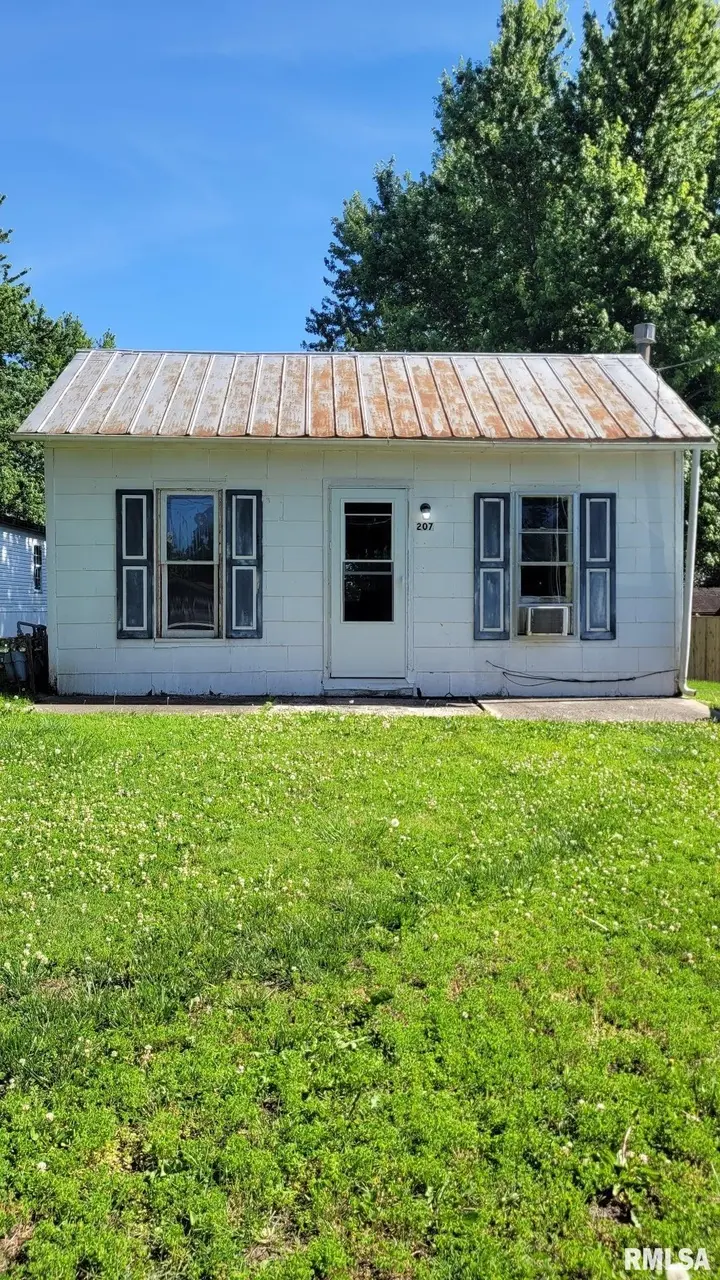
This manufactured home is in excellent condition. Has an open floor plan with 2x6 walls and has a large lot. Master bath has double vanities and garden tub. Covered porch and 8x8 newer deck. 1 bdr house on same proeprty could be rented with a little TLC.
Key facts
- Nicely renovated
- New roof
- 0.46 acre lot
Tags
Property features AI
Exterior
- Parking: No garage spaces
- Utilities: Public water; Public sewer
- Home design: Single-family residence; Living area reported as 1188 (unit unspecified)
- Construction: Year built not specified
- Exterior features: Shingle roof; Lot approximately 0.46 acre with dimensions roughly 100 x 200; Lot features: Other
Interior
- Kitchen: Kitchen on main level
- Bedrooms: Three bedrooms (all on the main level); Bedrooms feature carpet flooring and egress windows; Bedroom dimensions approximately 13' x 10' (two bedrooms) and 13' x 12'
- Flooring: Carpet in bedrooms; Vinyl in kitchen, living room, and laundry
- Bathrooms: Two full bathrooms
- Heating & cooling: Forced air heating; Central air conditioning
- Interior features: Refrigerator included; No basement; No fireplaces
- Laundry & utility: Main level laundry room (approx. 8' x 6')
Neighborhood map
What this means for you Summary
Snapshot
- This is a 3-bed/2.0-bath manufactured listed at $109k. Condition is rated fair.
Deal economics
- At list price, monthly cash flow is $139 ($2k/yr) — positive.
- The deal already cash-flows at list — no discount required.
- Meets the 1% rule at list price ($1k rent vs $109k).
Location & tenants
- Location reads 67/100 on livability (#536 in IL) — a middle-class / working-renter tenant base. Strengths: crime A+, cost of living A+, housing A+; Watch: schools F, amenities F, commute F.
- Payson CUSD 1 (rural): math 16% / reading 18% proficiency, ranked #463 of 620 in IL (top 75%) — low school quality limits family demand, transient renter base, plan for 1-2y turnover.
- Market conditions: 9 active listings in the ZIP; 68 units permitted in Adams County in 2024 (0 in 5+ unit buildings).
Forward outlook
- Local home prices are declining (-3.0%/yr); year-one equity from $752 of loan paydown is wiped out by about $3k of value loss. Plan a longer hold.
- Adams County population projected at -14% by 2050 — secular population decline; favor cash flow + early exit over multi-decade hold.
Negotiation context
- Only 14 days on market — expect competitive offers; lowballing is unlikely to land.
- 2 sale attempts since 14y ago with the ask held roughly flat each time — persistent listings suggest the price (not the market) is what's stuck; bring a comps-based counter.
- Current owner paid $52k; list at $109k implies a 109% gain — meaningful room to come down on a strong offer.
Questions for the listing agent
- Have any recent inspections been done? Can we get a copy of the seller's disclosures and any deferred-maintenance estimates?
- Is there a deadline driving the sale (1031 exchange, divorce, estate, relocation)? That informs how much negotiation room exists.
- Schools are F-rated, which usually means shorter tenancies and higher turnover. Who's the typical renter profile here, and what's been the actual vacancy rate?
- The area grade is low — what's the realistic commute time and amenity access for the typical tenant pool here? Any planned neighborhood developments (good or bad) we should know about?
- What's the average days-on-market for RENTAL listings here right now (not sales)? A rising rental-DOM trend means longer vacancies and softer asking-rent achievability than the comps imply.
- What's the recent tenant-quality profile in this submarket — average credit score on applications, eviction rate, late-payment / NSF rate, and stable-employment percentage? A property-management company in the area should have these aggregated.
- How much new for-sale + rental construction is in the pipeline within 1–3 miles? Heavy new supply typically softens prices + rents 12–24 months out; constrained supply supports both.
Investment metrics
- 1% rule
- 1.04% ✓
- Cap rate
- 7.83%
- Cash-on-cash
- 5.49%
- DSCR
- 1.24
- GRM
- 8.0
CMA / ARV
No comps found within radius.
Projected returns pro-forma
-3.0% appreciation · 3.0% rent growth · sell at horizon
- IRR
- -7.8%
- Equity multiple
- 0.71×
- Total profit
- $-8,726
- Equity at exit
- $16,215
- IRR
- 1.8%
- Equity multiple
- 1.13×
- Total profit
- $3,905
- Equity at exit
- $9,403
Cash invested: $30,450 (down + closing). Projections, not guarantees.
Landlord ↔ Tenant lean methodology
- Overall (STATE)
- 43 Moderately Tenant-Leaning
- State Illinois
- 43 Moderately Tenant-Leaning · D+7
- County
- — inherits STATE
- City
- — inherits STATE
ZIP-level market 62360
- Home prices YoY
- -8.4%
- Active inventory
- 9
- Price-to-rent
- 8.0×
Monthly cashflow live
- Estimated rent
- $1,128 medium interval (Pro) →
- Mortgage (P&I)
- −$570
- Tax est. 1.5%
- −$136 /mo · $1,631/yr
- Insurance
- −$45
- HOA
- −$0
- Vacancy / Maint / Mgmt
- −$237
- Net cashflow
- $139
Break-even live
UW: 25.0% down · 7.5% · 30yr · 1.5% tax · 5.0% vac · 8.0% maint · 8.0% mgmt
Financing live
Cash to close
- Down payment
- $27,188
- Closing costs
- $3,262
- Reserves months
- —
- Total cash needed
- —
Loan-product check · same deal, 3 products live
Conventional
25% down · 7.5% · 30yr
- Down + closing
- —
- Monthly P&I
- —
- Monthly cashflow
- —
- DSCR
- —
- Eligible?
- —
Personal DTI + credit; lowest rate.
DSCR
20% down · 8.5% · 30yr
- Down + closing
- —
- Monthly P&I
- —
- Monthly cashflow
- —
- DSCR
- —
- Eligible?
- —
No personal income docs; deal must DSCR.
Hard money
10% down · 12.0% · 12mo
- Down + closing
- —
- Monthly P&I
- —
- Monthly cashflow
- —
- DSCR
- —
- Eligible?
- —
Short-term bridge; refi at stabilization.
Listing history 11 events
-
2026-06-18days on market $108,750 Active 14 DOM
-
2026-06-17days on market $108,750 Active 13 DOM
-
2026-06-16days on market $108,750 Active 12 DOM
-
2026-06-15days on market $108,750 Active 11 DOM
-
2026-06-13days on market $108,750 Active 9 DOM
-
2026-06-12days on market $108,750 Active 8 DOM
-
2026-06-09days on market $108,750 Active 5 DOM
-
2026-06-08days on market $108,750 Active 4 DOM
-
2026-06-07days on market $108,750 Active 3 DOM
-
2026-06-05remarks 505-char remark
-
2026-06-05$108,750 Active 1 DOM
ⓘ Source: listings_history table (triggers on properties + properties_extension) + one-shot
backfill from property_details.listing_events for pre-trigger history.
Climate risk First Street
- Flood 1/10 Low FEMA zone X (unshaded) · 0% chance over 30 yrs
- Wildfire 1/10 Low
- Heat 3/10 Moderate 7 d/yr ≥106°F today · 18 d/yr by 30 yrs out
- Wind 2/10 Low 0% chance of damaging wind over 30 yrs
- Air quality 1/10 Low 0 unhealthy d/yr today · 0 by 30 yrs out
Nearby sold comps map
Loading sold comps map…
Walkable amenities ~0.75 mi
Loading nearby amenities…
Taxation est. · year 1
- Rental income
- $13,534
- − Mortgage interest
- −$6,092
- − Property taxes
- −$1,631
- − Insurance
- −$544
- − Repairs & maintenance
- −$1,083
- − Management
- −$1,083
- − Depreciation
- −$3,164
- Taxable loss
- −$62
- Est. tax savings @ 24.0%
- +$15
- After-tax cash flow
- $1,688/yr
For passive investors: Depreciation is non-cash, so a rental often shows a tax loss while cash-flowing — sheltering income. Rental losses are passive: they offset passive income freely, and up to $25,000/yr can offset ordinary (W-2) income if you actively participate and your MAGI is under $100k (phasing out to $0 by $150k); unused losses carry forward. On sale, claimed depreciation is recaptured at up to 25%, and gains may owe capital-gains tax (a 1031 exchange can defer both). Figures are a year-1 estimate at your 24.0% rate — not tax advice; consult a CPA.
Condition & rehab AI · 12 photos
The home requires moderate repairs and maintenance, with potential for significant value increase through updates to flooring, painting, landscaping, and HVAC.
Repairs flagged
- Minor Kitchen cabinets — Worn but not damaged.
- Minor Bathroom fixtures — Functional but dated and may need replacement.
- Moderate Exterior siding — Weathered and may need repainting or replacement.
- Moderate Flooring — Worn and may need replacement or refinishing.
- Moderate Paint — Worn and may need repainting.
- Moderate Windows — May need replacement for better energy efficiency and appearance.
- Minor HVAC — No visible issues, but may need maintenance.
- Major Landscaping — Simple and needs improvement to increase curb appeal and value.
Value-add opportunities
- Both New flooring — New flooring would improve the appearance and increase both resale and rental value.
- Both Painting — Painting would improve the appearance and increase both resale and rental value.
- Both Landscaping — Landscaping would improve the curb appeal and increase both resale and rental value.
- Both HVAC upgrade — Upgrading HVAC would improve comfort and energy efficiency, increasing both resale and rental value.
Renovation cost estimate screening
| Repair item | Severity | Est. cost |
|---|---|---|
| Kitchen cabinets · Worn but not damaged. | Minor | $500–3,000 |
| Bathroom fixtures · Functional but dated and may need replacement. | Minor | $500–3,000 |
| Exterior siding · Weathered and may need repainting or replacement. | Moderate | $3,000–15,000 |
| Flooring · Worn and may need replacement or refinishing. | Moderate | $3,000–15,000 |
| Paint · Worn and may need repainting. | Moderate | $3,000–15,000 |
| Windows · May need replacement for better energy efficiency and appearance. | Moderate | $3,000–15,000 |
| HVAC · No visible issues, but may need maintenance. | Minor | $500–3,000 |
| Landscaping · Simple and needs improvement to increase curb appeal and value. | Major | $15,000–50,000 |
| Total estimated repair cost · 8 items | $28,500–119,000 |
Value-add ROI direction
- Both New flooring — New flooring would improve the appearance and increase both resale and rental value. ↑
- Both Painting — Painting would improve the appearance and increase both resale and rental value. ↑
- Both Landscaping — Landscaping would improve the curb appeal and increase both resale and rental value. ↑
- Both HVAC upgrade — Upgrading HVAC would improve comfort and energy efficiency, increasing both resale and rental value. ↑
ⓘ Cost ranges are severity-bucket heuristics (US national rule-of-thumb). Get contractor quotes + a written scope before underwriting a rehab budget.
Schools (NCES district)
- District
- Payson CUSD 1
- NCES district ID
- 1730990
- Math proficiency
- 16% ▼ -3.00%
- Reading proficiency
- 18% ▼ -10.00%
- Median HH income
- $52,664
- Composite
- 15.68/100
- National rank
- #9284
- State rank
- #463 of 620 in IL
Livability — Payson
- Score
- 67/100
- State rank
- #536
- US rank
- #11127
Category grades
Schools grade is shown separately in the Schools card above.
Census & demographics
- Census place
- Payson, IL
- Population (ZIP)
- 1,540
Population outlook (Adams County) Hauer SSP2
- Today (2025)
- 65,795 people
- By 2030
- 64,436 · -2.1%
- By 2040
- 61,007 · -7.3%
- By 2050
- 56,851 · -13.6%
- By 2075
- 46,424 · -29.4%
- By 2100
- 34,305 · -47.9%
Race, ethnicity, and origin ACS 2023
- Neighborhood character
- Predominantly White (96%)
- Race & ethnicity
- White 96% Asian 2% Two or more races 2% Hispanic / Latino 1%
- Common ancestry
- Italian 3% Slovak 1% Serbian 1%
- Foreign-born
- 0%
Political lean MEDSL · Adams
- 2024 margin
- Solid R (+47.4) · D 25.6% · R 73.0% · Other 1.5%
- 2008→2024 swing
- -25.0pp toward R · 2008: -22.4pp · 2024: -47.4pp
- All cycles
- 2024: R+47.4 2020: R+46.5 2016: R+47.5 2012: R+35.2 2008: R+22.4
Not yet ingested
- Civics
- —
Market trends
- HPI YoY
- ▼ -12.55%
- Current HPI
- 135.975
- Rent YoY
- —
- Metro
- —
- State GDP YoY
- ▲ 1.59%
- F500 in state
- 60
Industry mix (Fortune 500 HQ in IL)
| Industry | F500 HQs | Revenue |
|---|---|---|
| Insurance | 4 | $201B |
|
||
| Consumer Goods | 4 | $87B |
|
||
| Industrial Machinery | 3 | $64B |
|
||
| Healthcare | 2 | $55B |
|
||
| Retail / Pharmacy | 1 | $148B |
|
||
| Agriculture / Food | 1 | $86B |
|
||
Price history
+81.6% since first listed3 events — show timeline
- 2026-06-04 Listed $108,750 RMLSA as Distributed by MLS Grid
- 2012-10-26 Sold (MLS) $52,000 MRED as Distributed by MLS Grid
- 2012-07-18 Listed $59,900 MRED as Distributed by MLS Grid
Cash-flow waterfall
monthlySold comps — $/sqft
last 12 mo · ≤1 miLoading sold comps…