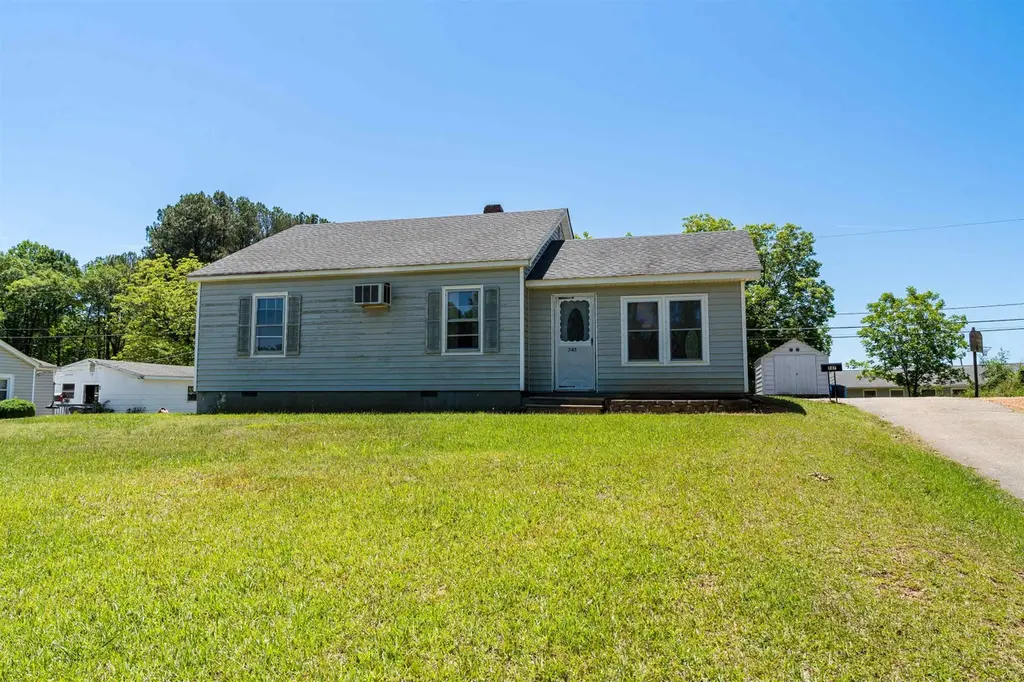
747 N Main St · Inman, SC
Flood risk 1/10 · Minimal
- FEMA flood zone
- X (unshaded)
- Chance of flooding over 30 yrs
- 0.0%
- Est. flood insurance / yr
- $507 – $1,088
Fire risk 4/10 · Minor
- Est. fire insurance / yr
- $783 – $1,453
Heat risk 6/10 · Moderate
- Hot days now (above 105°F)
- 7 days/yr
- Hot days in 30 yrs
- 17 days/yr
Wind risk 2/10 · Minimal
- Chance of severe wind over 30 yrs
- 1.0%
Air-quality risk 3/10 · Minor
- Unhealthy air days now
- 3 days/yr
- Unhealthy air days in 30 yrs
- 3 days/yr
Risk factors via First Street. Map © Google.
Why this score? — see what drove the B- grade
The composite is a weighted blend of 9 inputs, each scored 0–100. Each bar is that input's sub-score; the figure is the points it added to the 100-point composite (weight × sub-score).
- Cash flow +25.9/30.0
- ARV discount +15.0/15.0
- DSCR +8.7/10.0
- 1% rule +5.6/10.0
- Schools +4.1/10.0
- Livability +3.7/5.0
- Rent growth +2.9/5.0
- Condition / age +2.5/5.0
- Appreciation +0.0/10.0
$169,000
🖨 Deal sheet 📄 Offer letter ✓ Due diligence
Listing remarks MLS
Step back in time and discover the charm of this vintage three-bedroom, two bath home offering 1432sqft of comfortable living space. Full of character and timeless appeal, this home features a bright and inviting sunroom to enjoy that morning coffee. Situated on a large lot the property provides plenty of room for gardening or those back yard games. Three storage buildings to offer abundant space for tools, hobbies and storage. Conveniently located just minutes from downtown Inman. This home is ready for you to add your personal touch. The home is being SOLD AS IS!
Key facts
- Large lot
- Sunroom
- Storage buildings
Tags
Property features AI
Finance
- HOA & community: No HOA fees
Exterior
- Parking: Driveway parking; Paved asphalt driveway
- Utilities: Public water (and other/see remarks); Septic sewer; Electric water heater; Private garbage pickup
- Home design: Single-story residence; Built circa 1955; Crawl space foundation
- Construction: Vinyl siding exterior; Architectural shingle roof; Crawl space foundation; Approximately built in 1955
- Exterior features: Architectural roof; Vinyl siding; Level to gently sloped lot with some trees; Outbuilding for storage
Interior
- Kitchen: Kitchen approx. 13 x 13; Dishwasher; Electric cooktop; Electric oven
- Bedrooms: Three bedrooms on the main level; Primary bedroom on the main level with full bath (approx. 16 x 11); Second bedroom approx. 11 x 11; Third bedroom approx. 12 x 12
- Flooring: Hardwood floors
- Bathrooms: Two full bathrooms (both on the main level)
- Heating & cooling: Forced air heating; Wall furnace; Central forced cooling; Wall/window cooling units
- Interior features: Solid surface countertops; Walk-in closet; Sun room; No fireplace
- Laundry & utility: Laundry on the first floor with electric dryer hookup
Neighborhood map
What this means for you Summary
Snapshot
- This is a 3-bed/1.0-bath single-family listed at $169k.
Deal economics
- At list price, monthly cash flow is $415 ($5k/yr) — positive.
- The deal already cash-flows at list — no discount required.
- Meets the 1% rule at list price ($2k rent vs $169k).
- Cap rate 9.2% vs local median 4.3% in Inman — top-decile yield for the area; either an underpriced asset or a hidden risk that comps aren't pricing in. Stress-test before assuming the spread holds.
Location & tenants
- Location reads 74/100 on livability (#29 in SC, #4,452 nationally) — a middle-class / working-renter tenant base. Strengths: cost of living A+, housing A+, health & safety A+; Watch: amenities D, commute F.
- Spartanburg 01 (rural): math 44% / reading 53% proficiency, ranked #14 of 80 in SC (top 18%) — families likely to look elsewhere, expect single-tenant / working-renter base with shorter leases.
- Zoned schools: Inman Elementary (math 57% / reading 47%, grade C-, #145 of 597 statewide, top 26%, 615 students, 100% FRL) — zoned schools average 100% FRL vs 45% district-wide (55 pts higher); higher-poverty schools than district average — tighter screening recommended.
- Market conditions: Rents rising (+1.8%/yr); 693 active listings in the ZIP; 1 comparable units currently listed for rent nearby; solid renter incomes; 3,129 units permitted in Spartanburg County in 2024 (40 in 5+ unit buildings).
Forward outlook
- Local home prices are declining (-3.0%/yr); year-one equity from $1k of loan paydown is wiped out by about $5k of value loss. Plan a longer hold.
- Spartanburg County population projected at +18% by 2050 — long-run rental-demand tailwind backs the buy-and-hold thesis.
Negotiation context
- Only 7 days on market — expect competitive offers; lowballing is unlikely to land.
- 2 sale attempts with the ask held roughly flat each time — persistent listings suggest the price (not the market) is what's stuck; bring a comps-based counter.
Risks & watch-outs
- Watch-outs: built in 1955 — expect roof / HVAC / electrical / plumbing capex.
- Climate carrying-cost: extreme-heat days projected 7→17/yr by 2055 (HVAC capex compounding) — expect insurance premiums to compound above CPI over the hold.
Questions for the listing agent
- Built in 1955 — when were the roof, HVAC, electrical panel, plumbing, and water heater last replaced?
- Is there a deadline driving the sale (1031 exchange, divorce, estate, relocation)? That informs how much negotiation room exists.
- What's the average days-on-market for RENTAL listings here right now (not sales)? A rising rental-DOM trend means longer vacancies and softer asking-rent achievability than the comps imply.
- What's the recent tenant-quality profile in this submarket — average credit score on applications, eviction rate, late-payment / NSF rate, and stable-employment percentage? A property-management company in the area should have these aggregated.
- How much new for-sale + rental construction is in the pipeline within 1–3 miles? Heavy new supply typically softens prices + rents 12–24 months out; constrained supply supports both.
Investment metrics
- 1% rule
- 1.06% ✓
- Cap rate
- 9.24%
- Cash-on-cash
- 10.53%
- DSCR
- 1.47
- GRM
- 7.9
CMA / ARV
- ARV (on-the-fly)
- $270,648
- Comps found
- 10
Show comp detail 10 sales within ~0.75 mi
| Address | Dist | Beds/Ba | Sqft | Sold | Price | $/sf | Match |
|---|---|---|---|---|---|---|---|
| 747 N Main St | 0.00mi | 3/2.0 | 1,432 (0%) | 0mo | $162,500 | $113 | 96 |
| 329 Bellrock Rd | 0.39mi | 3/2.0 | 1,456 (+2%) | 0mo | $275,080 | $189 | 75 |
| 651 N Main St | 0.10mi | 3/2.0 | 1,503 (+5%) | 11mo | $245,000 | $163 | 74 |
| 317 Bellrock Rd | 0.40mi | 3/2.0 | 1,456 (+2%) | 1mo | $263,990 | $181 | 74 |
| 12 Nichols Dr | 0.48mi | 3/2.0 | 1,458 (+2%) | 12mo | $275,000 | $189 | 61 |
| 901 Lyday Ln | 0.34mi | 3/2.0 | 1,550 (+8%) | 20mo | $310,000 | $200 | 50 |
| 151 Inn View Dr | 0.59mi | 3/2.0 | 1,322 (-8%) | 12mo | $270,000 | $204 | 46 |
| 111 Beechwood Dr | 0.48mi | 3/2.0 | 1,544 (+8%) | 22mo | $295,000 | $191 | 42 |
| 29 Canaday St | 0.64mi | 2/1.0 (-1) | 1,250 (-13%) | 13mo | $235,000 | $188 | 33 |
| 4 1st St St | 0.75mi | 3/2.0 | 1,250 (-13%) | 16mo | $199,900 | $160 | 27 |
Match score weights: distance 35% · size 25% · config 20% · recency 20%. Top-matched comps best support the ARV.
Projected returns pro-forma
-3.0% appreciation · 1.79% rent growth · sell at horizon
- IRR
- -1.8%
- Equity multiple
- 0.93×
- Total profit
- $-3,160
- Equity at exit
- $25,198
- IRR
- 6.7%
- Equity multiple
- 1.47×
- Total profit
- $22,392
- Equity at exit
- $14,612
Cash invested: $47,320 (down + closing). Projections, not guarantees.
Landlord ↔ Tenant lean methodology
- Overall (STATE)
- 90 Strongly Landlord-Friendly
- State South Carolina
- 90 Strongly Landlord-Friendly · R+6
- County
- — inherits STATE
- City
- — inherits STATE
ZIP-level market 29349
- Home prices YoY
- -31.8%
- Rents YoY
- 1.8%
- Active inventory
- 693
- Price-to-rent
- 7.9×
Monthly cashflow live
- Estimated rent
- $1,783 medium interval (Pro) →
- Mortgage (P&I)
- −$886
- Tax from tax record
- −$37 /mo · $439/yr
- Insurance
- −$70
- HOA
- −$0
- Vacancy / Maint / Mgmt
- −$374
- Net cashflow
- $415
Break-even live
UW: 25.0% down · 7.5% · 30yr · 1.5% tax · 5.0% vac · 8.0% maint · 8.0% mgmt
Financing live
Cash to close
- Down payment
- $42,250
- Closing costs
- $5,070
- Reserves months
- —
- Total cash needed
- —
Loan-product check · same deal, 3 products live
Conventional
25% down · 7.5% · 30yr
- Down + closing
- —
- Monthly P&I
- —
- Monthly cashflow
- —
- DSCR
- —
- Eligible?
- —
Personal DTI + credit; lowest rate.
DSCR
20% down · 8.5% · 30yr
- Down + closing
- —
- Monthly P&I
- —
- Monthly cashflow
- —
- DSCR
- —
- Eligible?
- —
No personal income docs; deal must DSCR.
Hard money
10% down · 12.0% · 12mo
- Down + closing
- —
- Monthly P&I
- —
- Monthly cashflow
- —
- DSCR
- —
- Eligible?
- —
Short-term bridge; refi at stabilization.
Rent comps 1 comps
| Address | Beds | Baths | Sqft | Rent | $/sqft | DOM | Units | Dist |
|---|---|---|---|---|---|---|---|---|
| 240 4th St Inman, SC | 1.0–3.0 | 1.0–2.0 | 1356 | $1,830 | $1.35 | 3d | 12 | 0.90mi |
Listing history 4 events
-
2026-05-22status Pending 571-char remark
Show marketing remark (571 chars)
Step back in time and discover the charm of this vintage three-bedroom, two bath home offering 1432sqft of comfortable living space. Full of character and timeless appeal, this home features a bright and inviting sunroom to enjoy that morning coffee. Situated on a large lot the property provides plenty of room for gardening or those back yard games. Three storage buildings to offer abundant space for tools, hobbies and storage. Conveniently located just minutes from downtown Inman. This home is ready for you to add your personal touch. The home is being SOLD AS IS!
-
2026-05-22status Pending
Show marketing remark (571 chars)
Step back in time and discover the charm of this vintage three-bedroom, two bath home offering 1432sqft of comfortable living space. Full of character and timeless appeal, this home features a bright and inviting sunroom to enjoy that morning coffee. Situated on a large lot the property provides plenty of room for gardening or those back yard games. Three storage buildings to offer abundant space for tools, hobbies and storage. Conveniently located just minutes from downtown Inman. This home is ready for you to add your personal touch. The home is being SOLD AS IS!
-
2026-05-16$169,000 Active 571-char remark
Show marketing remark (571 chars)
Step back in time and discover the charm of this vintage three-bedroom, two bath home offering 1432sqft of comfortable living space. Full of character and timeless appeal, this home features a bright and inviting sunroom to enjoy that morning coffee. Situated on a large lot the property provides plenty of room for gardening or those back yard games. Three storage buildings to offer abundant space for tools, hobbies and storage. Conveniently located just minutes from downtown Inman. This home is ready for you to add your personal touch. The home is being SOLD AS IS!
-
2026-05-15$169,000 Active
ⓘ Source: listings_history table (triggers on properties + properties_extension) + one-shot
backfill from property_details.listing_events for pre-trigger history.
Tax reassessment forecast SC · Resets to sale price
- Current annual tax
- $439 · $37/mo
- Projected year-2 tax
- $963 · $80/mo
- Expected delta
- +$524/yr (+$44/mo · 119.5%)
ⓘ Screening estimate from a state-policy table — verify with the county assessor before closing.
Climate risk First Street
- Flood 1/10 Low FEMA zone X (unshaded) · 0% chance over 30 yrs
- Wildfire 4/10 Moderate
- Heat 6/10 Major 7 d/yr ≥105°F today · 17 d/yr by 30 yrs out
- Wind 2/10 Low 100% chance of damaging wind over 30 yrs
- Air quality 3/10 Moderate 3 unhealthy d/yr today · 3 by 30 yrs out
Nearby sold comps map
Loading sold comps map…
Walkable amenities ~0.75 mi
Loading nearby amenities…
Taxation est. · year 1
- Rental income
- $21,396
- − Mortgage interest
- −$9,467
- − Property taxes
- −$439
- − Insurance
- −$845
- − Repairs & maintenance
- −$1,712
- − Management
- −$1,712
- − Depreciation
- −$4,916
- Taxable income
- $2,306
- Est. tax owed @ 24.0%
- −$553
- After-tax cash flow
- $4,430/yr
For passive investors: Depreciation is non-cash, so a rental often shows a tax loss while cash-flowing — sheltering income. Rental losses are passive: they offset passive income freely, and up to $25,000/yr can offset ordinary (W-2) income if you actively participate and your MAGI is under $100k (phasing out to $0 by $150k); unused losses carry forward. On sale, claimed depreciation is recaptured at up to 25%, and gains may owe capital-gains tax (a 1031 exchange can defer both). Figures are a year-1 estimate at your 24.0% rate — not tax advice; consult a CPA.
Schools (NCES district)
- District
- Spartanburg 01
- NCES district ID
- 4503480
- Math proficiency
- 44% ▼ -11.00%
- Reading proficiency
- 53% ▼ -1.00%
- Median HH income
- $44,612
- Composite
- 41.0/100
- National rank
- #3590
- State rank
- #14 of 80 in SC
Livability — Inman
- Score
- 74/100
- State rank
- #29
- US rank
- #4452
Category grades
Schools grade is shown separately in the Schools card above.
Census & demographics
- County
- Spartanburg County · 258,607 people
- City population
- 39,083
- Metro
- Spartanburg, SC
- Population (ZIP)
- 39,083
- Household income
- $76,168
- Rent vs Own
- Severe rent burden
- 271.0
Population outlook (Spartanburg County) Hauer SSP2
- Today (2025)
- 325,495 people
- By 2030
- 338,800 · +4.1%
- By 2040
- 363,471 · +11.7%
- By 2050
- 384,156 · +18.0%
- By 2075
- 430,137 · +32.1%
- By 2100
- 442,733 · +36.0%
Race, ethnicity, and origin ACS 2023
- Neighborhood character
- Predominantly White (80%)
- Race & ethnicity
- White 80% Black 9% Hispanic / Latino 6% Two or more races 4% Asian 2%
- Hispanic origin (detail)
- Mexican 5%
- Common ancestry
- Subsaharan African 6% Serbian 3% Scotch-Irish 3%
- Foreign-born
- 9% · Canada
- Languages at home
- 86% English-only · Russian/Polish/Slavic 7% Spanish 3% Other Asian/Pacific 2%
Political lean MEDSL · Spartanburg
- 2024 margin
- Solid R (+33.6) · D 32.6% · R 66.2% · Other 1.2%
- 2008→2024 swing
- -12.0pp toward R · 2008: -21.6pp · 2024: -33.6pp
- All cycles
- 2024: R+33.6 2020: R+27.3 2016: R+30.0 2012: R+23.1 2008: R+21.6
Not yet ingested
- Civics
- —
Market trends
- HPI YoY
- ▼ -113.67%
- Current HPI
- 244.0359
- Rent YoY
- ▲ 1.79%
- Metro
- Spartanburg, SC
- State GDP YoY
- ▲ 4.51%
- F500 in state
- 2
Industry mix (Fortune 500 HQ in SC)
| Industry | F500 HQs | Revenue |
|---|---|---|
| Packaging | 1 | $7B |
|
||
Price history
+0.0% since first listed4 events — show timeline
- 2026-05-22 Pending — SPMLS
- 2026-05-22 Pending — Greater Greenville MLS
- 2026-05-16 Listed $169,000 SPMLS
- 2026-05-15 Listed $169,000 Greater Greenville MLS
Property tax history
+4.9%/yrLatest (2025): $439 · +2.3% YoY. Source: county tax records.
Cash-flow waterfall
monthlySold comps — $/sqft
last 12 mo · ≤1 miLoading sold comps…