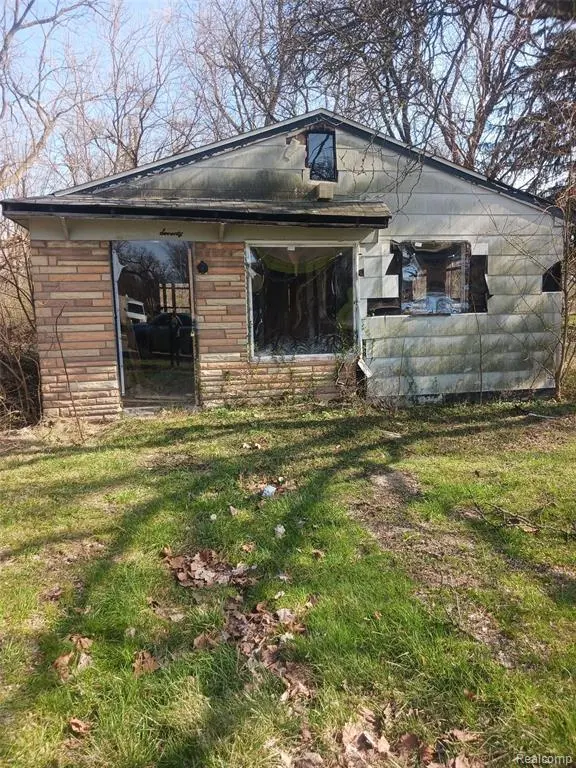
14170 Darcy St · Detroit, MI
Flood risk 1/10 · Minimal
- FEMA flood zone
- X (unshaded)
- Chance of flooding over 30 yrs
- 0.0%
- Est. flood insurance / yr
- $507 – $1,088
Fire risk 1/10 · Minimal
- Est. fire insurance / yr
- $784 – $1,456
Heat risk 2/10 · Minimal
- Hot days now (above 99°F)
- 7 days/yr
- Hot days in 30 yrs
- 14 days/yr
Wind risk 2/10 · Minimal
- Chance of severe wind over 30 yrs
- —
Air-quality risk 3/10 · Minor
- Unhealthy air days now
- 2 days/yr
- Unhealthy air days in 30 yrs
- 3 days/yr
Risk factors via First Street. Map © Google.
Why this score? — see what drove the D grade
The composite is a weighted blend of 9 inputs, each scored 0–100. Each bar is that input's sub-score; the figure is the points it added to the 100-point composite (weight × sub-score).
- Cash flow +15.0/30.0
- ARV discount +7.5/15.0
- 1% rule +5.0/10.0
- DSCR +5.0/10.0
- Livability +3.7/5.0
- Rent growth +2.5/5.0
- Condition / age +2.5/5.0
- Schools +1.3/10.0
- Appreciation +0.0/10.0
$15,000
🖨 Deal sheet 📄 Offer letter ✓ Due diligence
Listing remarks MLS
This 3-bedroom, 1-bath home an excellent value-add opportunity for investors. Approximately 918 sq ft with solid structure in place, the property requires full renovation and is being sold as-is. Potential for fix-and-flip, buy-and-hold, or rental investment. Estimated after-repair value based on nearby renovated comparables has significant upside. Located in the Brightmoor area of Detroit near major roads, neighborhood amenities, and ongoing redevelopment activity. Ideal opportunity for investors seeking an affordable entry point in an active investment market. Buyer to verify all information.
Key facts
- 3,920 sq ft lot
- Built 1969
- Listed 59 days
Neighborhood map
What this means for you Summary
Snapshot
- This is a 3-bed/1.0-bath single-family listed at $15k.
Deal economics
- At list price, monthly cash flow is $810 ($10k/yr) — positive.
- The deal already cash-flows at list — no discount required.
- Meets the 1% rule at list price ($1k rent vs $15k).
- Recommended offer: $15k (3.0% below list) — sets the bar for market timing.
- Cap rate 71.1% vs local median 10.2% in Detroit — top-decile yield for the area; either an underpriced asset or a hidden risk that comps aren't pricing in. Stress-test before assuming the spread holds.
Location & tenants
- Location reads 73/100 on livability (#218 in MI) — a middle-class / working-renter tenant base. Strengths: amenities A+, commute A+, cost of living A+; Watch: schools F, crime F, employment F.
- Detroit Public Schools Community District (urban): math 10% / reading 24% proficiency, ranked #499 of 540 in MI (top 92%) — low school quality limits family demand, transient renter base, plan for 1-2y turnover; 90% free/reduced lunch — lower-income household profile, screen leases tightly.
- Market conditions: 158 active listings in the ZIP; 40 comparable units currently listed for rent nearby; rentals lingering (median 44d on market — plan ~5-8 weeks vacancy on turnover, expect pricing pressure); 88% of comp listings sitting > 30 days — soft ceiling on asking rent; lower-income renter base — watch delinquency; 2,639 units permitted in Wayne County in 2024 (1,216 in 5+ unit buildings).
- This rent runs 32% of the median local income ($45k/yr) — at the standard rent-burdened threshold; future hikes will face affordability resistance.
Forward outlook
- Local home prices are declining (-3.0%/yr); year-one equity from $104 of loan paydown is wiped out by about $450 of value loss. Plan a longer hold.
- Wayne County population projected at -17% by 2050 — secular population decline; favor cash flow + early exit over multi-decade hold.
- At projected returns (-3.0% appreciation + 3.0% rent growth), your $4k cash investment doubles in ~1 year — after that, you're playing with house money.
Negotiation context
- It's been on market 59 days — a 3% lower offer ($15k) is reasonable based on typical stale-listing flexibility.
- 2 sale attempts; this cycle's ask has dropped $4k (21%) from the opening price — seller is motivated, your offer sets the floor, not the list.
Risks & watch-outs
- Watch-outs: property tax is 2.6% of price.
Questions for the listing agent
- It's been on market 59 days. Have you received any prior offers? Is the seller open to a 3% concession, seller financing, or rate buy-down credit?
- Built in 1969 — when were the roof, HVAC, electrical panel, plumbing, and water heater last replaced?
- Property tax is high relative to price — has the assessment been appealed recently, and will the sale trigger a re-assessment?
- Is there a deadline driving the sale (1031 exchange, divorce, estate, relocation)? That informs how much negotiation room exists.
- Schools are F-rated, which usually means shorter tenancies and higher turnover. Who's the typical renter profile here, and what's been the actual vacancy rate?
- Crime grade is F in this area — have there been break-ins, vandalism, or insurance claims at this property in the last 3 years? What carrier currently insures it and at what premium?
- The area grade is low — what's the realistic commute time and amenity access for the typical tenant pool here? Any planned neighborhood developments (good or bad) we should know about?
- What's the average days-on-market for RENTAL listings here right now (not sales)? A rising rental-DOM trend means longer vacancies and softer asking-rent achievability than the comps imply.
- What's the recent tenant-quality profile in this submarket — average credit score on applications, eviction rate, late-payment / NSF rate, and stable-employment percentage? A property-management company in the area should have these aggregated.
- How much new for-sale + rental construction is in the pipeline within 1–3 miles? Heavy new supply typically softens prices + rents 12–24 months out; constrained supply supports both.
Investment metrics
- 1% rule
- 7.83% ✓
- Cap rate
- 71.06%
- Cash-on-cash
- 231.31%
- DSCR
- 11.29
- GRM
- 1.1
CMA / ARV
- ARV (median comp)
- $40,401
- List price
- $15,000
- Delta
- -62.87%
- Verdict
- UNDERPRICED
- Comps
- 20 within 1.0 mi
Show comp detail 12 sales within ~0.75 mi
| Address | Dist | Beds/Ba | Sqft | Sold | Price | $/sf | Match |
|---|---|---|---|---|---|---|---|
| 14025 Dacosta St | 0.28mi | 3/1.0 | 946 (+3%) | 3mo | $15,500 | $16 | 80 |
| 12801 Bentler St | 0.56mi | 3/1.0 | 926 (+1%) | 7mo | $20,000 | $22 | 66 |
| 14177 Bentler St | 0.17mi | 4/1.0 (+1) | 1,000 (+9%) | 8mo | $30,000 | $30 | 65 |
| 22520 Lyndon St | 0.50mi | 3/1.0 | 942 (+3%) | 11mo | $59,900 | $64 | 63 |
| 14032 Patton St St | 0.63mi | 3/1.0 | 968 (+5%) | 3mo | $50,000 | $52 | 59 |
| 13955 Dolphin St | 0.26mi | 3/1.0 | 1,034 (+13%) | 10mo | $55,000 | $53 | 58 |
| 20511 Lyndon St | 0.70mi | 3/1.0 | 896 (-2%) | 8mo | $40,000 | $45 | 57 |
| 22612 Lyndon St | 0.55mi | 3/1.0 | 988 (+8%) | 7mo | $149,000 | $151 | 56 |
| 12914 Hazelton St | 0.75mi | 3/1.5 | 889 (-3%) | 4mo | $55,125 | $62 | 55 |
| 22556 Lyndon St | 0.53mi | 3/1.5 | 991 (+8%) | 7mo | $135,000 | $136 | 54 |
| 15044 Dacosta St | 0.68mi | 3/1.0 | 890 (-3%) | 11mo | $87,000 | $98 | 54 |
| 14305 Stout St | 0.72mi | 3/1.0 | 850 (-7%) | 9mo | $99,000 | $116 | 47 |
Match score weights: distance 35% · size 25% · config 20% · recency 20%. Top-matched comps best support the ARV.
Projected returns pro-forma
-3.0% appreciation · 3.0% rent growth · sell at horizon
- IRR
- —
- Equity multiple
- 12.70×
- Total profit
- $49,159
- Equity at exit
- $2,237
- IRR
- —
- Equity multiple
- 27.03×
- Total profit
- $109,310
- Equity at exit
- $1,297
Cash invested: $4,200 (down + closing). Projections, not guarantees.
Landlord ↔ Tenant lean methodology
- Overall (STATE)
- 62 Landlord-Friendly
- State Michigan
- 62 Landlord-Friendly · EVEN
- County
- — inherits STATE
- City
- — inherits STATE
ZIP-level market 48223
- Active inventory
- 158
- Price-to-rent
- 1.1×
Monthly cashflow live
- Estimated rent
- $1,174 high interval (Pro) →
- Mortgage (P&I)
- −$79
- Tax from tax record
- −$33 /mo · $396/yr
- Insurance
- −$6
- HOA
- −$0
- Vacancy / Maint / Mgmt
- −$247
- Net cashflow
- $810
Break-even live
UW: 25.0% down · 7.5% · 30yr · 1.5% tax · 5.0% vac · 8.0% maint · 8.0% mgmt
Financing live
Cash to close
- Down payment
- $3,750
- Closing costs
- $450
- Reserves months
- —
- Total cash needed
- —
Loan-product check · same deal, 3 products live
Conventional
25% down · 7.5% · 30yr
- Down + closing
- —
- Monthly P&I
- —
- Monthly cashflow
- —
- DSCR
- —
- Eligible?
- —
Personal DTI + credit; lowest rate.
DSCR
20% down · 8.5% · 30yr
- Down + closing
- —
- Monthly P&I
- —
- Monthly cashflow
- —
- DSCR
- —
- Eligible?
- —
No personal income docs; deal must DSCR.
Hard money
10% down · 12.0% · 12mo
- Down + closing
- —
- Monthly P&I
- —
- Monthly cashflow
- —
- DSCR
- —
- Eligible?
- —
Short-term bridge; refi at stabilization.
Rent comps 40 comps
| Address | Beds | Baths | Sqft | Rent | $/sqft | DOM | Units | Dist |
|---|---|---|---|---|---|---|---|---|
| 14177 Bentler St Detroit, MI | 4.0 | 1.0 | 1000 | $1,475 | $1.48 | 43d | 1 | 0.16mi |
| 22241 Lyndon St Detroit, MI | 3.0 | 1.0 | 960 | $1,100 | $1.15 | 16d | 1 | 0.37mi |
| 12880 Dolson St Detroit, MI | 1.0–2.0 | 1.0 | 750 | $1,200 | $1.60 | 43d | 6 | 0.45mi |
| 12850 Dolphin St Detroit, MI | 1.0–2.0 | 1.0 | 746 | $999 | $1.34 | 4d | 4 | 0.49mi |
| 12867 Westbrook St Detroit, MI | 2.0 | 1.0 | 736 | $1,050 | $1.43 | 43d | 1 | 0.52mi |
| 14280 Bramell St Detroit, MI | 3.0 | 1.0 | 1100 | $1,500 | $1.36 | 16d | 1 | 0.54mi |
| 14541 Kentfield St Detroit, MI | 3.0 | 1.0 | 797 | $1,300 | $1.63 | 16d | 1 | 0.82mi |
| 23610 Schoolcraft Rd Detroit, MI | 2.0 | 1.0 | 900 | $1,050 | $1.17 | 43d | 1 | 0.86mi |
| 23602 Schoolcraft Rd Detroit, MI | 2.0 | 1.0 | 900 | $1,050 | $1.17 | 43d | 1 | 0.87mi |
| 23606 Schoolcraft Rd Detroit, MI | 2.0 | 1.0 | 900 | $1,050 | $1.17 | 43d | 1 | 0.87mi |
| 23626 Schoolcraft Rd Detroit, MI | 2.0 | 1.0 | 900 | $1,050 | $1.17 | 43d | 1 | 0.87mi |
| 23614 Schoolcraft Rd Detroit, MI | 2.0 | 1.0 | 900 | $1,050 | $1.17 | 43d | 1 | 0.87mi |
| 23618 Schoolcraft Rd Detroit, MI | 2.0 | 1.0 | 900 | $1,050 | $1.17 | 43d | 1 | 0.88mi |
| 14088 Riverview St Unit 207 Detroit, MI | 2.0 | 1.0 | 750 | $975 | $1.30 | 43d | 1 | 0.88mi |
| 14088 Riverview St Unit 208 Detroit, MI | 2.0 | 1.0 | 750 | $985 | $1.31 | 43d | 1 | 0.88mi |
| 14088 Riverview St Unit 108 Detroit, MI | 2.0 | 1.0 | 750 | $900 | $1.20 | 43d | 1 | 0.88mi |
| 14122 Riverview St Detroit, MI | 2.0 | 1.0 | 900 | $985 | $1.09 | 43d | 1 | 0.88mi |
| 14092 Riverview St Detroit, MI | 2.0 | 1.0 | 900 | $1,050 | $1.17 | 43d | 1 | 0.88mi |
| 14086 Riverview St Detroit, MI | 2.0 | 1.0 | 900 | $900 | $1.00 | 44d | 1 | 0.88mi |
| 14096 Riverview St Detroit, MI | 2.0 | 1.0 | 900 | $985 | $1.09 | 43d | 1 | 0.88mi |
| 14114 Riverview St Detroit, MI | 2.0 | 1.0 | 900 | $900 | $1.00 | 20d | 1 | 0.88mi |
| 14110 Riverview St Detroit, MI | 2.0 | 1.0 | 900 | $1,050 | $1.17 | 43d | 1 | 0.88mi |
| 14128 Riverview St Unit 107 Detroit, MI | 2.0 | 1.0 | 900 | $845 | $0.94 | 43d | 1 | 0.89mi |
| 14128 Riverview St Apt 208 Detroit, MI | 2.0 | 1.0 | 900 | $985 | $1.09 | 43d | 1 | 0.89mi |
| 14136 Riverview St Detroit, MI | 2.0 | 1.0 | 900 | $1,050 | $1.17 | 43d | 1 | 0.89mi |
| 14128 Riverview St Unit 108 Detroit, MI | 2.0 | 1.0 | 900 | $900 | $1.00 | 43d | 1 | 0.89mi |
| 14126 Riverview St Detroit, MI | 2.0 | 1.0 | 900 | $985 | $1.09 | 43d | 1 | 0.89mi |
| 14128 Riverview St Unit 207 Detroit, MI | 2.0 | 1.0 | 900 | $800 | $0.89 | 43d | 1 | 0.89mi |
| 23622 Schoolcraft Rd Detroit, MI | 2.0 | 1.0 | 900 | $1,050 | $1.17 | 43d | 1 | 0.89mi |
| 14118 Riverview St Detroit, MI | 2.0 | 1.0 | 900 | $900 | $1.00 | 43d | 1 | 0.89mi |
| 23634 Schoolcraft Rd Detroit, MI | 2.0 | 1.0 | 900 | $1,050 | $1.17 | 43d | 1 | 0.89mi |
| 23640 Schoolcraft Rd Detroit, MI | 2.0 | 1.0 | 900 | $1,050 | $1.17 | 43d | 1 | 0.89mi |
| 23636 Schoolcraft Rd Unit 109 Detroit, MI | 2.0 | 1.0 | 750 | $975 | $1.30 | 43d | 1 | 0.89mi |
| 23636 Schoolcraft Rd Apt 212 Detroit, MI | 2.0 | 1.0 | 750 | $985 | $1.31 | 43d | 1 | 0.89mi |
| 23630 Schoolcraft Rd Detroit, MI | 2.0 | 1.0 | 900 | $1,050 | $1.17 | 43d | 1 | 0.89mi |
| 23636 Schoolcraft Rd Unit -209 Detroit, MI | 2.0 | 1.0 | 900 | $865 | $0.96 | 43d | 1 | 0.89mi |
| 14132 Riverview St Detroit, MI | 2.0 | 1.0 | 900 | $985 | $1.09 | 43d | 1 | 0.89mi |
| 14140 Riverview St Detroit, MI | 2.0 | 1.0 | 900 | $1,050 | $1.17 | 43d | 1 | 0.90mi |
| 14152 Riverview St Detroit, MI | 2.0 | 1.0 | 900 | $1,050 | $1.17 | 43d | 1 | 0.90mi |
| 14160 Riverview St Detroit, MI | 2.0 | 1.0 | 900 | $1,050 | $1.17 | 43d | 1 | 0.90mi |
Listing history 15 events
-
2026-06-18days on market $15,000 Active 59 DOM
-
2026-06-17days on market $15,000 Active 58 DOM
-
2026-06-15days on market $15,000 Active 56 DOM
-
2026-06-13days on market $15,000 Active 54 DOM
-
2026-06-13days on market $15,000 Active 53 DOM
-
2026-06-09days on market $15,000 Active 50 DOM
-
2026-06-08days on market $15,000 Active 49 DOM
-
2026-06-07days on market $15,000 Active 48 DOM
-
2026-06-04days on market $15,000 Active 45 DOM
-
2026-06-03days on market $15,000 Active 44 DOM
-
2026-06-02days on market $15,000 Active 43 DOM
-
2026-06-01days on market $15,000 Active 42 DOM
-
2026-05-31days on market $15,000 Active 41 DOM
-
2026-04-20$18,900 Active 601-char remark
Show marketing remark (601 chars)
This 3-bedroom, 1-bath home an excellent value-add opportunity for investors. Approximately 918 sq ft with solid structure in place, the property requires full renovation and is being sold as-is. Potential for fix-and-flip, buy-and-hold, or rental investment. Estimated after-repair value based on nearby renovated comparables has significant upside. Located in the Brightmoor area of Detroit near major roads, neighborhood amenities, and ongoing redevelopment activity. Ideal opportunity for investors seeking an affordable entry point in an active investment market. Buyer to verify all information.
ⓘ Source: listings_history table (triggers on properties + properties_extension) + one-shot
backfill from property_details.listing_events for pre-trigger history.
Tax reassessment forecast MI · Partial reset (capped growth)
- Current annual tax
- $396 · $33/mo
- Projected year-2 tax
- $396 · $33/mo
- Expected delta
- $0/yr ($0/mo · 0.0%)
ⓘ Screening estimate from a state-policy table — verify with the county assessor before closing.
Climate risk First Street
- Flood 1/10 Low FEMA zone X (unshaded) · 0% chance over 30 yrs
- Wildfire 1/10 Low
- Heat 2/10 Low 7 d/yr ≥99°F today · 14 d/yr by 30 yrs out
- Wind 2/10 Low
- Air quality 3/10 Moderate 2 unhealthy d/yr today · 3 by 30 yrs out
Nearby sold comps map
Loading sold comps map…
Walkable amenities ~0.75 mi
Loading nearby amenities…
Taxation est. · year 1
- Rental income
- $14,088
- − Mortgage interest
- −$840
- − Property taxes
- −$396
- − Insurance
- −$75
- − Repairs & maintenance
- −$1,127
- − Management
- −$1,127
- − Depreciation
- −$436
- Taxable income
- $10,087
- Est. tax owed @ 24.0%
- −$2,421
- After-tax cash flow
- $7,294/yr
For passive investors: Depreciation is non-cash, so a rental often shows a tax loss while cash-flowing — sheltering income. Rental losses are passive: they offset passive income freely, and up to $25,000/yr can offset ordinary (W-2) income if you actively participate and your MAGI is under $100k (phasing out to $0 by $150k); unused losses carry forward. On sale, claimed depreciation is recaptured at up to 25%, and gains may owe capital-gains tax (a 1031 exchange can defer both). Figures are a year-1 estimate at your 24.0% rate — not tax advice; consult a CPA.
Schools (NCES district)
- District
- Detroit Public Schools Community District
- NCES district ID
- 2601103
- Math proficiency
- 10% ▼ -2.00%
- Reading proficiency
- 24% ▲ 6.00%
- Median HH income
- $25,815
- Composite
- 13.06/100
- National rank
- #9564
- State rank
- #499 of 540 in MI
Livability — Detroit
- Score
- 73/100
- State rank
- #218
- US rank
- #5427
Category grades
Schools grade is shown separately in the Schools card above.
Census & demographics
- Census place
- Detroit, MI
- County
- Wayne County · 1,562,939 people
- City population
- 572,865
- Metro
- Detroit-Warren-Dearborn, MI
- Population (ZIP)
- 22,622
- Household income
- $44,512
- Rent vs Own
- Severe rent burden
- 1151.0
Population outlook (Wayne County) Hauer SSP2
- Today (2025)
- 1,675,273 people
- By 2030
- 1,620,300 · -3.3%
- By 2040
- 1,502,341 · -10.3%
- By 2050
- 1,384,039 · -17.4%
- By 2075
- 1,124,592 · -32.9%
- By 2100
- 881,193 · -47.4%
Race, ethnicity, and origin ACS 2023
- Neighborhood character
- Predominantly Black (86%)
- Race & ethnicity
- Black 86% White 7% Two or more races 5% Hispanic / Latino 2%
- Common ancestry
- Romanian 1% Iranian 1%
- Foreign-born
- 1% · Canada
- Languages at home
- 97% English-only · Spanish 2%
Political lean MEDSL · Wayne
- 2024 margin
- Strong D (+29.0) · D 62.7% · R 33.7% · Other 3.6%
- 2008→2024 swing
- -20.5pp toward R · 2008: 49.5pp · 2024: 29.0pp
- All cycles
- 2024: D+29.0 2020: D+38.1 2016: D+37.3 2012: D+46.9 2008: D+49.5
Not yet ingested
- Civics
- —
Market trends
- HPI YoY
- ▼ -303.41%
- Current HPI
- 138.2779
- Rent YoY
- —
- Metro
- Detroit-Warren-Dearborn, MI
- State GDP YoY
- ▲ 1.37%
- F500 in state
- 28
Industry mix (Fortune 500 HQ in MI)
| Industry | F500 HQs | Revenue |
|---|---|---|
| Automotive Parts | 3 | $48B |
|
||
| Automotive | 2 | $372B |
|
||
| Chemicals | 1 | $45B |
|
||
| Automotive Retail | 1 | $29B |
|
||
| Healthcare / Medical Devices | 1 | $23B |
|
||
| Automotive Technology | 1 | $20B |
|
||
Price history
+0.0% since first listed2 events — show timeline
- 2026-04-20 Listed $18,900 REALCOMP
- 2026-04-20 Listed $18,900 MiRealSource-MiMLS
Property tax history
+2.7%/yrLatest (2025): $396 · -51.9% YoY. Source: county tax records.
Cash-flow waterfall
monthlySold comps — $/sqft
last 12 mo · ≤1 miLoading sold comps…