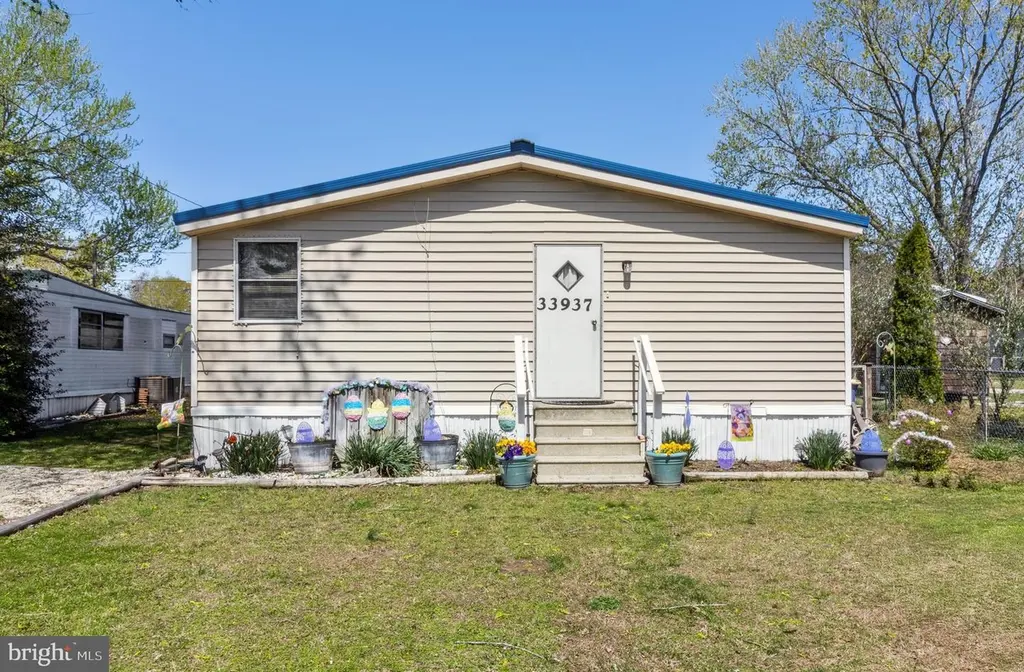
33937 Cornflower Ln #3837 · Lewes, DE
Flood risk 9/10 · Severe
- FEMA flood zone
- AE
- Chance of flooding over 30 yrs
- 0.99%
- Est. flood insurance / yr
- $2,026 – $9,024
Fire risk 3/10 · Minor
- Est. fire insurance / yr
- $476 – $884
Heat risk 8/10 · Major
- Hot days now (above 102°F)
- 7 days/yr
- Hot days in 30 yrs
- 18 days/yr
Wind risk 8/10 · Major
- Chance of severe wind over 30 yrs
- 80.0%
Air-quality risk 2/10 · Minimal
- Unhealthy air days now
- 1 days/yr
- Unhealthy air days in 30 yrs
- 1 days/yr
Risk factors via First Street. Map © Google.
Why this score? — see what drove the B grade
The composite is a weighted blend of 9 inputs, each scored 0–100. Each bar is that input's sub-score; the figure is the points it added to the 100-point composite (weight × sub-score).
- Cash flow +30.0/30.0
- 1% rule +10.0/10.0
- DSCR +10.0/10.0
- ARV discount +7.5/15.0
- Schools +4.2/10.0
- Livability +3.4/5.0
- Rent growth +2.7/5.0
- Condition / age +2.5/5.0
- Appreciation +0.0/10.0
$95,000
🖨 Deal sheet 📄 Offer letter ✓ Due diligence
Listing remarks MLS
Marina Community with boat ramp available and crabbing bridge. Large 3 Bd. 2 Bath split floor plan fully furnished Doublewide is great for year round living or week-end retreat. New shingled roof, appliances and heating sytem. Storage shed and more. Monthly lot rent of 4515.00 includes water, sewer, and trash pick-up.
Key facts
- Built 1984
- Listed 20 days
Property features AI
Finance
- Other: Accessibility: 2+ access exits; Above-grade finished area approximately 1,680 sq ft (estimated); Total below-grade area: 0; Ground rent noted as an annual expense; Dock/Slip conveyance available by lease
- Financial info: Monthly land lease payment; Land lease amount and frequency not displayed in this section
- HOA & community: Ground rent exists (annual payment); Land lease
Exterior
- Parking: Driveway
- Utilities: Private/community water source; Gravity septic field and community septic tank; Electric hot water; 150 Amp electric service
- Home design: Manufactured double-wide home; Estimated year built; Entry-level living (main-floor bedrooms and baths)
- Construction: Vinyl siding; Other foundation; Wood-burning fireplace (1)
- Exterior features: Outbuilding(s); Private/community water; Navigable creek access (Love Creek); Water access with private access, boat (powered), PWC and fishing allowed; Multiple-slip dock (5 slips) available by lease; dock/slip conveys
Interior
- Kitchen: Dishwasher; Microwave; Gas range/oven; Refrigerator; Icemaker; Exhaust fan
- Bedrooms: Three main-level bedrooms
- Flooring: Carpet
- Bathrooms: Two full bathrooms on the main level; Two full bathrooms total
- Heating & cooling: Forced air heating; Propane (leased) heating fuel; Central air conditioning; 150 Amp electric service with circuit breakers
- Interior features: Carpet; Ceiling fans; Eat-in kitchen; Master bathroom; Window treatments; Storm door
- Laundry & utility: Main-floor laundry; Washer; Dryer (electric); Water heater
Neighborhood map
What this means for you Summary
Snapshot
- This is a 3-bed/2.0-bath single-family listed at $95k.
Deal economics
- At list price, monthly cash flow is $728 ($9k/yr) — positive.
- The deal already cash-flows at list — no discount required.
- Meets the 1% rule at list price ($2k rent vs $95k).
- Recommended offer: $94k (1.5% below list) — sets the bar for market timing.
- Cap rate 21.3% vs local median 1.7% in Lewes — top-decile yield for the area; either an underpriced asset or a hidden risk that comps aren't pricing in. Stress-test before assuming the spread holds.
Location & tenants
- Location reads 67/100 on livability (#40 in DE) — a middle-class / working-renter tenant base. Strengths: crime A+, employment A+, health & safety A+; Watch: commute F, cost of living F.
- Cape Henlopen School District (town): math 42% / reading 55% proficiency, ranked #5 of 26 in DE (top 19%) — families likely to look elsewhere, expect single-tenant / working-renter base with shorter leases.
- Market conditions: Rents flat; 818 active listings in the ZIP; 2 comparable units currently listed for rent nearby; solid renter incomes; 4,354 units permitted in Sussex County in 2024 (344 in 5+ unit buildings).
Forward outlook
- Local home prices are declining (-3.0%/yr); year-one equity from $657 of loan paydown is wiped out by about $3k of value loss. Plan a longer hold.
- Sussex County population projected at +25% by 2050 — long-run rental-demand tailwind backs the buy-and-hold thesis.
- At projected returns (-3.0% appreciation + 0.8% rent growth), your $27k cash investment doubles in ~4 years — after that, you're playing with house money.
Negotiation context
- It's been on market 20 days — a 2% lower offer ($94k) is reasonable based on typical stale-listing flexibility.
- 2 sale attempts since 8y ago; this cycle's ask has dropped $20k (17%) from the opening price — seller is motivated, your offer sets the floor, not the list.
- Current owner paid $33k; list at $95k implies a 188% gain — meaningful room to come down on a strong offer.
Risks & watch-outs
- Watch-outs: flood insurance adds $460/mo.
- Climate carrying-cost: in FEMA flood zone AE (mandatory federal flood insurance); severe wind risk, 80% chance of damaging wind over 30y; extreme-heat days projected 7→18/yr by 2055 (HVAC capex compounding) — expect insurance premiums to compound above CPI over the hold.
Questions for the listing agent
- What's the actual annual flood-insurance premium (NFIP or private), and is the property in a SFHA with mandatory coverage?
- Is there a deadline driving the sale (1031 exchange, divorce, estate, relocation)? That informs how much negotiation room exists.
- Schools are B-rated — typically a magnet for longer-tenancy family renters. What's the average tenant stay here, and is there a school-zone premium baked into asking?
- What's the average days-on-market for RENTAL listings here right now (not sales)? A rising rental-DOM trend means longer vacancies and softer asking-rent achievability than the comps imply.
- What's the recent tenant-quality profile in this submarket — average credit score on applications, eviction rate, late-payment / NSF rate, and stable-employment percentage? A property-management company in the area should have these aggregated.
- How much new for-sale + rental construction is in the pipeline within 1–3 miles? Heavy new supply typically softens prices + rents 12–24 months out; constrained supply supports both.
Investment metrics
- 1% rule
- 2.46% ✓
- Cap rate
- 21.30%
- Cash-on-cash
- 53.61%
- DSCR
- 3.39
- GRM
- 3.4
CMA / ARV
- ARV (on-the-fly)
- $362,880
- Comps found
- 8
Show comp detail 8 sales within ~0.75 mi
| Address | Dist | Beds/Ba | Sqft | Sold | Price | $/sf | Match |
|---|---|---|---|---|---|---|---|
| 20834 Waterlilly Ln #53828 | 0.14mi | 4/2.0 (+1) | 1,568 (-7%) | 19mo | $115,000 | $73 | 62 |
| 34170 High Knoll Rd | 0.38mi | 3/2.0 | 1,850 (+10%) | 7mo | $479,000 | $259 | 60 |
| 8 Love Creek Dr | 0.68mi | 3/2.0 | 1,596 (-5%) | 4mo | $345,000 | $216 | 57 |
| 34106 Caitlins Cor | 0.25mi | 3/2.0 | 1,872 (+11%) | 18mo | $553,000 | $295 | 54 |
| 40 Love Creek Dr | 0.39mi | 3/2.0 | 1,838 (+9%) | 17mo | $465,000 | $253 | 52 |
| 49 Love Creek Dr | 0.52mi | 3/2.0 | 1,893 (+13%) | 4mo | $380,000 | $201 | 51 |
| 44 Love Creek Dr | 0.43mi | 3/2.0 | 1,878 (+12%) | 19mo | $350,000 | $186 | 44 |
| 33185 Fairfield Rd | 0.71mi | 4/2.0 (+1) | 1,882 (+12%) | 1mo | $375,000 | $199 | 41 |
Match score weights: distance 35% · size 25% · config 20% · recency 20%. Top-matched comps best support the ARV.
Projected returns pro-forma
-3.0% appreciation · 0.77% rent growth · sell at horizon
- IRR
- 24.8%
- Equity multiple
- 1.98×
- Total profit
- $26,164
- Equity at exit
- $14,165
- IRR
- 30.7%
- Equity multiple
- 3.39×
- Total profit
- $63,665
- Equity at exit
- $8,214
Cash invested: $26,600 (down + closing). Projections, not guarantees.
Landlord ↔ Tenant lean methodology
- Overall (STATE)
- 70 Landlord-Friendly
- State Delaware
- 70 Landlord-Friendly · D+7
- County
- — inherits STATE
- City
- — inherits STATE
ZIP-level market 19958
- Rents YoY
- 0.8%
- Active inventory
- 818
- Price-to-rent
- 3.4×
Monthly cashflow live
- Estimated rent
- $2,335 medium interval (Pro) →
- Mortgage (P&I)
- −$498
- Tax est. 1.5%
- −$119 /mo · $1,425/yr
- Insurance
- −$40
- Flood insurance flood zone
- −$460 /mo · $5,525/yr
- HOA
- −$0
- Vacancy / Maint / Mgmt
- −$490
- Net cashflow
- $728
Break-even live
UW: 25.0% down · 7.5% · 30yr · 1.5% tax · 5.0% vac · 8.0% maint · 8.0% mgmt
Financing live
Cash to close
- Down payment
- $23,750
- Closing costs
- $2,850
- Reserves months
- —
- Total cash needed
- —
Loan-product check · same deal, 3 products live
Conventional
25% down · 7.5% · 30yr
- Down + closing
- —
- Monthly P&I
- —
- Monthly cashflow
- —
- DSCR
- —
- Eligible?
- —
Personal DTI + credit; lowest rate.
DSCR
20% down · 8.5% · 30yr
- Down + closing
- —
- Monthly P&I
- —
- Monthly cashflow
- —
- DSCR
- —
- Eligible?
- —
No personal income docs; deal must DSCR.
Hard money
10% down · 12.0% · 12mo
- Down + closing
- —
- Monthly P&I
- —
- Monthly cashflow
- —
- DSCR
- —
- Eligible?
- —
Short-term bridge; refi at stabilization.
Rent comps 2 comps
| Address | Beds | Baths | Sqft | Rent | $/sqft | DOM | Units | Dist |
|---|---|---|---|---|---|---|---|---|
| 33707 Skiff Aly #207 Lewes, DE | 2.0 | 2.0 | 1227 | $1,800 | $1.47 | 13d | 1 | 0.21mi |
| 33530 Old Salt Ln #1206 Lewes, DE | 2.0 | 2.0 | 1313 | $2,150 | $1.64 | 44d | 1 | 0.31mi |
Listing history 24 events
-
2026-06-18days on market $95,000 Active 20 DOM
-
2026-06-17days on market $95,000 Active 19 DOM
-
2026-06-16days on market $95,000 Active 18 DOM
-
2026-06-15days on market $95,000 Active 17 DOM
-
2026-06-14days on market $95,000 Active 15 DOM
-
2026-06-13days on market $95,000 Active 14 DOM
-
2026-06-10days on market $95,000 Active 12 DOM
-
2026-06-09days on market $95,000 Active 11 DOM
-
2026-06-08days on market $95,000 Active 10 DOM
-
2026-06-07days on market $95,000 Active 9 DOM
-
2026-06-05days on market $95,000 Active 6 DOM
-
2026-06-03days on market $95,000 Active 5 DOM
-
2026-06-02days on market $95,000 Active 4 DOM
-
2026-06-01days on market $95,000 Active 3 DOM
-
2026-05-31days on market $95,000 Active 2 DOM
-
2026-05-30status $95,000 Active 1 DOM
-
2026-05-29historical $95,000
-
2025-05-13historical
-
2025-04-17price $105,000
-
2025-04-11$115,000 Active
-
2025-04-04historical
-
2019-04-05soldstatus $33,000 Closed 319-char remark
Show marketing remark (319 chars)
Marina Community with boat ramp available and crabbing bridge. Large 3 Bd. 2 Bath split floor plan fully furnished Doublewide is great for year round living or week-end retreat. New shingled roof, appliances and heating sytem. Storage shed and more. Monthly lot rent of 4515.00 includes water, sewer, and trash pick-up.
-
2019-03-07status Pending 319-char remark
Show marketing remark (319 chars)
Marina Community with boat ramp available and crabbing bridge. Large 3 Bd. 2 Bath split floor plan fully furnished Doublewide is great for year round living or week-end retreat. New shingled roof, appliances and heating sytem. Storage shed and more. Monthly lot rent of 4515.00 includes water, sewer, and trash pick-up.
-
2018-11-11$36,900 Active 319-char remark
Show marketing remark (319 chars)
Marina Community with boat ramp available and crabbing bridge. Large 3 Bd. 2 Bath split floor plan fully furnished Doublewide is great for year round living or week-end retreat. New shingled roof, appliances and heating sytem. Storage shed and more. Monthly lot rent of 4515.00 includes water, sewer, and trash pick-up.
ⓘ Source: listings_history table (triggers on properties + properties_extension) + one-shot
backfill from property_details.listing_events for pre-trigger history.
Climate risk First Street
- Flood 9/10 Extreme FEMA zone AE · 99% chance over 30 yrs
- Wildfire 3/10 Moderate
- Heat 8/10 Severe 7 d/yr ≥102°F today · 18 d/yr by 30 yrs out
- Wind 8/10 Severe 80% chance of damaging wind over 30 yrs
- Air quality 2/10 Low 1 unhealthy d/yr today · 1 by 30 yrs out
Nearby sold comps map
Loading sold comps map…
Walkable amenities ~0.75 mi
Loading nearby amenities…
Taxation est. · year 1
- Rental income
- $28,024
- − Mortgage interest
- −$5,321
- − Property taxes
- −$1,425
- − Insurance
- −$6,000
- − Repairs & maintenance
- −$2,242
- − Management
- −$2,242
- − Depreciation
- −$2,764
- Taxable income
- $8,030
- Est. tax owed @ 24.0%
- −$1,927
- After-tax cash flow
- $6,809/yr
For passive investors: Depreciation is non-cash, so a rental often shows a tax loss while cash-flowing — sheltering income. Rental losses are passive: they offset passive income freely, and up to $25,000/yr can offset ordinary (W-2) income if you actively participate and your MAGI is under $100k (phasing out to $0 by $150k); unused losses carry forward. On sale, claimed depreciation is recaptured at up to 25%, and gains may owe capital-gains tax (a 1031 exchange can defer both). Figures are a year-1 estimate at your 24.0% rate — not tax advice; consult a CPA.
Schools (NCES district)
- District
- Cape Henlopen School District
- NCES district ID
- 1000170
- Math proficiency
- 42% ▼ -14.00%
- Reading proficiency
- 55% ▼ -10.00%
- Median HH income
- $60,196
- Composite
- 42.47/100
- National rank
- #3214
- State rank
- #5 of 26 in DE
Livability — Lewes
- Score
- 67/100
- State rank
- #40
- US rank
- #11077
Category grades
Schools grade is shown separately in the Schools card above.
Census & demographics
- County
- Sussex County · 82,708 people
- City population
- 31,938
- Metro
- Salisbury, MD-DE
- Population (ZIP)
- 31,938
- Household income
- $97,197
- Rent vs Own
- Severe rent burden
- 545.0
Population outlook (Sussex County) Hauer SSP2
- Today (2025)
- 248,853 people
- By 2030
- 264,464 · +6.3%
- By 2040
- 290,980 · +16.9%
- By 2050
- 311,259 · +25.1%
- By 2075
- 352,488 · +41.6%
- By 2100
- 367,406 · +47.6%
Race, ethnicity, and origin ACS 2023
- Neighborhood character
- Predominantly White (88%)
- Race & ethnicity
- White 88% Two or more races 6% Hispanic / Latino 4% Black 2% Asian 2%
- Common ancestry
- Romanian 6% Slovak 3% Italian 2%
- Foreign-born
- 6% · Canada
- Languages at home
- 93% English-only · Spanish 3% Other Indo-European 1% Russian/Polish/Slavic 1%
Political lean MEDSL · Sussex
- 2024 margin
- R (+11.0) · D 43.9% · R 54.9% · Other 1.2%
- 2008→2024 swing
- -2.4pp toward R · 2008: -8.6pp · 2024: -11.0pp
- All cycles
- 2024: R+11.0 2020: R+11.2 2016: R+22.0 2012: R+13.0 2008: R+8.6
Not yet ingested
- Civics
- —
Market trends
- HPI YoY
- ▼ -204.07%
- Current HPI
- 299.0736
- Rent YoY
- ▲ 0.77%
- Metro
- Salisbury, MD-DE
- State GDP YoY
- —
- F500 in state
- 0
Price history
+157.5% since first listed8 events — show timeline
- 2026-05-29 Coming Soon $95,000 BRIGHT MLS
- 2025-05-13 Listing Removed — BRIGHT MLS
- 2025-04-17 Price Changed $105,000 BRIGHT MLS
- 2025-04-11 Listed $115,000 BRIGHT MLS
- 2025-04-04 Coming Soon — BRIGHT MLS
- 2019-04-05 Sold (MLS) $33,000 BRIGHT MLS
- 2019-03-07 Pending — BRIGHT MLS
- 2018-11-11 Listed $36,900 BRIGHT MLS
Cash-flow waterfall
monthlySold comps — $/sqft
last 12 mo · ≤1 miLoading sold comps…