 Fourplex
12570 N Cotton Ln #8790 · Surprise, AZ
Flood risk 3/10 · Minor
- FEMA flood zone
- X (shaded)
- Chance of flooding over 30 yrs
- 0.18%
- Est. flood insurance / yr
- $507 – $1,088
Fire risk 5/10 · Moderate
- Est. fire insurance / yr
- $610 – $1,132
Heat risk 9/10 · Severe
- Hot days now (above 112°F)
- 7 days/yr
- Hot days in 30 yrs
- 19 days/yr
Wind risk 1/10 · Minimal
- Chance of severe wind over 30 yrs
- —
Air-quality risk 2/10 · Minimal
- Unhealthy air days now
- 1 days/yr
- Unhealthy air days in 30 yrs
- 1 days/yr
Risk factors via First Street. Map © Google.
Why this score? — see what drove the D+ grade
The composite is a weighted blend of 9 inputs, each scored 0–100. Each bar is that input's sub-score; the figure is the points it added to the 100-point composite (weight × sub-score).
- Cash flow +14.8/30.0
- ARV discount +7.5/15.0
- Appreciation +5.1/10.0
- DSCR +4.5/10.0
- 1% rule +4.1/10.0
- Condition / age +4.0/5.0
- Livability +3.7/5.0
- Schools +3.3/10.0
- Rent growth +2.4/5.0
$1,125,000
🖨 Deal sheet 📄 Offer letter ✓ Due diligence
Multi-family units
County records classify this as Multi-Family (2-4 Unit). Listing-text estimate: 4 units. confirmed
Listing remarks MLS
Hard to find newly built townhome style fourplex in a great location. Fully leased up. Buyer required to use MAXX PM for property management. HOA covers the following services for this individual unit: Common Area Water, Landscape Maintenance, Garbage Service, Clubhouse/Pool, Internet, Smart Home. Buyer to verify all information.
Key facts
- Garbage service
- Newly built townhome
- Common area water
Tags
Neighborhood map
What this means for you Summary
Snapshot
- This is a 4 × 3-bed/2.0-bath units multifamily listed at $1.12M. Condition is rated good.
Deal economics
- At list price, monthly cash flow is $306 ($4k/yr) — positive. Per door: $77/mo.
- The deal already cash-flows at list — no discount required.
- To meet the 1% rule (rent ≥ 1% of price), the offer needs to be $1.02M (9.1% below list).
- Recommended offer: $1.02M (9.1% below list) — sets the bar for 1% rule.
- Cap rate 6.6% vs local median 3.3% in Surprise — top-decile yield for the area; either an underpriced asset or a hidden risk that comps aren't pricing in. Stress-test before assuming the spread holds.
Location & tenants
- Location reads 74/100 on livability (#19 in AZ, #4,616 nationally) — a middle-class / working-renter tenant base. Strengths: crime A+, housing A+, employment A-; Watch: health & safety D+, amenities D-, commute F.
- Dysart Unified District (4243) (suburban): math 34% / reading 40% proficiency, ranked #73 of 249 in AZ (top 29%) — families likely to look elsewhere, expect single-tenant / working-renter base with shorter leases.
- Market conditions: Rents soft (-0.6%/yr); 376 active listings in the ZIP; high-income renter base; 36,011 units permitted in Maricopa County in 2024 (12,801 in 5+ unit buildings).
- At $10,229/mo this rent would consume 109% of the median local household income ($112k/yr) (locally 224% of renters already pay >50% of income on rent) — very limited rent-growth headroom before tenants either downsize or default.
Forward outlook
- In year one you build about $11k of equity ($8k loan paydown + $3k appreciation (0.3% local appreciation)).
- Maricopa County population projected at +38% by 2050 — long-run rental-demand tailwind backs the buy-and-hold thesis.
- By year 6, paydown + projected appreciation supports a ~$71k cash-out refi (75% LTV) — recoverable capital for the next deal without selling this one.
Negotiation context
- It's been on market 57 days — a 3% lower offer ($1.09M) is reasonable based on typical stale-listing flexibility.
- 3 sale attempts since 2y ago with the ask held roughly flat each time — persistent listings suggest the price (not the market) is what's stuck; bring a comps-based counter.
Risks & watch-outs
- Climate carrying-cost: moderate wildfire risk; extreme-heat days projected 7→19/yr by 2055 (HVAC capex compounding) — expect insurance premiums to compound above CPI over the hold.
Questions for the listing agent
- It's been on market 57 days. Have you received any prior offers? Is the seller open to a 9% concession, seller financing, or rate buy-down credit?
- Can we see the unit-by-unit rent roll, current vacancy, and any below-market leases? What's the average tenancy length?
- What capital expenditures (roof, boiler, parking lot, exteriors) have been made in the last 5 years, and what's planned in the next 2?
- Is there a deadline driving the sale (1031 exchange, divorce, estate, relocation)? That informs how much negotiation room exists.
- The area grade is low — what's the realistic commute time and amenity access for the typical tenant pool here? Any planned neighborhood developments (good or bad) we should know about?
- What's the average days-on-market for RENTAL listings here right now (not sales)? A rising rental-DOM trend means longer vacancies and softer asking-rent achievability than the comps imply.
- What's the recent tenant-quality profile in this submarket — average credit score on applications, eviction rate, late-payment / NSF rate, and stable-employment percentage? A property-management company in the area should have these aggregated.
- How much new apartment / multifamily construction is in the pipeline within 1–3 miles? Heavy new supply (>2% of stock underway) typically softens rents 12–24 months out; light construction supports rent growth.
Investment metrics
- 1% rule
- 0.91% ✗
- Cap rate
- 6.62%
- Cash-on-cash
- 1.17%
- DSCR
- 1.05
- GRM
- 9.2
CMA / ARV
No comps found within radius.
Show comp detail 2 sales within ~0.75 mi
| Address | Dist | Beds/Ba | Sqft | Sold | Price | $/sf | Match |
|---|---|---|---|---|---|---|---|
| 12570 N Cotton Ln #1079082 | 0.04mi | 12/8.0 | — | 7mo | $1,100,000 | — | 80 |
| 12570 N Cotton Ln Unit 29-32 | 0.06mi | 12/12.0 | — | 1mo | $1,000,000 | — | 68 |
Match score weights: distance 35% · size 25% · config 20% · recency 20%. Top-matched comps best support the ARV.
Projected returns pro-forma
0.28% appreciation · 0.0% rent growth · sell at horizon
- IRR
- -1.9%
- Equity multiple
- 0.91×
- Total profit
- $-28,107
- Equity at exit
- $342,748
- IRR
- 1.5%
- Equity multiple
- 1.16×
- Total profit
- $50,298
- Equity at exit
- $425,063
Cash invested: $315,000 (down + closing). Projections, not guarantees.
Landlord ↔ Tenant lean methodology
- Overall (STATE)
- 87 Strongly Landlord-Friendly
- State Arizona
- 87 Strongly Landlord-Friendly · R+3
- County
- — inherits STATE
- City
- — inherits STATE
ZIP-level market 85388
- Home prices YoY
- 0.1%
- Rents YoY
- -0.6%
- Active inventory
- 376
- Price-to-rent
- 36.7×
Monthly cashflow live
- Estimated rent
- $10,229 high interval (Pro) →
- Mortgage (P&I)
- −$5,900
- Tax est. 1.5%
- −$1,406 /mo · $16,875/yr
- Insurance
- −$469
- HOA
- −$0
- Vacancy / Maint / Mgmt
- −$2,148
- Net cashflow
- $306
Break-even live
4-unit breakdown (identical units grouped — click to expand)
| Units | Beds | Baths | Est. rent |
|---|---|---|---|
| 4× units | 3 | 2 | $10,228 |
| #1 | 3 | 2 | $2,557 |
| #2 | 3 | 2 | $2,557 |
| #3 | 3 | 2 | $2,557 |
| #4 | 3 | 2 | $2,557 |
| Total (4 units) | $10,229 | ||
UW: 25.0% down · 7.5% · 30yr · 1.5% tax · 5.0% vac · 8.0% maint · 8.0% mgmt
Financing live
Cash to close
- Down payment
- $281,250
- Closing costs
- $33,750
- Reserves months
- —
- Total cash needed
- —
Loan-product check · same deal, 3 products live
Conventional
25% down · 7.5% · 30yr
- Down + closing
- —
- Monthly P&I
- —
- Monthly cashflow
- —
- DSCR
- —
- Eligible?
- —
Personal DTI + credit; lowest rate.
DSCR
20% down · 8.5% · 30yr
- Down + closing
- —
- Monthly P&I
- —
- Monthly cashflow
- —
- DSCR
- —
- Eligible?
- —
No personal income docs; deal must DSCR.
Hard money
10% down · 12.0% · 12mo
- Down + closing
- —
- Monthly P&I
- —
- Monthly cashflow
- —
- DSCR
- —
- Eligible?
- —
Short-term bridge; refi at stabilization.
Listing history 18 events
-
2026-06-18days on market $1,125,000 Active 57 DOM
-
2026-06-17days on market $1,125,000 Active 56 DOM
-
2026-06-16days on market $1,125,000 Active 55 DOM
-
2026-06-15days on market $1,125,000 Active 54 DOM
-
2026-06-13days on market $1,125,000 Active 52 DOM
-
2026-06-09days on market $1,125,000 Active 48 DOM
-
2026-06-08days on market $1,125,000 Active 47 DOM
-
2026-06-07days on market $1,125,000 Active 46 DOM
-
2026-06-04days on market $1,125,000 Active 43 DOM
-
2026-06-03days on market $1,125,000 Active 42 DOM
-
2026-06-02days on market $1,125,000 Active 41 DOM
-
2026-06-01days on market $1,125,000 Active 40 DOM
-
2026-05-31days on market $1,125,000 Active 39 DOM
-
2026-04-21$1,125,000 Active 332-char remark
Show marketing remark (332 chars)
Hard to find newly built townhome style fourplex in a great location. Fully leased up. Buyer required to use MAXX PM for property management. HOA covers the following services for this individual unit: Common Area Water, Landscape Maintenance, Garbage Service, Clubhouse/Pool, Internet, Smart Home. Buyer to verify all information.
-
2025-03-26status Active
-
2025-03-07status Pending
-
2025-03-07historical
-
2024-12-04$1,200,000 Active
ⓘ Source: listings_history table (triggers on properties + properties_extension) + one-shot
backfill from property_details.listing_events for pre-trigger history.
Climate risk First Street
- Flood 3/10 Moderate FEMA zone X (shaded) · 18% chance over 30 yrs
- Wildfire 5/10 Major
- Heat 9/10 Extreme 7 d/yr ≥112°F today · 19 d/yr by 30 yrs out
- Wind 1/10 Low
- Air quality 2/10 Low 1 unhealthy d/yr today · 1 by 30 yrs out
Nearby sold comps map
Loading sold comps map…
Walkable amenities ~0.75 mi
Loading nearby amenities…
Taxation est. · year 1
- Rental income
- $122,748
- − Mortgage interest
- −$63,017
- − Property taxes
- −$16,875
- − Insurance
- −$5,625
- − Repairs & maintenance
- −$9,820
- − Management
- −$9,820
- − Depreciation
- −$32,727
- Taxable loss
- −$15,136
- Est. tax savings @ 24.0%
- +$3,633
- After-tax cash flow
- $7,308/yr
For passive investors: Depreciation is non-cash, so a rental often shows a tax loss while cash-flowing — sheltering income. Rental losses are passive: they offset passive income freely, and up to $25,000/yr can offset ordinary (W-2) income if you actively participate and your MAGI is under $100k (phasing out to $0 by $150k); unused losses carry forward. On sale, claimed depreciation is recaptured at up to 25%, and gains may owe capital-gains tax (a 1031 exchange can defer both). Figures are a year-1 estimate at your 24.0% rate — not tax advice; consult a CPA.
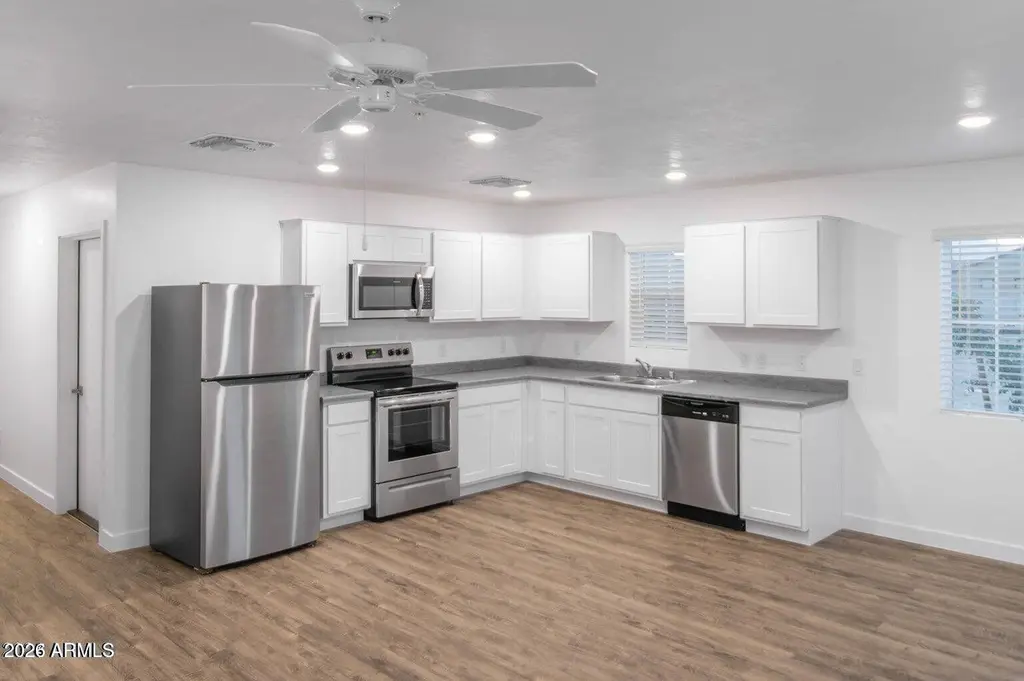
Condition & rehab AI · 12 photos
This fourplex is in excellent condition with modern updates and a great location. It is fully leased up and ready for a new owner.
Value-add opportunities
- Both Painting exterior and interior walls — Fresh paint enhances curb appeal and interior aesthetics.
- Both Landscaping improvements — Enhances curb appeal and adds value to the property.
Renovation cost estimate screening
Value-add ROI direction
- Both Painting exterior and interior walls — Fresh paint enhances curb appeal and interior aesthetics. ↑
- Both Landscaping improvements — Enhances curb appeal and adds value to the property. ↑
ⓘ Cost ranges are severity-bucket heuristics (US national rule-of-thumb). Get contractor quotes + a written scope before underwriting a rehab budget.
Schools (NCES district)
- District
- Dysart Unified District (4243)
- NCES district ID
- 0402690
- Math proficiency
- 34% ▼ -10.00%
- Reading proficiency
- 40% ▼ -5.00%
- Median HH income
- $58,033
- Composite
- 32.76/100
- National rank
- #5634
- State rank
- #73 of 249 in AZ
Livability — Surprise
- Score
- 74/100
- State rank
- #19
- US rank
- #4616
Category grades
Schools grade is shown separately in the Schools card above.
Census & demographics
- Census place
- Surprise, AZ
- County
- Maricopa County · 4,537,380 people
- City population
- 160,031
- Metro
- Phoenix-Mesa-Chandler, AZ
- Population (ZIP)
- 35,369
- Household income
- $112,164
- Rent vs Own
- Severe rent burden
- 224.0
Population outlook (Maricopa County) Hauer SSP2
- Today (2025)
- 4,979,203 people
- By 2030
- 5,378,229 · +8.0%
- By 2040
- 6,156,598 · +23.6%
- By 2050
- 6,872,376 · +38.0%
- By 2075
- 8,401,270 · +68.7%
- By 2100
- 9,247,439 · +85.7%
Race, ethnicity, and origin ACS 2023
- Neighborhood character
- Diverse neighborhood (Simpson 0.57)
- Race & ethnicity
- White 61% Hispanic / Latino 22% Two or more races 12% Black 6% Asian 2% Native American 1%
- Hispanic origin (detail)
- Mexican 16%
- Common ancestry
- Romanian 3% Italian 3% Portuguese 2%
- Foreign-born
- 8% · Canada
- Languages at home
- 88% English-only · Spanish 7% Russian/Polish/Slavic 2% Tagalog/Filipino 1%
Political lean MEDSL · Maricopa
- 2024 margin
- Toss-up / Even · D 47.7% · R 51.2% · Other 1.1%
- 2008→2024 swing
- +7.1pp toward D · 2008: -10.6pp · 2024: -3.5pp
- All cycles
- 2024: R+3.5 2020: D+2.2 2016: R+3.5 2012: R+12.0 2008: R+10.6
Not yet ingested
- Civics
- —
Market trends
- HPI YoY
- ▲ 0.28%
- Current HPI
- 272.9859
- Rent YoY
- ▼ -0.57%
- Metro
- Phoenix-Mesa-Chandler, AZ
- State GDP YoY
- ▲ 4.54%
- F500 in state
- 20
Industry mix (Fortune 500 HQ in AZ)
| Industry | F500 HQs | Revenue |
|---|---|---|
| Technology | 2 | $13B |
|
||
| Mining / Metals | 1 | $23B |
|
||
| Environmental Services | 1 | $16B |
|
||
| Metals / Steel | 1 | $14B |
|
||
| Technology Distribution | 1 | $9B |
|
||
| Homebuilding | 1 | $8B |
|
||
Price history
-6.2% since first listed5 events — show timeline
- 2026-04-21 Listed $1,125,000 ARMLS
- 2025-03-26 Relisted — ARMLS
- 2025-03-07 Pending — ARMLS
- 2025-03-07 Listing Removed — ARMLS
- 2024-12-04 Listed $1,200,000 ARMLS
Cash-flow waterfall
monthlySold comps — $/sqft
last 12 mo · ≤1 miLoading sold comps…