108 Shadow Stone Dr · Simpsonville, SC
Flood risk No data
- FEMA flood zone
- —
- Chance of flooding over 30 yrs
- —
- Est. flood insurance / yr
- —
Fire risk No data
- Est. fire insurance / yr
- —
Heat risk No data
- Hot days now (above threshold)
- —
- Hot days in 30 yrs
- —
Wind risk No data
- Chance of severe wind over 30 yrs
- —
Air-quality risk No data
- Unhealthy air days now
- —
- Unhealthy air days in 30 yrs
- —
Risk factors via First Street. Map © Google.
Why this score? — see what drove the D+ grade
The composite is a weighted blend of 9 inputs, each scored 0–100. Each bar is that input's sub-score; the figure is the points it added to the 100-point composite (weight × sub-score).
- Cash flow +16.5/30.0
- ARV discount +9.5/15.0
- DSCR +5.1/10.0
- 1% rule +4.5/10.0
- Livability +4.4/5.0
- Schools +4.2/10.0
- Rent growth +3.2/5.0
- Condition / age +2.5/5.0
- Appreciation +0.0/10.0
$399,999
🖨 Deal sheet 📄 Offer letter ✓ Due diligence
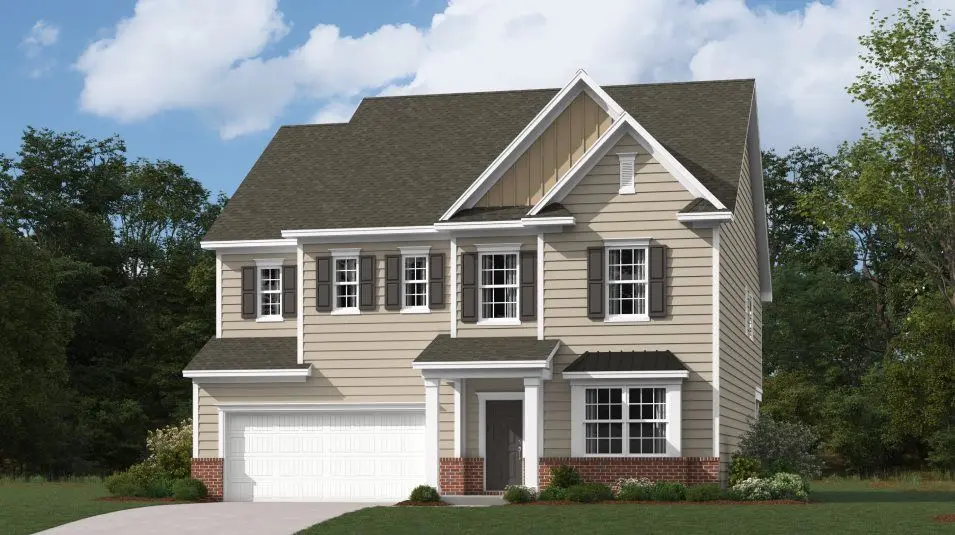
Listing remarks
This new two-story home was designed for gracious living. The first floor features a large family room for shared moments, a modern kitchen, a casual breakfast room to complement a formal dining room and a front porch and covered patio for outdoor living. Upstairs are a loft, three secondary bedrooms with walk-in closets and the owner's suite, which has two of them.
Key facts
- 2 garage spots
- Built 2026
- Listed 51 days
Property features AI
Finance
- Other: Address: 108 Shadow Stone Dr, Simpsonville SC 29680; Status: Active; Last modified: 2026-05-21
- Financial info: List price $413,999
- HOA & community:
Exterior
- Parking: 2 garage spaces (2 total parking spaces)
- Security:
- Utilities:
- Home design: Spec new construction — Hunter plan
- Construction:
- Exterior features: Living area of 2810 (interior size provided)
Interior
- Kitchen:
- Bedrooms: 4 bedrooms
- Flooring:
- Bathrooms: 3 full bathrooms and 1 half bathroom
- Heating & cooling:
- Interior features: Open plan living areas
- Laundry & utility:
Neighborhood map
What this means for you Summary
Snapshot
- This is a 4-bed/3.5-bath single-family listed at $400k.
Deal economics
- At list price, monthly cash flow is $237 ($3k/yr) — positive.
- The deal already cash-flows at list — no discount required.
- To meet the 1% rule (rent ≥ 1% of price), the offer needs to be $380k (5.0% below list).
- Recommended offer: $380k (5.0% below list) — sets the bar for 1% rule.
- Cap rate 7.0% vs local median 3.9% in Simpsonville — top-decile yield for the area; either an underpriced asset or a hidden risk that comps aren't pricing in. Stress-test before assuming the spread holds.
Location & tenants
- Location reads 87/100 on livability (#1 in SC, #295 nationally) — a professional / high-income tenant draw. Strengths: commute A+, housing A+, health & safety A+.
- Greenville 01 (suburban): math 44% / reading 54% proficiency, ranked #10 of 80 in SC (top 12%) — families likely to look elsewhere, expect single-tenant / working-renter base with shorter leases.
- Market conditions: Rents rising (+2.9%/yr); 245 active listings in the ZIP; 2 comparable units currently listed for rent nearby; solid renter incomes; 5,595 units permitted in Greenville County in 2024 (566 in 5+ unit buildings).
- At $3,800/mo this rent would consume 53% of the median local household income ($87k/yr) (locally 553% of renters already pay >50% of income on rent) — very limited rent-growth headroom before tenants either downsize or default.
Forward outlook
- Local home prices are declining (-3.0%/yr); year-one equity from $3k of loan paydown is wiped out by about $12k of value loss. Plan a longer hold.
- Greenville County population projected at +34% by 2050 — long-run rental-demand tailwind backs the buy-and-hold thesis.
Negotiation context
- It's been on market 51 days — a 3% lower offer ($388k) is reasonable based on typical stale-listing flexibility.
Questions for the listing agent
- It's been on market 51 days. Have you received any prior offers? Is the seller open to a 5% concession, seller financing, or rate buy-down credit?
- Is there a deadline driving the sale (1031 exchange, divorce, estate, relocation)? That informs how much negotiation room exists.
- Schools are B-rated — typically a magnet for longer-tenancy family renters. What's the average tenant stay here, and is there a school-zone premium baked into asking?
- The area grade is low — what's the realistic commute time and amenity access for the typical tenant pool here? Any planned neighborhood developments (good or bad) we should know about?
- What's the average days-on-market for RENTAL listings here right now (not sales)? A rising rental-DOM trend means longer vacancies and softer asking-rent achievability than the comps imply.
- What's the recent tenant-quality profile in this submarket — average credit score on applications, eviction rate, late-payment / NSF rate, and stable-employment percentage? A property-management company in the area should have these aggregated.
- How much new for-sale + rental construction is in the pipeline within 1–3 miles? Heavy new supply typically softens prices + rents 12–24 months out; constrained supply supports both.
Investment metrics
- 1% rule
- 0.95% ✗
- Cap rate
- 7.01%
- Cash-on-cash
- 2.54%
- DSCR
- 1.11
- GRM
- 8.8
CMA / ARV
- ARV (on-the-fly)
- $418,690
- Comps found
- 3
Show comp detail 3 sales within ~0.75 mi
| Address | Dist | Beds/Ba | Sqft | Sold | Price | $/sf | Match |
|---|---|---|---|---|---|---|---|
| 4 Lenten Rose Ct | 0.41mi | 5/3.5 (+1) | 2,848 (+1%) | 7mo | $425,000 | $149 | 68 |
| 202 Seneca Dr | 0.10mi | 4/2.5 | 2,694 (-4%) | 23mo | $347,350 | $129 | 65 |
| 9 Bingham Way | 0.73mi | 4/3.0 | 3,111 (+11%) | 2mo | $720,000 | $231 | 45 |
Match score weights: distance 35% · size 25% · config 20% · recency 20%. Top-matched comps best support the ARV.
Projected returns pro-forma
-3.0% appreciation · 2.85% rent growth · sell at horizon
- IRR
- -12.4%
- Equity multiple
- 0.55×
- Total profit
- $-50,212
- Equity at exit
- $59,641
- IRR
- -3.6%
- Equity multiple
- 0.76×
- Total profit
- $-26,364
- Equity at exit
- $34,585
Cash invested: $112,000 (down + closing). Projections, not guarantees.
Landlord ↔ Tenant lean methodology
- Overall (STATE)
- 90 Strongly Landlord-Friendly
- State South Carolina
- 90 Strongly Landlord-Friendly · R+6
- County
- — inherits STATE
- City
- — inherits STATE
ZIP-level market 29680
- Home prices YoY
- -31.2%
- Rents YoY
- 2.9%
- Active inventory
- 245
- Price-to-rent
- 8.8×
Monthly cashflow live
- Estimated rent
- $3,800 medium interval (Pro) →
- Mortgage (P&I)
- −$2,098
- Tax est. 1.5%
- −$500 /mo · $6,000/yr
- Insurance
- −$167
- HOA
- −$0
- Vacancy / Maint / Mgmt
- −$798
- Net cashflow
- $237
Break-even live
UW: 25.0% down · 7.5% · 30yr · 1.5% tax · 5.0% vac · 8.0% maint · 8.0% mgmt
Financing live
Cash to close
- Down payment
- $100,000
- Closing costs
- $12,000
- Reserves months
- —
- Total cash needed
- —
Loan-product check · same deal, 3 products live
Conventional
25% down · 7.5% · 30yr
- Down + closing
- —
- Monthly P&I
- —
- Monthly cashflow
- —
- DSCR
- —
- Eligible?
- —
Personal DTI + credit; lowest rate.
DSCR
20% down · 8.5% · 30yr
- Down + closing
- —
- Monthly P&I
- —
- Monthly cashflow
- —
- DSCR
- —
- Eligible?
- —
No personal income docs; deal must DSCR.
Hard money
10% down · 12.0% · 12mo
- Down + closing
- —
- Monthly P&I
- —
- Monthly cashflow
- —
- DSCR
- —
- Eligible?
- —
Short-term bridge; refi at stabilization.
Rent comps 2 comps
| Address | Beds | Baths | Sqft | Rent | $/sqft | DOM | Units | Dist |
|---|---|---|---|---|---|---|---|---|
| 404 Blue Sage Pl Simpsonville, SC | 4.0 | 2.0 | 1950 | $6,000 | $3.08 | 23d | 1 | 0.37mi |
| 101 Chadmore St Simpsonville, SC | 5.0 | 3.0 | 2400 | $2,400 | $1.00 | 23d | 1 | 1.02mi |
Listing history 14 events
-
2026-06-18days on market $399,999 Active 51 DOM
-
2026-06-17days on market $399,999 Active 50 DOM
-
2026-06-16days on market $399,999 Active 49 DOM
-
2026-06-15days on market $399,999 Active 48 DOM
-
2026-06-13days on market $399,999 Active 46 DOM
-
2026-06-13days on market $399,999 Active 45 DOM
-
2026-06-10pricedays on market $399,999 Active 43 DOM
-
2026-06-09days on market $409,999 Active 42 DOM
-
2026-06-08days on market $409,999 Active 41 DOM
-
2026-06-07days on market $409,999 Active 40 DOM
-
2026-06-03days on market $409,999 Active 36 DOM
-
2026-06-03pricedays on market $409,999 Active 35 DOM
-
2026-06-01days on market $411,999 Active 34 DOM
-
2026-05-31days on market $411,999 Active 33 DOM
ⓘ Source: listings_history table (triggers on properties + properties_extension) + one-shot
backfill from property_details.listing_events for pre-trigger history.
Nearby sold comps map
Loading sold comps map…
Walkable amenities ~0.75 mi
Loading nearby amenities…
Taxation est. · year 1
- Rental income
- $45,595
- − Mortgage interest
- −$22,406
- − Property taxes
- −$6,000
- − Insurance
- −$2,000
- − Repairs & maintenance
- −$3,648
- − Management
- −$3,648
- − Depreciation
- −$11,636
- Taxable loss
- −$3,742
- Est. tax savings @ 24.0%
- +$898
- After-tax cash flow
- $3,747/yr
For passive investors: Depreciation is non-cash, so a rental often shows a tax loss while cash-flowing — sheltering income. Rental losses are passive: they offset passive income freely, and up to $25,000/yr can offset ordinary (W-2) income if you actively participate and your MAGI is under $100k (phasing out to $0 by $150k); unused losses carry forward. On sale, claimed depreciation is recaptured at up to 25%, and gains may owe capital-gains tax (a 1031 exchange can defer both). Figures are a year-1 estimate at your 24.0% rate — not tax advice; consult a CPA.
Schools (NCES district)
- District
- Greenville 01
- NCES district ID
- 4502310
- Math proficiency
- 44% ▼ -10.00%
- Reading proficiency
- 54% ▼ -2.00%
- Median HH income
- $49,596
- Composite
- 41.88/100
- National rank
- #3370
- State rank
- #10 of 80 in SC
Livability — Simpsonville
- Score
- 87/100
- State rank
- #1
- US rank
- #295
Category grades
Schools grade is shown separately in the Schools card above.
Census & demographics
- County
- Greenville County · 573,815 people
- City population
- 104,420
- Metro
- Greenville-Anderson, SC
- Population (ZIP)
- 35,770
- Household income
- $86,716
- Rent vs Own
- Severe rent burden
- 553.0
Population outlook (Greenville County) Hauer SSP2
- Today (2025)
- 574,580 people
- By 2030
- 615,615 · +7.1%
- By 2040
- 695,373 · +21.0%
- By 2050
- 769,367 · +33.9%
- By 2075
- 933,296 · +62.4%
- By 2100
- 1,029,196 · +79.1%
Race, ethnicity, and origin ACS 2023
- Neighborhood character
- Diverse neighborhood (Simpson 0.60)
- Race & ethnicity
- White 57% Black 24% Two or more races 10% Hispanic / Latino 9% Asian 2%
- Hispanic origin (detail)
- Mexican 2% Puerto Rican 2%
- Common ancestry
- Lithuanian 2% Slovak 2% Italian 2%
- Foreign-born
- 8% · Canada, Jamaica
- Languages at home
- 89% English-only · Spanish 7% French/Haitian/Cajun 1% Other Indo-European 1%
Political lean MEDSL · Greenville
- 2024 margin
- Strong R (+22.2) · D 38.0% · R 60.2% · Other 1.8%
- 2008→2024 swing
- +1.7pp toward D · 2008: -23.9pp · 2024: -22.2pp
- All cycles
- 2024: R+22.2 2020: R+18.2 2016: R+24.7 2012: R+27.8 2008: R+23.9
Not yet ingested
- Civics
- —
Market trends
- HPI YoY
- ▼ -102.15%
- Current HPI
- 224.9051
- Rent YoY
- ▲ 2.85%
- Metro
- Greenville-Anderson, SC
- State GDP YoY
- ▲ 4.51%
- F500 in state
- 2
Industry mix (Fortune 500 HQ in SC)
| Industry | F500 HQs | Revenue |
|---|---|---|
| Packaging | 1 | $7B |
|
||
Cash-flow waterfall
monthlySold comps — $/sqft
last 12 mo · ≤1 miLoading sold comps…