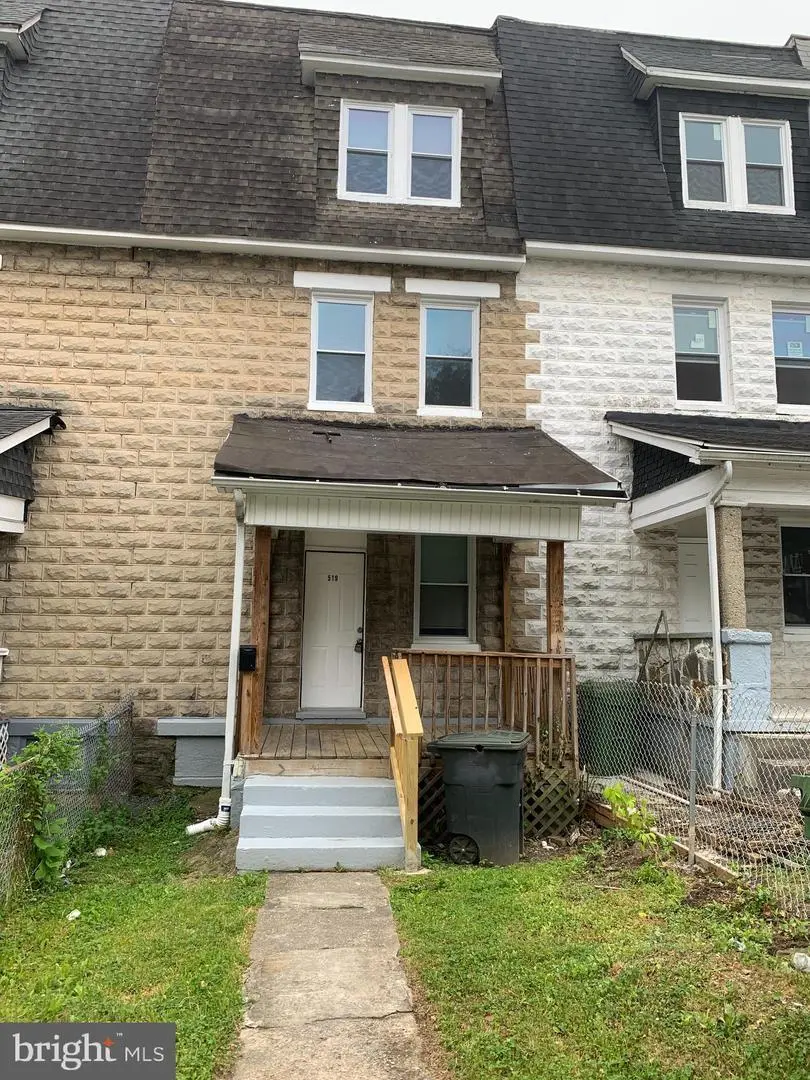
519 Beaumont Ave · Baltimore, MD
Flood risk 5/10 · Moderate
- FEMA flood zone
- X (unshaded)
- Chance of flooding over 30 yrs
- 0.27%
- Est. flood insurance / yr
- $473 – $860
Fire risk 1/10 · Minimal
- Est. fire insurance / yr
- $755 – $1,403
Heat risk 6/10 · Moderate
- Hot days now (above 103°F)
- 7 days/yr
- Hot days in 30 yrs
- 14 days/yr
Wind risk 6/10 · Moderate
- Chance of severe wind over 30 yrs
- 27.0%
Air-quality risk 4/10 · Minor
- Unhealthy air days now
- 3 days/yr
- Unhealthy air days in 30 yrs
- 6 days/yr
Risk factors via First Street. Map © Google.
Why this score? — see what drove the B grade
The composite is a weighted blend of 9 inputs, each scored 0–100. Each bar is that input's sub-score; the figure is the points it added to the 100-point composite (weight × sub-score).
- Cash flow +28.7/30.0
- ARV discount +15.0/15.0
- DSCR +10.0/10.0
- 1% rule +7.3/10.0
- Livability +3.8/5.0
- Rent growth +3.7/5.0
- Condition / age +2.5/5.0
- Schools +1.0/10.0
- Appreciation +0.0/10.0
$179,900
🖨 Deal sheet 📄 Offer letter ✓ Due diligence
Listing remarks MLS
This spacious 4 bedroom, 4 level interior townhouse is priced to sell. Gas radiator heat. 100 amp electric panel. Kitchen with oak cabinets. Front and back porches. Most galvanized plumbing has been replaced. Open, unfinished lower level. Skylight at stairway ceiling. Needs some work and priced to sell. As-is, cash offers with quick close are preferred. Easy to show. Owner is a licensee.
Key facts
- Granite countertops
- Fenced front yard
- Built-in microwave
Tags
Property features AI
Finance
- Other: Total below-grade area: 528 (source: assessor); Above-grade finished area: 1,584 (source: assessor); Unfinished below-grade area: 528 (source: assessor); Pets allowed with no restrictions
- Financial info: Ground rent paid annually
Exterior
- Parking: On-street parking
- Utilities: Public water; Public sewer; Electric cooling fuel; Natural gas heating and hot water
- Home design: Interior townhouse / rowhouse; Fee simple ownership; Property in very good condition
- Construction: Brick construction; Brick/mortar foundation; Built year sourced from assessor
- Exterior features: Porch(es); Partially fenced; Not in a federal flood zone; Above-grade and below-grade structures
Interior
- Kitchen: Kitchen (appliances not specified)
- Bedrooms: Two bedrooms on the first upper level; Two bedrooms on the second upper level; Bedroom 1; Bedroom 2; Bedroom 3; Bedroom 4
- Flooring: Wood flooring
- Bathrooms: Two full bathrooms (one on main level, one on upper levels)
- Heating & cooling: Forced air heating (natural gas); Central air conditioning (electric); Natural gas hot water
- Interior features: Wood flooring; Basement with connecting stairway and rear entrance; Living Room; Dining Room; Kitchen
Neighborhood map
What this means for you Summary
Snapshot
- This is a 4-bed/1.0-bath townhouse listed at $180k.
Deal economics
- At list price, monthly cash flow is $599 ($7k/yr) — positive.
- The deal already cash-flows at list — no discount required.
- Meets the 1% rule at list price ($2k rent vs $180k).
- Cap rate 10.3% vs local median 6.0% in Baltimore — top-decile yield for the area; either an underpriced asset or a hidden risk that comps aren't pricing in. Stress-test before assuming the spread holds.
Location & tenants
- Location reads 76/100 on livability (#90 in MD, #3,396 nationally) — a middle-class / working-renter tenant base. Strengths: amenities A+, commute A+, housing A+; Watch: schools D, crime F.
- Baltimore City Public Schools (urban): math 7% / reading 16% proficiency, ranked #24 of 24 in MD (top 100%) — low school quality limits family demand, transient renter base, plan for 1-2y turnover; 79% free/reduced lunch — lower-income household profile, screen leases tightly.
- Market conditions: Rents rising fast (+4.7%/yr); 133 active listings in the ZIP; 40 comparable units currently listed for rent nearby; rentals at typical pace (median 24d on market — plan ~3-4 weeks tenant-placement turnaround); solid renter incomes; 1,273 units permitted in Baltimore city in 2024 (1,104 in 5+ unit buildings).
Forward outlook
- Local home prices are declining (-3.0%/yr); year-one equity from $1k of loan paydown is wiped out by about $5k of value loss. Plan a longer hold.
- Baltimore County population projected to shrink 4% by 2050 — rents likely to lag national; underwrite the cash flow, not the appreciation.
- At projected returns (-3.0% appreciation + 4.7% rent growth), your $50k cash investment doubles in ~8 years — after that, you're playing with house money.
Negotiation context
- Only 1 days on market — expect competitive offers; lowballing is unlikely to land.
- 3 sale attempts since 13y ago with the ask held roughly flat each time — persistent listings suggest the price (not the market) is what's stuck; bring a comps-based counter.
- Current owner paid $26k; list at $180k implies a 592% gain — meaningful room to come down on a strong offer.
Risks & watch-outs
- Watch-outs: built in 1930 — expect roof / HVAC / electrical / plumbing capex.
- Climate carrying-cost: moderate flood risk; major wind risk, 27% chance of damaging wind over 30y; extreme-heat days projected 7→14/yr by 2055 (HVAC capex compounding) — expect insurance premiums to compound above CPI over the hold.
Questions for the listing agent
- Built in 1930 — when were the roof, HVAC, electrical panel, plumbing, and water heater last replaced?
- Is there a deadline driving the sale (1031 exchange, divorce, estate, relocation)? That informs how much negotiation room exists.
- Schools are D-rated, which usually means shorter tenancies and higher turnover. Who's the typical renter profile here, and what's been the actual vacancy rate?
- Crime grade is F in this area — have there been break-ins, vandalism, or insurance claims at this property in the last 3 years? What carrier currently insures it and at what premium?
- What's the average days-on-market for RENTAL listings here right now (not sales)? A rising rental-DOM trend means longer vacancies and softer asking-rent achievability than the comps imply.
- What's the recent tenant-quality profile in this submarket — average credit score on applications, eviction rate, late-payment / NSF rate, and stable-employment percentage? A property-management company in the area should have these aggregated.
- How much new for-sale + rental construction is in the pipeline within 1–3 miles? Heavy new supply typically softens prices + rents 12–24 months out; constrained supply supports both.
Investment metrics
- 1% rule
- 1.23% ✓
- Cap rate
- 10.29%
- Cash-on-cash
- 14.27%
- DSCR
- 1.63
- GRM
- 6.8
CMA / ARV
- ARV (on-the-fly)
- $228,096
- Comps found
- 12
Show comp detail 12 sales within ~0.75 mi
| Address | Dist | Beds/Ba | Sqft | Sold | Price | $/sf | Match |
|---|---|---|---|---|---|---|---|
| 715 Radnor Ave | 0.32mi | 4/2.0 | 1,600 (+1%) | 2mo | $249,900 | $156 | 78 |
| 804 Mccabe Ave | 0.18mi | 3/2.5 (-1) | 1,620 (+2%) | 1mo | $199,900 | $123 | 76 |
| 308 Woodbourne Ave | 0.33mi | 3/2.0 (-1) | 1,565 (-1%) | 1mo | $431,000 | $275 | 73 |
| 5606 Clearspring Rd | 0.49mi | 3/1.5 (-1) | 1,554 (-2%) | 2mo | $140,000 | $90 | 66 |
| 4662 Kernwood Ave | 0.42mi | 3/1.5 (-1) | 1,652 (+4%) | 1mo | $240,000 | $145 | 66 |
| 5019 Midwood Ave | 0.28mi | 3/2.0 (-1) | 1,455 (-8%) | 2mo | $198,000 | $136 | 63 |
| 617 Willow Ave | 0.50mi | 3/2.0 (-1) | 1,641 (+4%) | 2mo | $235,000 | $143 | 60 |
| 854 Bradhurst Rd | 0.60mi | 4/2.5 | 1,516 (-4%) | 0mo | $275,000 | $181 | 58 |
| 5607 Ready Ave | 0.47mi | 3/2.0 (-1) | 1,486 (-6%) | 2mo | $240,000 | $162 | 57 |
| 4744 Alhambra Ave | 0.38mi | 3/1.5 (-1) | 1,816 (+15%) | 2mo | $155,000 | $85 | 50 |
| 830 Saint Dunstans Rd | 0.68mi | 3/1.0 (-1) | 1,394 (-12%) | 1mo | $161,000 | $115 | 42 |
| 1200 Woodbourne Ave | 0.57mi | 4/3.0 | 1,364 (-14%) | 2mo | $196,100 | $144 | 41 |
Match score weights: distance 35% · size 25% · config 20% · recency 20%. Top-matched comps best support the ARV.
Projected returns pro-forma
-3.0% appreciation · 4.65% rent growth · sell at horizon
- IRR
- 6.4%
- Equity multiple
- 1.25×
- Total profit
- $12,727
- Equity at exit
- $26,824
- IRR
- 17.1%
- Equity multiple
- 2.51×
- Total profit
- $76,030
- Equity at exit
- $15,554
Cash invested: $50,372 (down + closing). Projections, not guarantees.
Landlord ↔ Tenant lean methodology
- Overall (CITY)
- 12 Strongly Tenant-Friendly
- State Maryland
- 27 Tenant-Leaning · D+14
- County
- — inherits STATE
- City Baltimore
- 12 Strongly Tenant-Friendly · D+58
ZIP-level market 21212
- Rents YoY
- 4.7%
- Active inventory
- 133
- Price-to-rent
- 6.8×
Monthly cashflow live
- Estimated rent
- $2,221 high interval (Pro) →
- Mortgage (P&I)
- −$943
- Tax from tax record
- −$137 /mo · $1,643/yr
- Insurance
- −$75
- HOA
- −$0
- Vacancy / Maint / Mgmt
- −$466
- Net cashflow
- $599
Break-even live
UW: 25.0% down · 7.5% · 30yr · 1.5% tax · 5.0% vac · 8.0% maint · 8.0% mgmt
Financing live
Cash to close
- Down payment
- $44,975
- Closing costs
- $5,397
- Reserves months
- —
- Total cash needed
- —
Loan-product check · same deal, 3 products live
Conventional
25% down · 7.5% · 30yr
- Down + closing
- —
- Monthly P&I
- —
- Monthly cashflow
- —
- DSCR
- —
- Eligible?
- —
Personal DTI + credit; lowest rate.
DSCR
20% down · 8.5% · 30yr
- Down + closing
- —
- Monthly P&I
- —
- Monthly cashflow
- —
- DSCR
- —
- Eligible?
- —
No personal income docs; deal must DSCR.
Hard money
10% down · 12.0% · 12mo
- Down + closing
- —
- Monthly P&I
- —
- Monthly cashflow
- —
- DSCR
- —
- Eligible?
- —
Short-term bridge; refi at stabilization.
Rent comps 40 comps
| Address | Beds | Baths | Sqft | Rent | $/sqft | DOM | Units | Dist |
|---|---|---|---|---|---|---|---|---|
| 543 Chateau Ave Baltimore, MD | 3.0 | 2.0 | 1152 | $1,900 | $1.65 | 4d | 1 | 0.03mi |
| 510 Winston Ave Baltimore, MD | 4.0 | 2.0 | 1600 | $2,800 | $1.75 | 20d | 1 | 0.07mi |
| 711 1/2 McCabe Ave Baltimore, MD | 4.0 | 3.0 | 1204 | $2,350 | $1.95 | 4d | 1 | 0.11mi |
| 5001 Govane Ave Baltimore, MD | 5.0 | 2.5 | 1200 | $1,800 | $1.50 | 24d | 1 | 0.11mi |
| 5200 Ready Ave Baltimore, MD | 3.0 | 1.5 | 1116 | $1,950 | $1.75 | 3d | 1 | 0.15mi |
| 514 Radnor Ave Baltimore, MD | 3.0 | 1.5 | 1575 | $1,500 | $0.95 | 44d | 1 | 0.21mi |
| 804 Radnor Ave Baltimore, MD | 3.0 | 1.0 | 1654 | $2,000 | $1.21 | 44d | 1 | 0.31mi |
| 4754 Alhambra Ave Baltimore, MD | 3.0 | 2.0 | 1876 | $1,500 | $0.80 | 24d | 1 | 0.32mi |
| 531 Willow Ave Unit Na Baltimore, MD | 4.0 | 1.0 | 1300 | $1,800 | $1.38 | 20d | 1 | 0.43mi |
| 4407 Old York Rd Baltimore, MD | 3.0 | 1.5 | 1356 | $1,574 | $1.16 | 44d | 1 | 0.50mi |
| 4407 Old York Rd Baltimore, MD | 3.0 | 1.5 | 1356 | $1,574 | $1.16 | 20d | 1 | 0.50mi |
| 1008 Tunbridge Rd Baltimore, MD | 3.0 | 2.0 | 1732 | $2,050 | $1.18 | 24d | 1 | 0.55mi |
| 1224 Winston Ave Baltimore, MD | 3.0 | 2.0 | 1248 | $2,100 | $1.68 | 18d | 1 | 0.56mi |
| 1221 Glenwood Ave Baltimore, MD | 3.0 | 2.0 | 1390 | $2,595 | $1.87 | 44d | 1 | 0.57mi |
| 706 E 43rd St Baltimore, MD | 4.0 | 1.5 | 1596 | $1,899 | $1.19 | 2d | 1 | 0.62mi |
| 5622 Midwood Ave Baltimore, MD | 3.0 | 2.0 | 1452 | $2,300 | $1.58 | 44d | 1 | 0.62mi |
| 720 Springfield Ave Baltimore, MD | 3.0 | 1.0 | 1160 | $2,000 | $1.72 | 44d | 1 | 0.67mi |
| 828 Saint Dunstans Rd Baltimore, MD | 3.0 | 2.0 | 1544 | $2,000 | $1.30 | 24d | 1 | 0.71mi |
| 5204 Kelway Rd Baltimore, MD | 3.0 | 2.0 | 1666 | $2,350 | $1.41 | 24d | 1 | 0.74mi |
| 513 E 41st St Baltimore, MD | 4.0 | 1.5 | 1620 | $1,900 | $1.17 | 44d | 1 | 0.81mi |
| 917 Reverdy Rd Unit A Baltimore, MD | 3.0 | 1.0 | 1200 | $2,100 | $1.75 | 44d | 1 | 0.88mi |
| 5520 Sagra Rd Baltimore, MD | 3.0 | 1.5 | 1650 | $1,900 | $1.15 | 44d | 1 | 0.89mi |
| 1545 E Cold Spring Ln Baltimore, MD | 4.0 | 2.0 | 1240 | $2,000 | $1.61 | 44d | 1 | 1.04mi |
| 6008 Clearspring Rd Baltimore, MD | 4.0 | 2.5 | 1758 | $3,600 | $2.05 | 24d | 1 | 1.07mi |
| 1020 Dartmouth Glen Way Baltimore, MD | 3.0 | 2.5 | 1152 | $2,250 | $1.95 | 24d | 1 | 1.09mi |
| 3721 Ellerslie Ave Baltimore, MD | 1.0–3.0 | 1.0–2.0 | 894 | $1,603 | $1.79 | 2d | 1 | 1.12mi |
| 4006 Loch Raven Blvd Baltimore, MD | 3.0 | 2.5 | 2016 | $2,695 | $1.34 | 18d | 1 | 1.13mi |
| 506 Cedarcroft Rd Baltimore, MD | 5.0 | 3.0 | 1695 | $3,100 | $1.83 | 11d | 1 | 1.17mi |
| 1539 Ralworth Rd Baltimore, MD | 3.0 | 2.0 | 1580 | $1,950 | $1.23 | 15d | 1 | 1.20mi |
| 1617 Argonne Dr Baltimore, MD | 4.0 | 2.0 | 1200 | $2,550 | $2.12 | 44d | 1 | 1.20mi |
| 100 E Melrose Ave Baltimore, MD | 2.0–3.0 | 2.0–2.5 | 1750 | $3,345 | $1.91 | 4d | 2 | 1.28mi |
| 500 W University Pkwy Baltimore, MD | 3.0 | 1.0–2.0 | 955 | $3,020 | $3.16 | 2d | 60 | 1.29mi |
| 6159 Parkway Dr Apt 1 Baltimore, MD | 4.0 | 2.0 | 1408 | $2,200 | $1.56 | 24d | 1 | 1.31mi |
| 6159 Parkway Dr Baltimore, MD | 4.0 | 2.0 | 1408 | $2,200 | $1.56 | 22d | 1 | 1.31mi |
| 3529 Greenmount Ave Baltimore, MD | 3.0 | 2.0 | 1316 | $1,575 | $1.20 | 44d | 1 | 1.34mi |
| 1804 Winford Rd Baltimore, MD | 3.0 | 1.5 | 1600 | $2,100 | $1.31 | 24d | 1 | 1.36mi |
| 6189 Northwood Dr Baltimore, MD | 4.0 | 2.0 | 1400 | $2,200 | $1.57 | 44d | 1 | 1.38mi |
| 6149 Dunroming Rd Baltimore, MD | 3.0 | 1.5 | 1400 | $1,895 | $1.35 | 11d | 1 | 1.40mi |
| 724 E 35th St Baltimore, MD | 3.0 | 1.5 | 1368 | $2,000 | $1.46 | 15d | 1 | 1.40mi |
| 1508 Gleneagle Rd Baltimore, MD | 3.0 | 2.0 | 1824 | $2,180 | $1.20 | 4d | 1 | 1.41mi |
Listing history 2 events
-
2026-06-18remarks 687-char remark
-
2026-06-18$179,900 Active 1 DOM
ⓘ Source: listings_history table (triggers on properties + properties_extension) + one-shot
backfill from property_details.listing_events for pre-trigger history.
Tax reassessment forecast MD · Partial reset (capped growth)
- Current annual tax
- $1,643 · $137/mo
- Projected year-2 tax
- $1,802 · $150/mo
- Expected delta
- +$159/yr (+$13/mo · 9.7%)
ⓘ Screening estimate from a state-policy table — verify with the county assessor before closing.
Climate risk First Street
- Flood 5/10 Major FEMA zone X (unshaded) · 27% chance over 30 yrs
- Wildfire 1/10 Low
- Heat 6/10 Major 7 d/yr ≥103°F today · 14 d/yr by 30 yrs out
- Wind 6/10 Major 27% chance of damaging wind over 30 yrs
- Air quality 4/10 Moderate 3 unhealthy d/yr today · 6 by 30 yrs out
Nearby sold comps map
Loading sold comps map…
Walkable amenities ~0.75 mi
Loading nearby amenities…
Taxation est. · year 1
- Rental income
- $26,648
- − Mortgage interest
- −$10,077
- − Property taxes
- −$1,643
- − Insurance
- −$900
- − Repairs & maintenance
- −$2,132
- − Management
- −$2,132
- − Depreciation
- −$5,233
- Taxable income
- $4,531
- Est. tax owed @ 24.0%
- −$1,087
- After-tax cash flow
- $6,101/yr
For passive investors: Depreciation is non-cash, so a rental often shows a tax loss while cash-flowing — sheltering income. Rental losses are passive: they offset passive income freely, and up to $25,000/yr can offset ordinary (W-2) income if you actively participate and your MAGI is under $100k (phasing out to $0 by $150k); unused losses carry forward. On sale, claimed depreciation is recaptured at up to 25%, and gains may owe capital-gains tax (a 1031 exchange can defer both). Figures are a year-1 estimate at your 24.0% rate — not tax advice; consult a CPA.
Schools (NCES district)
- District
- Baltimore City Public Schools
- NCES district ID
- 2400090
- Math proficiency
- 7% ▼ -9.00%
- Reading proficiency
- 16% ▼ -5.00%
- Median HH income
- $42,108
- Composite
- 10.08/100
- National rank
- #9805
- State rank
- #24 of 24 in MD
Livability — Baltimore
- Score
- 76/100
- State rank
- #90
- US rank
- #3396
Category grades
Schools grade is shown separately in the Schools card above.
Census & demographics
- Census place
- Baltimore, MD
- County
- Baltimore City · 558,601 people
- City population
- 588,727
- Metro
- Baltimore-Columbia-Towson, MD
- Population (ZIP)
- 33,974
- Household income
- $96,685
- Rent vs Own
- Severe rent burden
- 769.0
Population outlook (Baltimore County) Hauer SSP2
- Today (2025)
- 624,249 people
- By 2030
- 621,541 · -0.4%
- By 2040
- 609,756 · -2.3%
- By 2050
- 597,249 · -4.3%
- By 2075
- 552,236 · -11.5%
- By 2100
- 513,934 · -17.7%
Race, ethnicity, and origin ACS 2023
- Neighborhood character
- Diverse neighborhood (Simpson 0.64)
- Race & ethnicity
- White 49% Black 35% Two or more races 9% Hispanic / Latino 7% Asian 4%
- Hispanic origin (detail)
- Mexican 1% Puerto Rican 1%
- Common ancestry
- Romanian 3% Italian 2% Slovak 2%
- Foreign-born
- 9% · Canada, China
- Languages at home
- 87% English-only · Spanish 5% Other Indo-European 2% French/Haitian/Cajun 1%
Political lean MEDSL · Baltimore
- 2024 margin
- Solid D (+73.0) · D 85.2% · R 12.2% · Other 2.6%
- 2008→2024 swing
- -2.5pp toward R · 2008: 75.5pp · 2024: 73.0pp
- All cycles
- 2024: D+73.0 2020: D+76.6 2016: D+74.6 2012: D+76.4 2008: D+75.5
Not yet ingested
- Civics
- —
Market trends
- HPI YoY
- ▼ -392.44%
- Current HPI
- 267.4569
- Rent YoY
- ▲ 4.65%
- Metro
- Baltimore-Columbia-Towson, MD
- State GDP YoY
- ▲ 2.97%
- F500 in state
- 12
Industry mix (Fortune 500 HQ in MD)
| Industry | F500 HQs | Revenue |
|---|---|---|
| Aerospace / Defense | 1 | $71B |
|
||
| Utilities | 1 | $25B |
|
||
| Hotels | 1 | $24B |
|
||
| Consumer Goods | 1 | $7B |
|
||
| Real Estate | 1 | $6B |
|
||
| Chemicals | 1 | $2B |
|
||
Price history
+501.7% since first listed9 events — show timeline
- 2026-06-18 Listed $179,900 BRIGHT MLS
- 2014-03-05 Delisted — MRIS
- 2014-03-05 Sold (MLS) $26,000 BRIGHT MLS
- 2014-03-05 Sold (MLS) $26,000 MRIS
- 2014-02-26 Pending — MRIS
- 2014-01-29 Listing Removed — BRIGHT MLS
- 2014-01-27 Price Changed $29,900 MRIS
- 2013-10-31 Listed $39,900 MRIS
- 2013-10-31 Listed $29,900 BRIGHT MLS
Property tax history
-1.4%/yrLatest (2025): $1,643 · +34.6% YoY. Source: county tax records.
Cash-flow waterfall
monthlySold comps — $/sqft
last 12 mo · ≤1 miLoading sold comps…