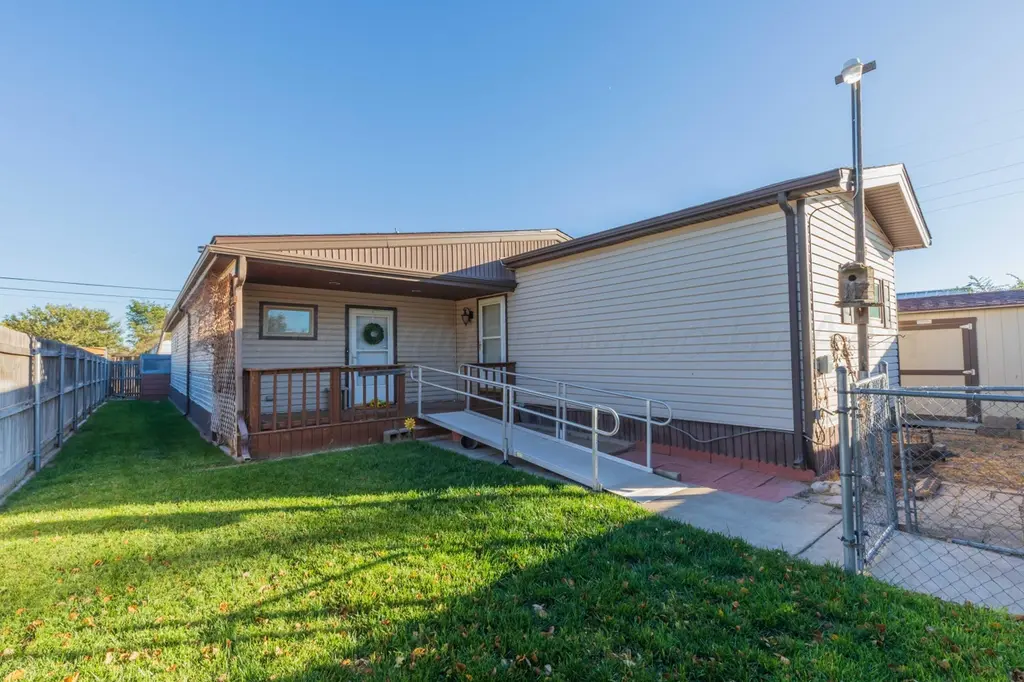
2117 Eagle Ln · Amarillo, TX
Flood risk 3/10 · Minor
- FEMA flood zone
- X (unshaded)
- Chance of flooding over 30 yrs
- 0.2%
- Est. flood insurance / yr
- $507 – $1,088
Fire risk 10/10 · Severe
- Est. fire insurance / yr
- $1,222 – $2,270
Heat risk 5/10 · Moderate
- Hot days now (above 97°F)
- 7 days/yr
- Hot days in 30 yrs
- 20 days/yr
Wind risk 2/10 · Minimal
- Chance of severe wind over 30 yrs
- —
Air-quality risk 2/10 · Minimal
- Unhealthy air days now
- 1 days/yr
- Unhealthy air days in 30 yrs
- 1 days/yr
Risk factors via First Street. Map © Google.
Why this score? — see what drove the B- grade
The composite is a weighted blend of 9 inputs, each scored 0–100. Each bar is that input's sub-score; the figure is the points it added to the 100-point composite (weight × sub-score).
- Cash flow +27.0/30.0
- ARV discount +12.8/15.0
- DSCR +9.4/10.0
- 1% rule +7.3/10.0
- Rent growth +3.9/5.0
- Schools +3.6/10.0
- Livability +3.3/5.0
- Condition / age +2.5/5.0
- Appreciation +0.0/10.0
$159,900
🖨 Deal sheet 📄 Offer letter ✓ Due diligence
Listing remarks MLS
MOTIVATED SELLER! 3 Bedroom, 3 Bath Home in Windmill Acres has 2 Primary Bedroom En Suites, has been well-maintained, including a new gas line and brand new Roof! Handicapped accessible! 2 Large Living Areas complete with Fireplace to stay cozy this winter! Cute Kitchen with gas stovetop, double oven, lots of cabinets, coffee bar & large Dining Room! The 2 Main Bedroom En-Suites each have walk-in showers! 3rd Bedroom is nice size & full bath in hallway. Large covered front porch deck, nice, metal handicapped ramp! Low maintenance with very nice Siding & Gutters! Beautiful well-manicured lawn! Completely fenced property for privacy! Storage Bldgs & Storm Shelter! Seller said they have the best neighbors who look out for each other! Call Today to see this Sweet Home!
Key facts
- 2 large living areas
- Gas stovetop
- New roof
Tags
Neighborhood map
What this means for you Summary
Snapshot
- This is a 3-bed/3.0-bath manufactured listed at $160k.
Deal economics
- At list price, monthly cash flow is $450 ($5k/yr) — positive.
- The deal already cash-flows at list — no discount required.
- Meets the 1% rule at list price ($2k rent vs $160k).
- Recommended offer: $141k (12.0% below list) — sets the bar for market timing.
Location & tenants
- Location reads 66/100 on livability (#624 in TX) — a middle-class / working-renter tenant base. Strengths: cost of living A+, housing A+; Watch: amenities C-, schools D, crime F.
- Amarillo ISD (urban): math 44% / reading 41% proficiency, ranked #336 of 826 in TX (top 41%) — families likely to look elsewhere, expect single-tenant / working-renter base with shorter leases.
- Market conditions: Rents rising fast (+5.5%/yr); 276 active listings in the ZIP; 3 comparable units currently listed for rent nearby; rentals at typical pace (median 21d on market — plan ~3-4 weeks tenant-placement turnaround); solid renter incomes; 45 units permitted in Randall County in 2024 (0 in 5+ unit buildings).
Forward outlook
- Local home prices are declining (-3.0%/yr); year-one equity from $1k of loan paydown is wiped out by about $5k of value loss. Plan a longer hold.
- Randall County population projected at +36% by 2050 — long-run rental-demand tailwind backs the buy-and-hold thesis.
- At projected returns (-3.0% appreciation + 5.5% rent growth), your $45k cash investment doubles in ~8 years — after that, you're playing with house money.
Negotiation context
- It's been on market 240 days — a 12% lower offer ($141k) is reasonable based on typical stale-listing flexibility.
Risks & watch-outs
- Climate carrying-cost: severe wildfire risk; extreme-heat days projected 7→20/yr by 2055 (HVAC capex compounding) — expect insurance premiums to compound above CPI over the hold.
Questions for the listing agent
- It's been on market 240 days. Have you received any prior offers? Is the seller open to a 12% concession, seller financing, or rate buy-down credit?
- Why hasn't it sold? Are there any deal-killer items the seller is aware of (foundation, flood, title, zoning, code violations)?
- Is there a deadline driving the sale (1031 exchange, divorce, estate, relocation)? That informs how much negotiation room exists.
- Schools are D-rated, which usually means shorter tenancies and higher turnover. Who's the typical renter profile here, and what's been the actual vacancy rate?
- Crime grade is F in this area — have there been break-ins, vandalism, or insurance claims at this property in the last 3 years? What carrier currently insures it and at what premium?
- What's the average days-on-market for RENTAL listings here right now (not sales)? A rising rental-DOM trend means longer vacancies and softer asking-rent achievability than the comps imply.
- What's the recent tenant-quality profile in this submarket — average credit score on applications, eviction rate, late-payment / NSF rate, and stable-employment percentage? A property-management company in the area should have these aggregated.
- How much new for-sale + rental construction is in the pipeline within 1–3 miles? Heavy new supply typically softens prices + rents 12–24 months out; constrained supply supports both.
Investment metrics
- 1% rule
- 1.23% ✓
- Cap rate
- 9.67%
- Cash-on-cash
- 12.05%
- DSCR
- 1.54
- GRM
- 6.8
CMA / ARV
- ARV (median comp)
- $181,436
- List price
- $159,900
- Delta
- -11.87%
- Verdict
- UNDERPRICED
- Comps
- 3 within 2.0 mi
Projected returns pro-forma
-3.0% appreciation · 5.52% rent growth · sell at horizon
- IRR
- 4.4%
- Equity multiple
- 1.18×
- Total profit
- $7,869
- Equity at exit
- $23,842
- IRR
- 16.1%
- Equity multiple
- 2.47×
- Total profit
- $65,948
- Equity at exit
- $13,825
Cash invested: $44,772 (down + closing). Projections, not guarantees.
Landlord ↔ Tenant lean methodology
- Overall (STATE)
- 87 Strongly Landlord-Friendly
- State Texas
- 87 Strongly Landlord-Friendly · R+5
- County
- — inherits STATE
- City
- — inherits STATE
ZIP-level market 79118
- Rents YoY
- 5.5%
- Active inventory
- 276
- Price-to-rent
- 6.8×
Monthly cashflow live
- Estimated rent
- $1,968 medium interval (Pro) →
- Mortgage (P&I)
- −$839
- Tax est. 1.5%
- −$200 /mo · $2,398/yr
- Insurance
- −$67
- HOA
- −$0
- Vacancy / Maint / Mgmt
- −$413
- Net cashflow
- $450
Break-even live
UW: 25.0% down · 7.5% · 30yr · 1.5% tax · 5.0% vac · 8.0% maint · 8.0% mgmt
Financing live
Cash to close
- Down payment
- $39,975
- Closing costs
- $4,797
- Reserves months
- —
- Total cash needed
- —
Loan-product check · same deal, 3 products live
Conventional
25% down · 7.5% · 30yr
- Down + closing
- —
- Monthly P&I
- —
- Monthly cashflow
- —
- DSCR
- —
- Eligible?
- —
Personal DTI + credit; lowest rate.
DSCR
20% down · 8.5% · 30yr
- Down + closing
- —
- Monthly P&I
- —
- Monthly cashflow
- —
- DSCR
- —
- Eligible?
- —
No personal income docs; deal must DSCR.
Hard money
10% down · 12.0% · 12mo
- Down + closing
- —
- Monthly P&I
- —
- Monthly cashflow
- —
- DSCR
- —
- Eligible?
- —
Short-term bridge; refi at stabilization.
Rent comps 3 comps
| Address | Beds | Baths | Sqft | Rent | $/sqft | DOM | Units | Dist |
|---|---|---|---|---|---|---|---|---|
| 4418 Ross St Amarillo, TX | 3.0 | 2.0 | 1388 | $1,750 | $1.26 | 21d | 1 | 0.42mi |
| 608 Lochridge Amarillo, TX | 3.0 | 2.0 | 1455 | $1,900 | $1.31 | 43d | 1 | 1.09mi |
| 307 Mikeska St Amarillo, TX | 3.0 | 2.0 | 1250 | $1,800 | $1.44 | 21d | 1 | 1.31mi |
Listing history 19 events
-
2026-06-18days on market $159,900 Active 240 DOM
-
2026-06-17days on market $159,900 Active 239 DOM
-
2026-06-16days on market $159,900 Active 238 DOM
-
2026-06-15days on market $159,900 Active 237 DOM
-
2026-06-14days on market $159,900 Active 235 DOM
-
2026-06-13days on market $159,900 Active 234 DOM
-
2026-06-10days on market $159,900 Active 232 DOM
-
2026-06-09days on market $159,900 Active 231 DOM
-
2026-06-08days on market $159,900 Active 230 DOM
-
2026-06-07days on market $159,900 Active 229 DOM
-
2026-06-03days on market $159,900 Active 225 DOM
-
2026-06-02days on market $159,900 Active 224 DOM
-
2026-06-01days on market $159,900 Active 223 DOM
-
2026-05-31days on market $159,900 Active 222 DOM
-
2026-05-30days on market $159,900 Active 221 DOM
-
2025-10-22$159,900 Active 802-char remark
Show marketing remark (802 chars)
MOTIVATED SELLER! 3 Bedroom, 3 Bath Home in Windmill Acres has 2 Primary Bedroom En Suites, has been well-maintained, including a new gas line and brand new Roof! Handicapped accessible! 2 Large Living Areas complete with Fireplace to stay cozy this winter! Cute Kitchen with gas stovetop, double oven, lots of cabinets, coffee bar & large Dining Room! The 2 Main Bedroom En-Suites each have walk-in showers! 3rd Bedroom is nice size & full bath in hallway. Large covered front porch deck, nice, metal handicapped ramp! Low maintenance with very nice Siding & Gutters! Beautiful well-manicured lawn! Completely fenced property for privacy! Storage Bldgs & Storm Shelter! Seller said they have the best neighbors who look out for each other! Call Today to see this Sweet Home!
-
2025-10-04price $165,000
-
2025-08-19price $174,900
-
2025-02-24price $179,900
ⓘ Source: listings_history table (triggers on properties + properties_extension) + one-shot
backfill from property_details.listing_events for pre-trigger history.
Climate risk First Street
- Flood 3/10 Moderate FEMA zone X (unshaded) · 20% chance over 30 yrs
- Wildfire 10/10 Extreme
- Heat 5/10 Major 7 d/yr ≥97°F today · 20 d/yr by 30 yrs out
- Wind 2/10 Low
- Air quality 2/10 Low 1 unhealthy d/yr today · 1 by 30 yrs out
Nearby sold comps map
Loading sold comps map…
Walkable amenities ~0.75 mi
Loading nearby amenities…
Taxation est. · year 1
- Rental income
- $23,615
- − Mortgage interest
- −$8,957
- − Property taxes
- −$2,398
- − Insurance
- −$800
- − Repairs & maintenance
- −$1,889
- − Management
- −$1,889
- − Depreciation
- −$4,652
- Taxable income
- $3,030
- Est. tax owed @ 24.0%
- −$727
- After-tax cash flow
- $4,668/yr
For passive investors: Depreciation is non-cash, so a rental often shows a tax loss while cash-flowing — sheltering income. Rental losses are passive: they offset passive income freely, and up to $25,000/yr can offset ordinary (W-2) income if you actively participate and your MAGI is under $100k (phasing out to $0 by $150k); unused losses carry forward. On sale, claimed depreciation is recaptured at up to 25%, and gains may owe capital-gains tax (a 1031 exchange can defer both). Figures are a year-1 estimate at your 24.0% rate — not tax advice; consult a CPA.
Schools (NCES district)
- District
- Amarillo ISD
- NCES district ID
- 4808130
- Math proficiency
- 44% ▼ -9.00%
- Reading proficiency
- 41% ▼ -3.00%
- Median HH income
- $43,478
- Composite
- 35.96/100
- National rank
- #4798
- State rank
- #336 of 826 in TX
Livability — Amarillo
- Score
- 66/100
- State rank
- #624
- US rank
- #11876
Category grades
Schools grade is shown separately in the Schools card above.
Census & demographics
- Census place
- Amarillo, TX
- County
- Randall County · 137,351 people
- City population
- 185,802
- Metro
- Amarillo, TX
- Population (ZIP)
- 28,107
- Household income
- $87,810
- Rent vs Own
- Severe rent burden
- 367.0
Population outlook (Randall County) Hauer SSP2
- Today (2025)
- 152,140 people
- By 2030
- 163,107 · +7.2%
- By 2040
- 184,999 · +21.6%
- By 2050
- 206,948 · +36.0%
- By 2075
- 260,204 · +71.0%
- By 2100
- 294,980 · +93.9%
Race, ethnicity, and origin ACS 2023
- Neighborhood character
- Majority White (57%)
- Race & ethnicity
- White 57% Hispanic / Latino 35% Two or more races 18% Black 2% Asian 2% Native American 1%
- Hispanic origin (detail)
- Mexican 31%
- Common ancestry
- Lithuanian 2% Italian 2% Slovak 2%
- Foreign-born
- 6% · Canada, Vietnam
- Languages at home
- 84% English-only · Spanish 14% Vietnamese 1% French/Haitian/Cajun 1%
Political lean MEDSL · Randall
- 2024 margin
- Solid R (+60.4) · D 19.4% · R 79.8%
- 2008→2024 swing
- +2.3pp toward D · 2008: -62.7pp · 2024: -60.4pp
- All cycles
- 2024: R+60.4 2020: R+58.8 2016: R+65.1 2012: R+68.2 2008: R+62.7
Not yet ingested
- Civics
- —
Market trends
- HPI YoY
- ▼ -111.59%
- Current HPI
- 162.5206
- Rent YoY
- ▲ 5.52%
- Metro
- Amarillo, TX
- State GDP YoY
- ▲ 3.95%
- F500 in state
- 110
Industry mix (Fortune 500 HQ in TX)
| Industry | F500 HQs | Revenue |
|---|---|---|
| Energy | 16 | $1,198B |
|
||
| Technology | 5 | $198B |
|
||
| Engineering / Construction | 4 | $72B |
|
||
| Energy Services | 3 | $60B |
|
||
| Utilities | 3 | $41B |
|
||
| Healthcare | 2 | $330B |
|
||
Price history
-11.1% since first listed4 events — show timeline
- 2025-10-22 Listed $159,900 AARMLS
- 2025-10-04 Price Changed $165,000 AARMLS
- 2025-08-19 Price Changed $174,900 AARMLS
- 2025-02-24 Price Changed $179,900 AARMLS
Property tax history
-6.3%/yrLatest (2025): $85 · +18.1% YoY. Source: county tax records.
Cash-flow waterfall
monthlySold comps — $/sqft
last 12 mo · ≤1 miLoading sold comps…