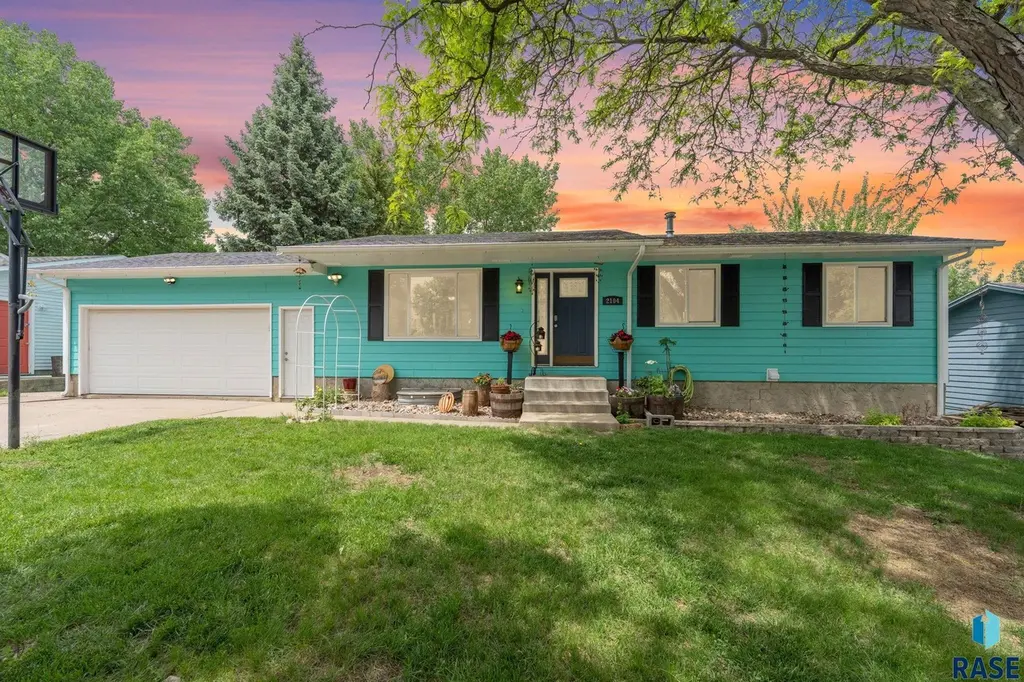
2104 E Tricia Ln Ln · Sioux Falls, SD
Flood risk 1/10 · Minimal
- FEMA flood zone
- X (unshaded)
- Chance of flooding over 30 yrs
- 0.0%
- Est. flood insurance / yr
- $473 – $860
Fire risk 5/10 · Moderate
- Est. fire insurance / yr
- $1,342 – $2,492
Heat risk 2/10 · Minimal
- Hot days now (above 99°F)
- 7 days/yr
- Hot days in 30 yrs
- 14 days/yr
Wind risk 2/10 · Minimal
- Chance of severe wind over 30 yrs
- —
Air-quality risk 2/10 · Minimal
- Unhealthy air days now
- 1 days/yr
- Unhealthy air days in 30 yrs
- 1 days/yr
Risk factors via First Street. Map © Google.
Why this score? — see what drove the F grade
The composite is a weighted blend of 9 inputs, each scored 0–100. Each bar is that input's sub-score; the figure is the points it added to the 100-point composite (weight × sub-score).
- Appreciation +5.0/10.0
- Cash flow +4.2/30.0
- Livability +4.2/5.0
- ARV discount +3.7/15.0
- Schools +3.7/10.0
- Rent growth +2.5/5.0
- Condition / age +2.5/5.0
- 1% rule +0.0/10.0
- DSCR +0.0/10.0
$345,000
🖨 Deal sheet 📄 Offer letter ✓ Due diligence
Listing remarks MLS
Looking For 3 Bedrooms On The Same Level? This 4 Bed, 2 Bath Ranch Home Has Just What You Are Looking For. Nice Layout With U-shaped Kitchen & Patio Doors Off Dining Room To The Deck. Walkout Ll With Family Room, Gas Fireplace & Bonus Room. New Furnace In 2004. Backyard Has Storage Shed & Nice Landscaping Throughout. Double Attached Garage.
Key facts
- Brand-new deck
- Great location
- 7,501 sq ft lot
Tags
Property features AI
Exterior
- Parking: Attached 2-car garage with concrete drive (21 x 22)
- Utilities: Public water; Public sewer
- Home design: Single-family ranch-style home; Above-grade and below-grade finished living areas; Other structures on lot
- Construction: Built with synthetic stucco and hard board; Block foundation; Composition roof
- Exterior features: Deck; Patio; Covered patio; Chain link fence; Shed(s); Walk-out lot
Interior
- Kitchen: New appliances; Electric range; Dishwasher; Garbage disposal; Refrigerator
- Bedrooms: Main-level bedroom: 12 x 11 with double closet; Main-level bedroom: 14 x 10 with double closet; Main-level bedroom: 12 x 10 with double closet; Lower-level master: 13 x 14 with walk-in closet
- Flooring: Carpet; Tile; Laminate
- Bathrooms: Main-level full bath; Lower-level 3/4 bath; One full bathroom and one 3/4 bathroom total
- Heating & cooling: Natural gas heating; Central air; Natural gas water heater
- Interior features: Basement is finished (full basement); Gas fireplace in the family room; Humidifier; 3+ bedrooms on the same level; Water softener stays
- Laundry & utility: Utility room in lower level
Neighborhood map
What this means for you Summary
Snapshot
- This is a 4-bed/3.0-bath single-family listed at $345k.
Deal economics
- At list price, monthly cash flow is $-929 ($-11k/yr) — negative.
- To cash-flow at today's rent, offer at most $181k (47.6% below list).
- To meet the 1% rule (rent ≥ 1% of price), the offer needs to be $165k (52.2% below list).
- Recommended offer: $165k (52.2% below list) — sets the bar for 1% rule.
Location & tenants
- Location reads 85/100 on livability (#3 in SD, #610 nationally) — a professional / high-income tenant draw. Strengths: amenities A+, commute A+, cost of living A+; Watch: crime F.
- Sioux Falls School District 49-5 (urban): math 39% / reading 48% proficiency, ranked #45 of 59 in SD (top 76%) — families likely to look elsewhere, expect single-tenant / working-renter base with shorter leases.
- Zoned schools: Terry Redlin Elementary - 11 (math 17% / reading 27%, grade F, #228 of 253 statewide, top 92%, 473 students, 77% FRL) — zoned schools average 77% FRL vs 36% district-wide (42 pts higher); higher-poverty schools than district average — tighter screening recommended.
- Zoned-school proficiency averages 22% at this address vs 44% district-wide (-22 pts) — the specific schools serving this property underperform the Sioux Falls School District 49-5 average; the district grade overstates school quality for this exact location.
- Market conditions: 1 active listings in the ZIP; 8 comparable units currently listed for rent nearby; rentals at typical pace (median 21d on market — plan ~3-4 weeks tenant-placement turnaround); 2,425 units permitted in Minnehaha County in 2024 (1,367 in 5+ unit buildings).
Forward outlook
- In year one you build about $13k of equity ($2k loan paydown + $10k appreciation (3.0% local appreciation)).
- Minnehaha County population projected at +46% by 2050 — long-run rental-demand tailwind backs the buy-and-hold thesis.
- By year 3, paydown + projected appreciation supports a ~$32k cash-out refi (75% LTV) — recoverable capital for the next deal without selling this one.
Negotiation context
- It's been on market 16 days — a 2% lower offer ($340k) is reasonable based on typical stale-listing flexibility.
- 2 sale attempts since 20y ago with the ask held roughly flat each time — persistent listings suggest the price (not the market) is what's stuck; bring a comps-based counter.
- Current owner paid $152k; list at $345k implies a 127% gain — meaningful room to come down on a strong offer.
Risks & watch-outs
- Climate carrying-cost: moderate wildfire risk — expect insurance premiums to compound above CPI over the hold.
Questions for the listing agent
- What do current leases actually rent for vs. the listed asking? Can we see a recent rent roll and the last 12 months of T-12 income?
- Is there a deadline driving the sale (1031 exchange, divorce, estate, relocation)? That informs how much negotiation room exists.
- Schools are B-rated — typically a magnet for longer-tenancy family renters. What's the average tenant stay here, and is there a school-zone premium baked into asking?
- Crime grade is F in this area — have there been break-ins, vandalism, or insurance claims at this property in the last 3 years? What carrier currently insures it and at what premium?
- The area grade is low — what's the realistic commute time and amenity access for the typical tenant pool here? Any planned neighborhood developments (good or bad) we should know about?
- What's the average days-on-market for RENTAL listings here right now (not sales)? A rising rental-DOM trend means longer vacancies and softer asking-rent achievability than the comps imply.
- What's the recent tenant-quality profile in this submarket — average credit score on applications, eviction rate, late-payment / NSF rate, and stable-employment percentage? A property-management company in the area should have these aggregated.
- How much new for-sale + rental construction is in the pipeline within 1–3 miles? Heavy new supply typically softens prices + rents 12–24 months out; constrained supply supports both.
Investment metrics
- 1% rule
- 0.48% ✗
- Cap rate
- 3.06%
- Cash-on-cash
- -11.54%
- DSCR
- 0.49
- GRM
- 17.4
CMA / ARV
- ARV (on-the-fly)
- $318,136
- Comps found
- 12
Show comp detail 12 sales within ~0.75 mi
| Address | Dist | Beds/Ba | Sqft | Sold | Price | $/sf | Match |
|---|---|---|---|---|---|---|---|
| 1028 N Mable Cir Cir | 0.19mi | 4/2.0 | 2,120 (+7%) | 0mo | $371,500 | $175 | 75 |
| 1601 E Tracy Ln Ln | 0.34mi | 4/2.5 | 2,001 (+1%) | 8mo | $335,000 | $167 | 74 |
| 1716 E Tracy Ln | 0.25mi | 3/2.0 (-1) | 1,988 (+1%) | 11mo | $366,000 | $184 | 69 |
| 2004 E Madison St | 0.08mi | 4/2.0 | 1,756 (-11%) | 10mo | $272,004 | $155 | 66 |
| 904 N Highland Ave Ave | 0.29mi | 5/3.0 (+1) | 2,194 (+11%) | 2mo | $325,000 | $148 | 62 |
| 919 N Omaha Ave Ave | 0.14mi | 5/2.0 (+1) | 1,729 (-12%) | 4mo | $265,000 | $153 | 60 |
| 743 N Leadale Ave Ave | 0.26mi | 3/2.0 (-1) | 1,772 (-10%) | 4mo | $197,000 | $111 | 59 |
| 2009 E Madison St St | 0.10mi | 3/2.0 (-1) | 1,698 (-14%) | 9mo | $284,500 | $168 | 56 |
| 2001 E 1st St | 0.20mi | 3/2.0 (-1) | 1,770 (-10%) | 13mo | $266,000 | $150 | 54 |
| 1204 N Mossy Oak Ave | 0.58mi | 4/2.0 | 1,838 (-7%) | 9mo | $325,000 | $177 | 50 |
| 703 N Van Eps Ave | 0.58mi | 4/2.0 | 2,152 (+9%) | 11mo | $263,000 | $122 | 44 |
| 2501 E 7th St | 0.69mi | 4/2.0 | 1,806 (-9%) | 10mo | $289,900 | $161 | 41 |
Match score weights: distance 35% · size 25% · config 20% · recency 20%. Top-matched comps best support the ARV.
Projected returns pro-forma
3.0% appreciation · 3.0% rent growth · sell at horizon
- IRR
- -3.2%
- Equity multiple
- 0.82×
- Total profit
- $-17,678
- Equity at exit
- $155,127
- IRR
- 1.3%
- Equity multiple
- 1.21×
- Total profit
- $19,953
- Equity at exit
- $239,069
Cash invested: $96,600 (down + closing). Projections, not guarantees.
Landlord ↔ Tenant lean methodology
- Overall (STATE)
- 83 Strongly Landlord-Friendly
- State South Dakota
- 83 Strongly Landlord-Friendly · R+16
- County
- — inherits STATE
- City
- — inherits STATE
ZIP-level market 57103-0744
- Active inventory
- 1
- Price-to-rent
- 17.4×
Monthly cashflow live
- Estimated rent
- $1,651 high interval (Pro) →
- Mortgage (P&I)
- −$1,809
- Tax from tax record
- −$280 /mo · $3,360/yr
- Insurance
- −$144
- HOA
- −$0
- Vacancy / Maint / Mgmt
- −$347
- Net cashflow
- $-929
Break-even live
UW: 25.0% down · 7.5% · 30yr · 1.5% tax · 5.0% vac · 8.0% maint · 8.0% mgmt
Financing live
Cash to close
- Down payment
- $86,250
- Closing costs
- $10,350
- Reserves months
- —
- Total cash needed
- —
Loan-product check · same deal, 3 products live
Conventional
25% down · 7.5% · 30yr
- Down + closing
- —
- Monthly P&I
- —
- Monthly cashflow
- —
- DSCR
- —
- Eligible?
- —
Personal DTI + credit; lowest rate.
DSCR
20% down · 8.5% · 30yr
- Down + closing
- —
- Monthly P&I
- —
- Monthly cashflow
- —
- DSCR
- —
- Eligible?
- —
No personal income docs; deal must DSCR.
Hard money
10% down · 12.0% · 12mo
- Down + closing
- —
- Monthly P&I
- —
- Monthly cashflow
- —
- DSCR
- —
- Eligible?
- —
Short-term bridge; refi at stabilization.
Rent comps 8 comps
| Address | Beds | Baths | Sqft | Rent | $/sqft | DOM | Units | Dist |
|---|---|---|---|---|---|---|---|---|
| 3210 E 3rd St Unit 3210 Sioux Falls, SD | 3.0 | 2.0 | 2100 | $1,895 | $0.90 | 20d | 1 | 0.75mi |
| 2909 E 6th St Sioux Falls, SD | 3.0 | 1.0–2.0 | 773 | $1,539 | $1.99 | 13d | 1 | 0.83mi |
| 500 N Shepherd Ave Unit 201 Sioux Falls, SD | 3.0 | 2.0 | 1346 | $1,475 | $1.10 | 13d | 1 | 0.84mi |
| 500 N Shepherd Ave Unit 203 Sioux Falls, SD | 3.0 | 2.0 | 1346 | $1,475 | $1.10 | 43d | 1 | 0.84mi |
| 310 N Reid Pl Sioux Falls, SD | 3.0 | 1.0–3.0 | 1251 | $5,000 | $4.00 | 13d | 7 | 1.36mi |
| 440 E 8th St Sioux Falls, SD | 3.0 | 3.0 | 1900 | $4,800 | $2.53 | 20d | 1 | 1.37mi |
| 626 N Sycamore Ave Sioux Falls, SD | 4.0 | 3.0 | 2364 | $2,200 | $0.93 | 13d | 1 | 1.45mi |
| 626 N Sycamore Ave #204 Sioux Falls, SD | 3.0 | 2.0 | 1260 | $999 | $0.79 | 20d | 1 | 1.45mi |
Listing history 16 events
-
2026-06-18days on market $345,000 Active 16 DOM
-
2026-06-17days on market $345,000 Active 15 DOM
-
2026-06-16days on market $345,000 Active 14 DOM
-
2026-06-15days on market $345,000 Active 13 DOM
-
2026-06-14days on market $345,000 Active 11 DOM
-
2026-06-13days on market $345,000 Active 10 DOM
-
2026-06-10days on market $345,000 Active 8 DOM
-
2026-06-09days on market $345,000 Active 7 DOM
-
2026-06-08days on market $345,000 Active 6 DOM
-
2026-06-07days on market $345,000 Active 5 DOM
-
2026-06-05days on market $345,000 Active 2 DOM
-
2026-06-03days on market $345,000 Active 1 DOM
-
2026-06-02days on market $345,000 Active 4 DOM
-
2026-06-01days on market $345,000 Active 3 DOM
-
2026-05-31days on market $345,000 Active 2 DOM
-
2026-05-30$345,000 Active 1 DOM
ⓘ Source: listings_history table (triggers on properties + properties_extension) + one-shot
backfill from property_details.listing_events for pre-trigger history.
Tax reassessment forecast SD · Resets to sale price
- Current annual tax
- $3,360 · $280/mo
- Projected year-2 tax
- $4,520 · $377/mo
- Expected delta
- +$1,159/yr (+$97/mo · 34.5%)
ⓘ Screening estimate from a state-policy table — verify with the county assessor before closing.
Climate risk First Street
- Flood 1/10 Low FEMA zone X (unshaded) · 0% chance over 30 yrs
- Wildfire 5/10 Major
- Heat 2/10 Low 7 d/yr ≥99°F today · 14 d/yr by 30 yrs out
- Wind 2/10 Low
- Air quality 2/10 Low 1 unhealthy d/yr today · 1 by 30 yrs out
Nearby sold comps map
Loading sold comps map…
Walkable amenities ~0.75 mi
Loading nearby amenities…
Taxation est. · year 1
- Rental income
- $19,807
- − Mortgage interest
- −$19,325
- − Property taxes
- −$3,360
- − Insurance
- −$1,725
- − Repairs & maintenance
- −$1,585
- − Management
- −$1,585
- − Depreciation
- −$10,036
- Taxable loss
- −$17,809
- Est. tax savings @ 24.0%
- +$4,274
- After-tax cash flow
- $-6,874/yr
For passive investors: Depreciation is non-cash, so a rental often shows a tax loss while cash-flowing — sheltering income. Rental losses are passive: they offset passive income freely, and up to $25,000/yr can offset ordinary (W-2) income if you actively participate and your MAGI is under $100k (phasing out to $0 by $150k); unused losses carry forward. On sale, claimed depreciation is recaptured at up to 25%, and gains may owe capital-gains tax (a 1031 exchange can defer both). Figures are a year-1 estimate at your 24.0% rate — not tax advice; consult a CPA.
Schools (NCES district)
- District
- Sioux Falls School District 49-5
- NCES district ID
- 4666270
- Math proficiency
- 39% ▼ -4.00%
- Reading proficiency
- 48% ▼ -2.00%
- Median HH income
- $51,093
- Composite
- 37.47/100
- National rank
- #4407
- State rank
- #45 of 59 in SD
Livability — Sioux Falls
- Score
- 85/100
- State rank
- #3
- US rank
- #610
Category grades
Schools grade is shown separately in the Schools card above.
Census & demographics
- Census place
- Sioux Falls, SD
Population outlook (Minnehaha County) Hauer SSP2
- Today (2025)
- 222,323 people
- By 2030
- 241,430 · +8.6%
- By 2040
- 281,643 · +26.7%
- By 2050
- 325,574 · +46.4%
- By 2075
- 469,313 · +111.1%
- By 2100
- 664,763 · +199.0%
Not yet ingested
- Political lean
- —
- Race & ethnicity
- —
- Common origin
- —
- Civics
- —
Market trends
- HPI YoY
- —
- Current HPI
- —
- Rent YoY
- —
- Metro
- —
- State GDP YoY
- ▲ 0.70%
- F500 in state
- 2
Industry mix (Fortune 500 HQ in SD)
| Industry | F500 HQs | Revenue |
|---|---|---|
| Utilities | 1 | $1B |
|
||
Price history
+146.6% since first listed4 events — show timeline
- 2026-05-29 Listed $345,000 REALTOR® Association of the Sioux Empire
- 2015-07-02 Sold (Public Records) $152,000 Public Records
- 2007-04-10 Sold (Public Records) $139,900 Public Records
- 2006-11-04 Listed $139,900 REALTOR® Association of the Sioux Empire
Property tax history
+5.2%/yrLatest (2024): $3,360 · -2.8% YoY. Source: county tax records.
Cash-flow waterfall
monthlySold comps — $/sqft
last 12 mo · ≤1 miLoading sold comps…