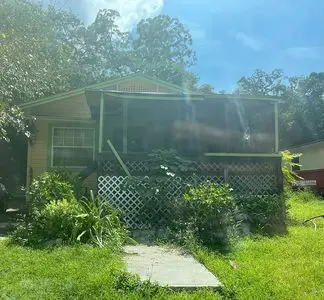
8307 N 10th St · Tampa, FL
Flood risk 4/10 · Minor
- FEMA flood zone
- X (unshaded)
- Chance of flooding over 30 yrs
- 0.22%
- Est. flood insurance / yr
- $507 – $1,088
Fire risk 1/10 · Minimal
- Est. fire insurance / yr
- $947 – $1,759
Heat risk 10/10 · Severe
- Hot days now (above 108°F)
- 7 days/yr
- Hot days in 30 yrs
- 26 days/yr
Wind risk 9/10 · Severe
- Chance of severe wind over 30 yrs
- 99.0%
Air-quality risk 3/10 · Minor
- Unhealthy air days now
- 3 days/yr
- Unhealthy air days in 30 yrs
- 4 days/yr
Risk factors via First Street. Map © Google.
Why this score? — see what drove the C- grade
The composite is a weighted blend of 9 inputs, each scored 0–100. Each bar is that input's sub-score; the figure is the points it added to the 100-point composite (weight × sub-score).
- Cash flow +19.3/30.0
- ARV discount +7.5/15.0
- DSCR +6.1/10.0
- 1% rule +4.9/10.0
- Schools +4.2/10.0
- Livability +4.0/5.0
- Rent growth +2.6/5.0
- Condition / age +2.5/5.0
- Appreciation +0.0/10.0
$180,000
🖨 Deal sheet 📄 Offer letter ✓ Due diligence
Listing remarks
This 877 square foot single family home has 3 bedrooms and 2.0 bathrooms. This home is located at 8307 N 10th St, Tampa, FL 33604.
Key facts
- Built 1974
- Listed 37 days
Property features AI
Exterior
- Home design: Built in 1974; Single‑story property
- Construction: 877 square feet of living area
- Exterior features: Located in the Sulphur Springs subdivision
Neighborhood map
What this means for you Summary
Snapshot
- This is a 3-bed/1.0-bath single-family listed at $180k.
Deal economics
- At list price, monthly cash flow is $197 ($2k/yr) — positive.
- The deal already cash-flows at list — no discount required.
- To meet the 1% rule (rent ≥ 1% of price), the offer needs to be $178k (1.2% below list).
- Recommended offer: $175k (3.0% below list) — sets the bar for market timing.
Location & tenants
- Location reads 79/100 on livability (#142 in FL, #2,135 nationally) — a middle-class / working-renter tenant base. Strengths: commute A+, housing A+, health & safety A+; Watch: schools C-, crime D+.
- Hillsborough (suburban): math 47% / reading 50% proficiency, ranked #41 of 73 in FL (top 56%) — families likely to look elsewhere, expect single-tenant / working-renter base with shorter leases.
- Market conditions: Rents flat; 368 active listings in the ZIP; 40 comparable units currently listed for rent nearby; rentals at typical pace (median 22d on market — plan ~3-4 weeks tenant-placement turnaround); 9,053 units permitted in Hillsborough County in 2024 (4,555 in 5+ unit buildings).
- This rent runs 36% of the median local income ($59k/yr) — at the standard rent-burdened threshold; future hikes will face affordability resistance.
Forward outlook
- Local home prices are declining (-3.0%/yr); year-one equity from $1k of loan paydown is wiped out by about $5k of value loss. Plan a longer hold.
- Hillsborough County population projected at +37% by 2050 — long-run rental-demand tailwind backs the buy-and-hold thesis.
Negotiation context
- It's been on market 37 days — a 3% lower offer ($175k) is reasonable based on typical stale-listing flexibility.
- 3 sale attempts since 19y ago with the ask held roughly flat each time — persistent listings suggest the price (not the market) is what's stuck; bring a comps-based counter.
- Current owner paid $90k; list at $180k implies a 100% gain — meaningful room to come down on a strong offer.
Risks & watch-outs
- Climate carrying-cost: severe wind risk, 99% chance of damaging wind over 30y; extreme-heat days projected 7→26/yr by 2055 (HVAC capex compounding) — expect insurance premiums to compound above CPI over the hold.
Questions for the listing agent
- It's been on market 37 days. Have you received any prior offers? Is the seller open to a 3% concession, seller financing, or rate buy-down credit?
- Built in 1974 — when were the roof, HVAC, electrical panel, plumbing, and water heater last replaced?
- Is there a deadline driving the sale (1031 exchange, divorce, estate, relocation)? That informs how much negotiation room exists.
- Crime grade is D in this area — have there been break-ins, vandalism, or insurance claims at this property in the last 3 years? What carrier currently insures it and at what premium?
- What's the average days-on-market for RENTAL listings here right now (not sales)? A rising rental-DOM trend means longer vacancies and softer asking-rent achievability than the comps imply.
- What's the recent tenant-quality profile in this submarket — average credit score on applications, eviction rate, late-payment / NSF rate, and stable-employment percentage? A property-management company in the area should have these aggregated.
- How much new for-sale + rental construction is in the pipeline within 1–3 miles? Heavy new supply typically softens prices + rents 12–24 months out; constrained supply supports both.
Investment metrics
- 1% rule
- 0.99% ✗
- Cap rate
- 7.60%
- Cash-on-cash
- 4.68%
- DSCR
- 1.21
- GRM
- 8.4
CMA / ARV
No comps found within radius.
Projected returns pro-forma
-3.0% appreciation · 0.52% rent growth · sell at horizon
- IRR
- -11.8%
- Equity multiple
- 0.58×
- Total profit
- $-20,973
- Equity at exit
- $26,839
- IRR
- -6.6%
- Equity multiple
- 0.62×
- Total profit
- $-19,033
- Equity at exit
- $15,563
Cash invested: $50,400 (down + closing). Projections, not guarantees.
Landlord ↔ Tenant lean methodology
- Overall (STATE)
- 87 Strongly Landlord-Friendly
- State Florida
- 87 Strongly Landlord-Friendly · R+3
- County
- — inherits STATE
- City
- — inherits STATE
ZIP-level market 33604
- Home prices YoY
- -31.3%
- Rents YoY
- 0.5%
- Active inventory
- 368
- Price-to-rent
- 8.4×
Monthly cashflow live
- Estimated rent
- $1,779 high interval (Pro) →
- Mortgage (P&I)
- −$944
- Tax from tax record
- −$190 /mo · $2,280/yr
- Insurance
- −$75
- HOA
- −$0
- Vacancy / Maint / Mgmt
- −$374
- Net cashflow
- $197
Break-even live
UW: 25.0% down · 7.5% · 30yr · 1.5% tax · 5.0% vac · 8.0% maint · 8.0% mgmt
Financing live
Cash to close
- Down payment
- $45,000
- Closing costs
- $5,400
- Reserves months
- —
- Total cash needed
- —
Loan-product check · same deal, 3 products live
Conventional
25% down · 7.5% · 30yr
- Down + closing
- —
- Monthly P&I
- —
- Monthly cashflow
- —
- DSCR
- —
- Eligible?
- —
Personal DTI + credit; lowest rate.
DSCR
20% down · 8.5% · 30yr
- Down + closing
- —
- Monthly P&I
- —
- Monthly cashflow
- —
- DSCR
- —
- Eligible?
- —
No personal income docs; deal must DSCR.
Hard money
10% down · 12.0% · 12mo
- Down + closing
- —
- Monthly P&I
- —
- Monthly cashflow
- —
- DSCR
- —
- Eligible?
- —
Short-term bridge; refi at stabilization.
Rent comps 40 comps
| Address | Beds | Baths | Sqft | Rent | $/sqft | DOM | Units | Dist |
|---|---|---|---|---|---|---|---|---|
| 8118 N Alaska St Tampa, FL | 2.0 | 1.0 | 700 | $1,500 | $2.14 | 2d | 1 | 0.18mi |
| 8210 N 13th St Tampa, FL | 2.0 | 1.0 | 995 | $1,895 | $1.90 | 5d | 1 | 0.18mi |
| 8416 N Brooks St Tampa, FL | 3.0 | 2.0 | 1090 | $1,900 | $1.74 | 11d | 1 | 0.24mi |
| 8105 N 12th St Tampa, FL | 2.0 | 1.0 | 874 | $1,650 | $1.89 | 24d | 1 | 0.26mi |
| 8506 N Brooks St Unit A Tampa, FL | 3.0 | 1.0 | 1004 | $1,950 | $1.94 | 11d | 1 | 0.28mi |
| 8105 N Klondyke St Unit A- Tampa, FL | 2.0 | 1.0 | 720 | $1,200 | $1.67 | 2d | 1 | 0.32mi |
| 8304 N Mulberry St Tampa, FL | 3.0 | 1.0 | 858 | $1,650 | $1.92 | 5d | 1 | 0.33mi |
| 8004 N Alaska St Tampa, FL | 2.0 | 1.0 | 844 | $1,595 | $1.89 | 24d | 1 | 0.34mi |
| 8117 N Mulberry St Unit B Tampa, FL | 3.0 | 1.0 | 800 | $2,750 | $3.44 | 22d | 1 | 0.40mi |
| 8117 N Mulberry St Unit B Tampa, FL | 3.0 | 1.0 | 800 | $1,987 | $2.48 | 5d | 1 | 0.40mi |
| 7903 N 13th St Tampa, FL | 2.0 | 1.0 | 648 | $1,199 | $1.85 | 5d | 1 | 0.42mi |
| 8419 N Semmes St Tampa, FL | 3.0 | 1.0 | 864 | $1,750 | $2.03 | 24d | 1 | 0.45mi |
| 8619 N Mulberry St Unit A Tampa, FL | 2.0 | 1.0 | 742 | $1,350 | $1.82 | 24d | 1 | 0.50mi |
| 8213 N 17th St Tampa, FL | 3.0 | 1.0 | 880 | $1,800 | $2.05 | 24d | 1 | 0.52mi |
| 7717 N Huntley Ave Tampa, FL | 2.0 | 1.0 | 692 | $1,425 | $2.06 | 3d | 1 | 0.53mi |
| 1500 E Humphrey St Tampa, FL | 2.0 | 1.5–2.0 | 858 | $1,772 | $2.07 | 24d | 1 | 0.53mi |
| 8218 N Elmer St Unit B Tampa, FL | 2.0 | 1.0 | 756 | $1,400 | $1.85 | 24d | 1 | 0.55mi |
| 7707 N Huntley Ave Unit 7707-5 Tampa, FL | 2.0 | 1.0 | 655 | $1,325 | $2.02 | 24d | 1 | 0.55mi |
| 1502 E Humphrey St Apt C Tampa, FL | 2.0 | 1.5 | 850 | $1,750 | $2.06 | 24d | 1 | 0.56mi |
| 8307 N Elmer St Tampa, FL | 3.0 | 1.0 | 1030 | $1,919 | $1.86 | 3d | 1 | 0.57mi |
| 1503 E Humphrey St Apt D Tampa, FL | 2.0 | 1.5 | 850 | $1,750 | $2.06 | 24d | 1 | 0.57mi |
| 1505 E Humphrey St Apt A Tampa, FL | 2.0 | 1.5 | 850 | $1,750 | $2.06 | 24d | 1 | 0.57mi |
| 1504 E Humphrey St Apt D Tampa, FL | 2.0 | 1.5 | 850 | $1,750 | $2.06 | 24d | 1 | 0.58mi |
| 1508 E Humphrey St Apt B Tampa, FL | 2.0 | 1.5 | 850 | $1,750 | $2.06 | 24d | 1 | 0.59mi |
| 1506 E Humphrey St Apt B Tampa, FL | 2.0 | 1.5 | 850 | $1,750 | $2.06 | 24d | 1 | 0.60mi |
| 1709 E Idell St Unit B Tampa, FL | 3.0 | 1.0 | 857 | $1,500 | $1.75 | 2d | 1 | 0.63mi |
| 1607 E Maple Ave Tampa, FL | 3.0 | 2.0 | 1061 | $1,500 | $1.41 | 22d | 1 | 0.64mi |
| 1607 E Maple Ave Tampa, FL | 3.0 | 2.0 | 1061 | $1,500 | $1.41 | 24d | 1 | 0.64mi |
| 1809 E Sitka St Tampa, FL | 3.0 | 2.0 | 1115 | $1,840 | $1.65 | 15d | 1 | 0.66mi |
| 1601 E Marks Dr Tampa, FL | 2.0 | 1.0 | 700 | $1,490 | $2.13 | 24d | 1 | 0.67mi |
| 8505 N Tampa St Unit B Tampa, FL | 2.0 | 1.0 | 812 | $1,250 | $1.54 | 15d | 1 | 0.71mi |
| 8505 N Tampa St Tampa, FL | 2.0 | 1.0 | 812 | $1,250 | $1.54 | 12d | 1 | 0.71mi |
| 112 W Stanley St Tampa, FL | 3.0 | 2.0 | 1067 | $2,500 | $2.34 | 20d | 1 | 0.78mi |
| 1502 E Sewaha St Tampa, FL | 2.0 | 1.0 | 784 | $1,350 | $1.72 | 14d | 1 | 0.78mi |
| 8618 N 20th St Tampa, FL | 3.0 | 2.0 | 1064 | $2,011 | $1.89 | 5d | 1 | 0.78mi |
| 9413 N Mulberry St Apt A Tampa, FL | 2.0 | 1.0 | 692 | $1,200 | $1.73 | 5d | 1 | 0.82mi |
| 9606 N 15th St Tampa, FL | 4.0 | 2.0 | 1000 | $1,750 | $1.75 | 24d | 1 | 0.88mi |
| 706 E Flora St Tampa, FL | 3.0 | 1.0 | 832 | $2,225 | $2.67 | 24d | 1 | 0.90mi |
| 1221 E Flora St Tampa, FL | 2.0 | 1.0 | 931 | $2,175 | $2.34 | 18d | 1 | 0.90mi |
| 2014 E Humphrey St Tampa, FL | 3.0 | 1.0 | 880 | $1,690 | $1.92 | 11d | 1 | 0.91mi |
Listing history 27 events
-
2026-06-18days on market $180,000 Active 37 DOM
-
2026-06-17days on market $180,000 Active 36 DOM
-
2026-06-16days on market $180,000 Active 35 DOM
-
2026-06-15days on market $180,000 Active 34 DOM
-
2026-06-13days on market $180,000 Active 32 DOM
-
2026-06-13days on market $180,000 Active 31 DOM
-
2026-06-09days on market $180,000 Active 28 DOM
-
2026-06-08days on market $180,000 Active 27 DOM
-
2026-06-07days on market $180,000 Active 26 DOM
-
2026-06-04days on market $180,000 Active 23 DOM
-
2026-06-03days on market $180,000 Active 22 DOM
-
2026-06-02days on market $180,000 Active 21 DOM
-
2026-06-01days on market $180,000 Active 20 DOM
-
2026-05-31days on market $180,000 Active 19 DOM
-
2026-05-12$180,000 Active 130-char remark
-
2025-04-24historical
-
2025-02-27price $159,000
-
2024-12-02$165,000 Active
-
2024-10-22soldstatus $90,000
-
2007-10-31soldstatus $97,500
-
2007-10-08soldstatus $94,900
-
2007-08-15historical
-
2007-06-05soldstatus $97,500
-
2007-04-23$100,000
-
1986-11-01soldstatus $28,800
-
1983-09-01soldstatus $27,200
-
1981-10-01soldstatus $24,900
ⓘ Source: listings_history table (triggers on properties + properties_extension) + one-shot
backfill from property_details.listing_events for pre-trigger history.
Tax reassessment forecast FL · Resets to sale price
- Current annual tax
- $2,280 · $190/mo
- Projected year-2 tax
- $2,280 · $190/mo
- Expected delta
- $0/yr ($0/mo · 0.0%)
ⓘ Screening estimate from a state-policy table — verify with the county assessor before closing.
Climate risk First Street
- Flood 4/10 Moderate FEMA zone X (unshaded) · 22% chance over 30 yrs
- Wildfire 1/10 Low
- Heat 10/10 Extreme 7 d/yr ≥108°F today · 26 d/yr by 30 yrs out
- Wind 9/10 Extreme 99% chance of damaging wind over 30 yrs
- Air quality 3/10 Moderate 3 unhealthy d/yr today · 4 by 30 yrs out
Nearby sold comps map
Loading sold comps map…
Walkable amenities ~0.75 mi
Loading nearby amenities…
Taxation est. · year 1
- Rental income
- $21,350
- − Mortgage interest
- −$10,083
- − Property taxes
- −$2,280
- − Insurance
- −$900
- − Repairs & maintenance
- −$1,708
- − Management
- −$1,708
- − Depreciation
- −$5,236
- Taxable loss
- −$565
- Est. tax savings @ 24.0%
- +$136
- After-tax cash flow
- $2,495/yr
For passive investors: Depreciation is non-cash, so a rental often shows a tax loss while cash-flowing — sheltering income. Rental losses are passive: they offset passive income freely, and up to $25,000/yr can offset ordinary (W-2) income if you actively participate and your MAGI is under $100k (phasing out to $0 by $150k); unused losses carry forward. On sale, claimed depreciation is recaptured at up to 25%, and gains may owe capital-gains tax (a 1031 exchange can defer both). Figures are a year-1 estimate at your 24.0% rate — not tax advice; consult a CPA.
Schools (NCES district)
- District
- Hillsborough
- NCES district ID
- 1200870
- Math proficiency
- 47% ▼ -8.00%
- Reading proficiency
- 50% ▼ -4.00%
- Median HH income
- $50,622
- Composite
- 41.6/100
- National rank
- #3435
- State rank
- #41 of 73 in FL
Livability — Tampa
- Score
- 79/100
- State rank
- #142
- US rank
- #2135
Category grades
Schools grade is shown separately in the Schools card above.
Census & demographics
- Census place
- Tampa, FL
- County
- Hillsborough County · 1,540,968 people
- City population
- 523,346
- Metro
- Tampa-St. Petersburg-Clearwater, FL
- Population (ZIP)
- 40,055
- Household income
- $58,766
- Rent vs Own
- Severe rent burden
- 2581.0
Population outlook (Hillsborough County) Hauer SSP2
- Today (2025)
- 1,607,022 people
- By 2030
- 1,733,968 · +7.9%
- By 2040
- 1,979,565 · +23.2%
- By 2050
- 2,203,427 · +37.1%
- By 2075
- 2,667,893 · +66.0%
- By 2100
- 2,891,558 · +79.9%
Race, ethnicity, and origin ACS 2023
- Neighborhood character
- Diverse neighborhood (Simpson 0.69)
- Race & ethnicity
- Hispanic / Latino 38% White 35% Two or more races 22% Black 21% Asian 2%
- Hispanic origin (detail)
- Mexican 3% Puerto Rican 11% Cuban 13% Dominican 2%
- Common ancestry
- Romanian 3% Lithuanian 2% Slovak 1%
- Foreign-born
- 18% · Canada, Vietnam, Jamaica
- Languages at home
- 66% English-only · Spanish 30% Vietnamese 1% French/Haitian/Cajun 1%
Political lean MEDSL · Hillsborough
- 2024 margin
- Toss-up / Even · D 47.8% · R 50.9% · Other 1.3%
- 2008→2024 swing
- -10.2pp toward R · 2008: 7.1pp · 2024: -3.1pp
- All cycles
- 2024: R+3.1 2020: D+6.9 2016: D+6.8 2012: D+6.7 2008: D+7.1
Not yet ingested
- Civics
- —
Market trends
- HPI YoY
- ▼ -200.24%
- Current HPI
- 439.7084
- Rent YoY
- ▲ 0.52%
- Metro
- Tampa-St. Petersburg-Clearwater, FL
- State GDP YoY
- ▲ 3.28%
- F500 in state
- 36
Industry mix (Fortune 500 HQ in FL)
| Industry | F500 HQs | Revenue |
|---|---|---|
| Industrial Technology | 2 | $29B |
|
||
| Insurance | 2 | $17B |
|
||
| Retail | 1 | $60B |
|
||
| Technology Distribution | 1 | $58B |
|
||
| Homebuilding | 1 | $35B |
|
||
| Technology Manufacturing | 1 | $35B |
|
||
Price history
+622.9% since first listed13 events — show timeline
- 2026-05-12 Listed $180,000 FSBO.com
- 2025-04-24 Listing Removed — Stellar MLS as Distributed by MLS Grid
- 2025-02-27 Price Changed $159,000 Stellar MLS as Distributed by MLS Grid
- 2024-12-02 Listed $165,000 Stellar MLS as Distributed by MLS Grid
- 2024-10-22 Sold (Public Records) $90,000 Public Records
- 2007-10-31 Sold (Public Records) $97,500 Public Records
- 2007-10-08 Sold (Public Records) $94,900 Public Records
- 2007-08-15 Listing Removed — Stellar MLS as Distributed by MLS Grid
- 2007-06-05 Sold (Public Records) $97,500 Public Records
- 2007-04-23 Listed $100,000 Stellar MLS as Distributed by MLS Grid
- 1986-11-01 Sold (Public Records) $28,800 Public Records
- 1983-09-01 Sold (Public Records) $27,200 Public Records
- 1981-10-01 Sold (Public Records) $24,900 Public Records
Property tax history
+42.9%/yrLatest (2025): $2,280 · +2078.5% YoY. Source: county tax records.
Cash-flow waterfall
monthlySold comps — $/sqft
last 12 mo · ≤1 miLoading sold comps…