619 Bailey Ave · Greenport West, NY
Flood risk 1/10 · Minimal
- FEMA flood zone
- X (unshaded)
- Chance of flooding over 30 yrs
- 0.0%
- Est. flood insurance / yr
- $473 – $860
Fire risk 2/10 · Minimal
- Est. fire insurance / yr
- $691 – $1,283
Heat risk 5/10 · Moderate
- Hot days now (above 90°F)
- 7 days/yr
- Hot days in 30 yrs
- 19 days/yr
Wind risk 8/10 · Major
- Chance of severe wind over 30 yrs
- 80.0%
Air-quality risk 3/10 · Minor
- Unhealthy air days now
- 3 days/yr
- Unhealthy air days in 30 yrs
- 4 days/yr
Risk factors via First Street. Map © Google.
Why this score? — see what drove the C grade
The composite is a weighted blend of 9 inputs, each scored 0–100. Each bar is that input's sub-score; the figure is the points it added to the 100-point composite (weight × sub-score).
- Cash flow +26.4/30.0
- DSCR +9.0/10.0
- 1% rule +7.1/10.0
- Schools +4.5/10.0
- Condition / age +4.0/5.0
- Livability +2.9/5.0
- Rent growth +2.5/5.0
- ARV discount +1.5/15.0
- Appreciation +0.0/10.0
$1,475,000
🖨 Deal sheet 📄 Offer letter ✓ Due diligence
Listing remarks
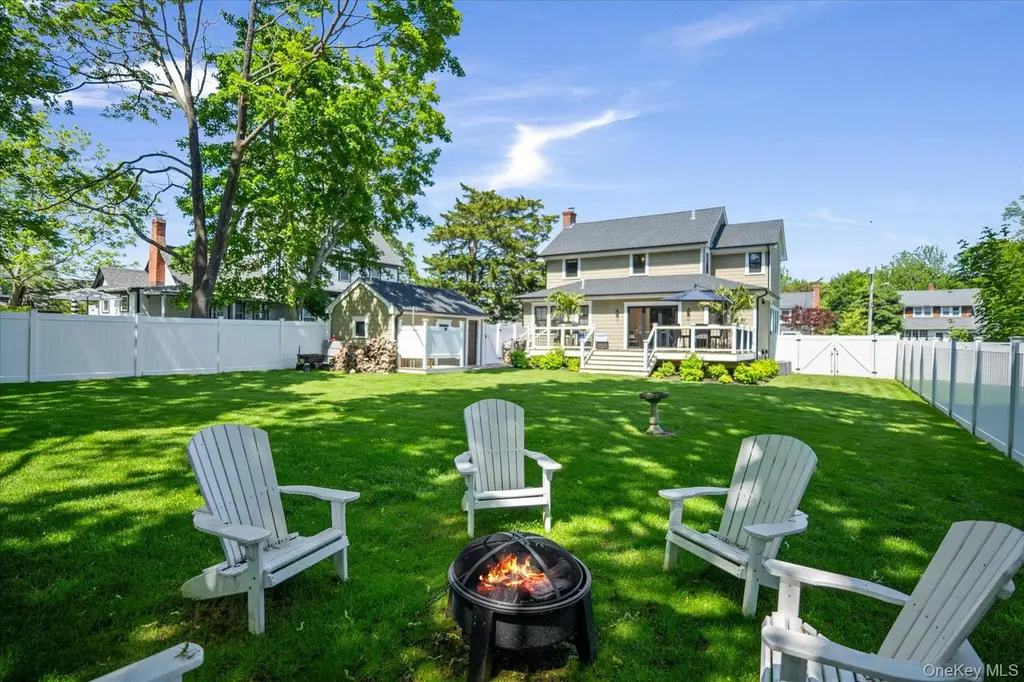
Welcome to 619 Bailey Avenue, a fully restored and move-in ready farmhouse located on the fringe of Greenport Village. Originally part of a larger North Fork farm and estate, this incredibly well appointed circa 1900 residence has been thoughtfully re-imagined to blend modern conveniences with preserved period details. Original features such as hardwood floors, detailed millwork/moldings, and classic architectural elements have been carefully maintained, while updates throughout provide comfort and functionality. The custom kitchen is a standout, featuring a 48" range, oversized center island, custom cabinetry, and an 8-foot bi-fold glass door that opens to the rear yard, creating seam
Key facts
- Custom kitchen
- 48 inch range
- 0.25 acre lot
Tags
Property features AI
Exterior
- Parking: Driveway; 1-car garage
- Security: Irrigation equipment
- Utilities: Septic tank; Cable connected; Electricity connected; Natural gas connected; Phone connected; Water connected
- Home design: Single-family residence; Updated / remodeled
- Construction: Clapboard siding; Frame construction; Fiberglass insulation; Partial attic; Finished full basement with Bilco doors
- Exterior features: Back yard and front yard; Landscaped grounds; Level lot; Near golf course; Near public transit; Near shops; Near school; Sprinklers in front and rear; Back yard fencing
Interior
- Kitchen: Chef's kitchen with kitchen island; Stone countertops; Gas range; Range; Microwave; Dishwasher; Refrigerator; Freezer; Wine refrigerator; Exhaust fan
- Bedrooms: Includes a bedroom on the first floor
- Flooring: Hardwood floors; Tile flooring
- Bathrooms: 2 full baths; 1 half bath; Double vanity in primary bath
- Heating & cooling: Hot water heat; Central air conditioning
- Interior features: First-floor bedroom; Breakfast bar; Built-in features; Chef's kitchen; Double vanity; Eat-in kitchen; Formal dining; High-speed internet; Kitchen island; Original details; Primary bathroom; Recessed lighting; Smart thermostat; Stone counters; Walk-in closets; ENERGY STAR qualified windows
- Laundry & utility: Washer and dryer included; Laundry located in basement; Tankless water heater
Neighborhood map
What this means for you Summary
Snapshot
- This is a 4-bed/2.5-bath single-family listed at $1.48M. Condition is rated good.
Deal economics
- At list price, monthly cash flow is $4k ($47k/yr) — positive.
- The deal already cash-flows at list — no discount required.
- Meets the 1% rule at list price ($18k rent vs $1.48M).
- Recommended offer: $1.43M (3.0% below list) — sets the bar for market timing.
Location & tenants
- Location reads 58/100 on livability (#1,073 in NY) — a working-class tenant base; expect higher turnover. Strengths: crime A+, employment A+; Watch: amenities F, commute F, cost of living F.
- Greenport Union Free School District (town): math 55% / reading 45% proficiency, ranked #450 of 755 in NY (top 60%) — acceptable for families but not a draw, mixed tenant base, ~2y average lease.
- Zoned schools: Greenport Elementary School (math 47% / reading 62%, grade C, #908 of 2,108 statewide, top 46%, 339 students, 61% FRL); Greenport High School (math 52% / reading 54%, grade C-, #934 of 1,100 statewide, top 86%, 356 students, 63% FRL).
- Market conditions: 67 active listings in the ZIP; 4 comparable units currently listed for rent nearby; rentals lingering (median 44d on market — plan ~5-8 weeks vacancy on turnover, expect pricing pressure); 75% of comp listings sitting > 30 days — soft ceiling on asking rent; 1,366 units permitted in Suffolk County in 2024 (216 in 5+ unit buildings).
Forward outlook
- Local home prices are declining (-3.0%/yr); year-one equity from $10k of loan paydown is wiped out by about $44k of value loss. Plan a longer hold.
- Suffolk County population projected to shrink 5% by 2050 — rents likely to lag national; underwrite the cash flow, not the appreciation.
- At projected returns (-3.0% appreciation + 3.0% rent growth), your $413k cash investment doubles in ~10 years — after that, you're playing with house money.
Negotiation context
- It's been on market 51 days — a 3% lower offer ($1.43M) is reasonable based on typical stale-listing flexibility.
- 4 sale attempts; this cycle's ask is 3178% above the opening price — seller raised mid-cycle; expect resistance to lowballs.
Risks & watch-outs
- Watch-outs: built in 1925 — expect roof / HVAC / electrical / plumbing capex.
- Climate carrying-cost: severe wind risk, 80% chance of damaging wind over 30y; extreme-heat days projected 7→19/yr by 2055 (HVAC capex compounding) — expect insurance premiums to compound above CPI over the hold.
Questions for the listing agent
- It's been on market 51 days. Have you received any prior offers? Is the seller open to a 3% concession, seller financing, or rate buy-down credit?
- Built in 1925 — when were the roof, HVAC, electrical panel, plumbing, and water heater last replaced?
- Is there a deadline driving the sale (1031 exchange, divorce, estate, relocation)? That informs how much negotiation room exists.
- Schools are D-rated, which usually means shorter tenancies and higher turnover. Who's the typical renter profile here, and what's been the actual vacancy rate?
- What's the average days-on-market for RENTAL listings here right now (not sales)? A rising rental-DOM trend means longer vacancies and softer asking-rent achievability than the comps imply.
- What's the recent tenant-quality profile in this submarket — average credit score on applications, eviction rate, late-payment / NSF rate, and stable-employment percentage? A property-management company in the area should have these aggregated.
- How much new for-sale + rental construction is in the pipeline within 1–3 miles? Heavy new supply typically softens prices + rents 12–24 months out; constrained supply supports both.
Investment metrics
- 1% rule
- 1.21% ✓
- Cap rate
- 9.45%
- Cash-on-cash
- 11.26%
- DSCR
- 1.50
- GRM
- 6.9
CMA / ARV
- ARV (median comp)
- $1,300,808
- List price
- $1,475,000
- Delta
- 13.39%
- Verdict
- OVERPRICED
- Comps
- 20 within 1.0 mi
Show comp detail 7 sales within ~0.75 mi
| Address | Dist | Beds/Ba | Sqft | Sold | Price | $/sf | Match |
|---|---|---|---|---|---|---|---|
| 1111 Main St | 0.17mi | 3/2.0 (-1) | 2,363 (+3%) | 6mo | $1,200,000 | $508 | 75 |
| 155 Bridge St | 0.19mi | 5/3.5 (+1) | 2,400 (+4%) | 2mo | $1,470,000 | $613 | 73 |
| 529 2nd St | 0.51mi | 3/1.5 (-1) | 2,200 (-4%) | 10mo | $1,100,000 | $500 | 52 |
| 1425 Middleton Rd | 0.40mi | 4/2.0 | 1,968 (-14%) | 15mo | $672,800 | $342 | 43 |
| 3900 Route 25 | 0.62mi | 3/2.5 (-1) | 2,162 (-6%) | 19mo | $1,090,000 | $504 | 40 |
| 525 Landing Ln | 0.72mi | 4/3.0 | 2,100 (-9%) | 14mo | $920,000 | $438 | 38 |
| 520 Madison Ave | 0.71mi | 4/2.5 | 2,000 (-13%) | 17mo | $1,675,000 | $838 | 31 |
Match score weights: distance 35% · size 25% · config 20% · recency 20%. Top-matched comps best support the ARV.
Projected returns pro-forma
-3.0% appreciation · 3.0% rent growth · sell at horizon
- IRR
- 0.5%
- Equity multiple
- 1.02×
- Total profit
- $8,068
- Equity at exit
- $219,927
- IRR
- 10.2%
- Equity multiple
- 1.79×
- Total profit
- $325,927
- Equity at exit
- $127,531
Cash invested: $413,000 (down + closing). Projections, not guarantees.
Landlord ↔ Tenant lean methodology
- Overall (STATE)
- 15 Strongly Tenant-Friendly
- State New York
- 15 Strongly Tenant-Friendly · D+10
- County
- — inherits STATE
- City
- — inherits STATE
ZIP-level market 11944
- Home prices YoY
- -23.7%
- Active inventory
- 67
- Price-to-rent
- 6.9×
Monthly cashflow live
- Estimated rent
- $17,808 medium interval (Pro) →
- Mortgage (P&I)
- −$7,735
- Tax est. 1.5%
- −$1,844 /mo · $22,125/yr
- Insurance
- −$615
- HOA
- −$0
- Vacancy / Maint / Mgmt
- −$3,740
- Net cashflow
- $3,875
Break-even live
UW: 25.0% down · 7.5% · 30yr · 1.5% tax · 5.0% vac · 8.0% maint · 8.0% mgmt
Financing live
Cash to close
- Down payment
- $368,750
- Closing costs
- $44,250
- Reserves months
- —
- Total cash needed
- —
Loan-product check · same deal, 3 products live
Conventional
25% down · 7.5% · 30yr
- Down + closing
- —
- Monthly P&I
- —
- Monthly cashflow
- —
- DSCR
- —
- Eligible?
- —
Personal DTI + credit; lowest rate.
DSCR
20% down · 8.5% · 30yr
- Down + closing
- —
- Monthly P&I
- —
- Monthly cashflow
- —
- DSCR
- —
- Eligible?
- —
No personal income docs; deal must DSCR.
Hard money
10% down · 12.0% · 12mo
- Down + closing
- —
- Monthly P&I
- —
- Monthly cashflow
- —
- DSCR
- —
- Eligible?
- —
Short-term bridge; refi at stabilization.
Rent comps 4 comps
| Address | Beds | Baths | Sqft | Rent | $/sqft | DOM | Units | Dist |
|---|---|---|---|---|---|---|---|---|
| 485 Sutton Pl Greenport, NY | 4.0 | 2.5 | 2026 | $20,000 | $9.87 | 43d | 1 | 0.30mi |
| 312 5th Ave Greenport, NY | 4.0 | 2.0 | 1900 | $12,000 | $6.32 | 43d | 1 | 0.74mi |
| 64230 North Rd Greenport, NY | 4.0 | 3.0 | 2800 | $6,500 | $2.32 | 43d | 1 | 1.11mi |
| 131 6th St Unit G Greenport, NY | 3.0 | 2.5 | 2238 | $5,000 | $2.23 | 24d | 1 | 1.39mi |
Listing history 21 events
-
2026-06-18days on market $1,475,000 Active 51 DOM
-
2026-06-17days on market $1,475,000 Active 50 DOM
-
2026-06-16days on market $1,475,000 Active 49 DOM
-
2026-06-15days on market $1,475,000 Active 48 DOM
-
2026-06-13days on market $1,475,000 Active 46 DOM
-
2026-06-12days on market $1,475,000 Active 45 DOM
-
2026-06-09days on market $1,475,000 Active 42 DOM
-
2026-06-08days on market $1,475,000 Active 41 DOM
-
2026-06-07days on market $1,475,000 Active 40 DOM
-
2026-06-05days on market $1,475,000 Active 38 DOM
-
2026-06-04days on market $1,475,000 Active 36 DOM
-
2026-06-02days on market $1,475,000 Active 35 DOM
-
2026-06-01days on market $1,475,000 Active 34 DOM
-
2026-05-31days on market $1,475,000 Active 33 DOM
-
2026-04-30$45,000
-
2026-04-28$1,475,000 Active 1587-char remark
-
2025-12-16historical
-
2025-09-23$1,645,000 Active
-
2025-09-16historical
-
2025-08-12price $1,749,500
-
2025-05-30$1,895,000 Active
ⓘ Source: listings_history table (triggers on properties + properties_extension) + one-shot
backfill from property_details.listing_events for pre-trigger history.
Climate risk First Street
- Flood 1/10 Low FEMA zone X (unshaded) · 0% chance over 30 yrs
- Wildfire 2/10 Low
- Heat 5/10 Major 7 d/yr ≥90°F today · 19 d/yr by 30 yrs out
- Wind 8/10 Severe 80% chance of damaging wind over 30 yrs
- Air quality 3/10 Moderate 3 unhealthy d/yr today · 4 by 30 yrs out
Nearby sold comps map
Loading sold comps map…
Walkable amenities ~0.75 mi
Loading nearby amenities…
Taxation est. · year 1
- Rental income
- $213,700
- − Mortgage interest
- −$82,623
- − Property taxes
- −$22,125
- − Insurance
- −$7,375
- − Repairs & maintenance
- −$17,096
- − Management
- −$17,096
- − Depreciation
- −$42,909
- Taxable income
- $24,476
- Est. tax owed @ 24.0%
- −$5,874
- After-tax cash flow
- $40,628/yr
For passive investors: Depreciation is non-cash, so a rental often shows a tax loss while cash-flowing — sheltering income. Rental losses are passive: they offset passive income freely, and up to $25,000/yr can offset ordinary (W-2) income if you actively participate and your MAGI is under $100k (phasing out to $0 by $150k); unused losses carry forward. On sale, claimed depreciation is recaptured at up to 25%, and gains may owe capital-gains tax (a 1031 exchange can defer both). Figures are a year-1 estimate at your 24.0% rate — not tax advice; consult a CPA.
Condition & rehab AI · 13 photos
This fully restored farmhouse is move-in ready with modern updates and preserved period details, making it an attractive option for both resale and rental.
Value-add opportunities
- Both landscaping — enhances curb appeal and outdoor living space
- Both paint — fresh paint improves home's appearance and value
Renovation cost estimate screening
Value-add ROI direction
- Both landscaping — enhances curb appeal and outdoor living space ↑
- Both paint — fresh paint improves home's appearance and value ↑
ⓘ Cost ranges are severity-bucket heuristics (US national rule-of-thumb). Get contractor quotes + a written scope before underwriting a rehab budget.
Schools (NCES district)
- District
- Greenport Union Free School District
- NCES district ID
- 3612840
- Math proficiency
- 55% ▲ 5.00%
- Reading proficiency
- 45% ▼ -5.00%
- Median HH income
- $54,490
- Composite
- 45.25/100
- National rank
- #5759
- State rank
- #450 of 755 in NY
Livability — Greenport West
- Score
- 58/100
- State rank
- #1073
- US rank
- #21520
Category grades
Schools grade is shown separately in the Schools card above.
Census & demographics
- Census place
- Greenport West, NY
- Population (ZIP)
- 4,744
Population outlook (Suffolk County) Hauer SSP2
- Today (2025)
- 1,505,262 people
- By 2030
- 1,498,318 · -0.5%
- By 2040
- 1,471,101 · -2.3%
- By 2050
- 1,424,848 · -5.3%
- By 2075
- 1,337,157 · -11.2%
- By 2100
- 1,217,720 · -19.1%
Race, ethnicity, and origin ACS 2023
- Neighborhood character
- Predominantly White (69%)
- Race & ethnicity
- White 69% Hispanic / Latino 23% Two or more races 6% Black 4% Asian 2%
- Hispanic origin (detail)
- Mexican 5% Puerto Rican 2%
- Common ancestry
- Romanian 6% Lithuanian 2% Subsaharan African 2%
- Foreign-born
- 19% · Canada, China
- Languages at home
- 69% English-only · Spanish 22% German/W. Germanic 3% Russian/Polish/Slavic 2%
Political lean MEDSL · Suffolk
- 2024 margin
- Lean R (+10.0) · D 45.0% · R 55.0%
- 2008→2024 swing
- -16.0pp toward R · 2008: 6.0pp · 2024: -10.0pp
- All cycles
- 2024: R+10.0 2020: R+0.0 2016: R+8.2 2012: D+2.9 2008: D+6.0
Not yet ingested
- Civics
- —
Market trends
- HPI YoY
- ▼ -143.97%
- Current HPI
- 462.3431
- Rent YoY
- —
- Metro
- —
- State GDP YoY
- ▲ 2.60%
- F500 in state
- 92
Industry mix (Fortune 500 HQ in NY)
| Industry | F500 HQs | Revenue |
|---|---|---|
| Financial Services | 10 | $950B |
|
||
| Consumer Goods | 9 | $162B |
|
||
| Insurance | 4 | $225B |
|
||
| Telecommunications | 2 | $144B |
|
||
| Pharmaceuticals | 2 | $112B |
|
||
| Media / Entertainment | 2 | $69B |
|
||
Price history
-97.6% since first listed7 events — show timeline
- 2026-04-30 Listed for Rent $45,000 ONEKEY
- 2026-04-28 Listed $1,475,000 OneKey® MLS as Distributed by MLS Grid
- 2025-12-16 Listing Removed — OneKey® MLS as Distributed by MLS Grid
- 2025-09-23 Listed $1,645,000 OneKey® MLS as Distributed by MLS Grid
- 2025-09-16 Listing Removed — OneKey® MLS as Distributed by MLS Grid
- 2025-08-12 Price Changed $1,749,500 OneKey® MLS as Distributed by MLS Grid
- 2025-05-30 Listed $1,895,000 OneKey® MLS as Distributed by MLS Grid
Cash-flow waterfall
monthlySold comps — $/sqft
last 12 mo · ≤1 miLoading sold comps…