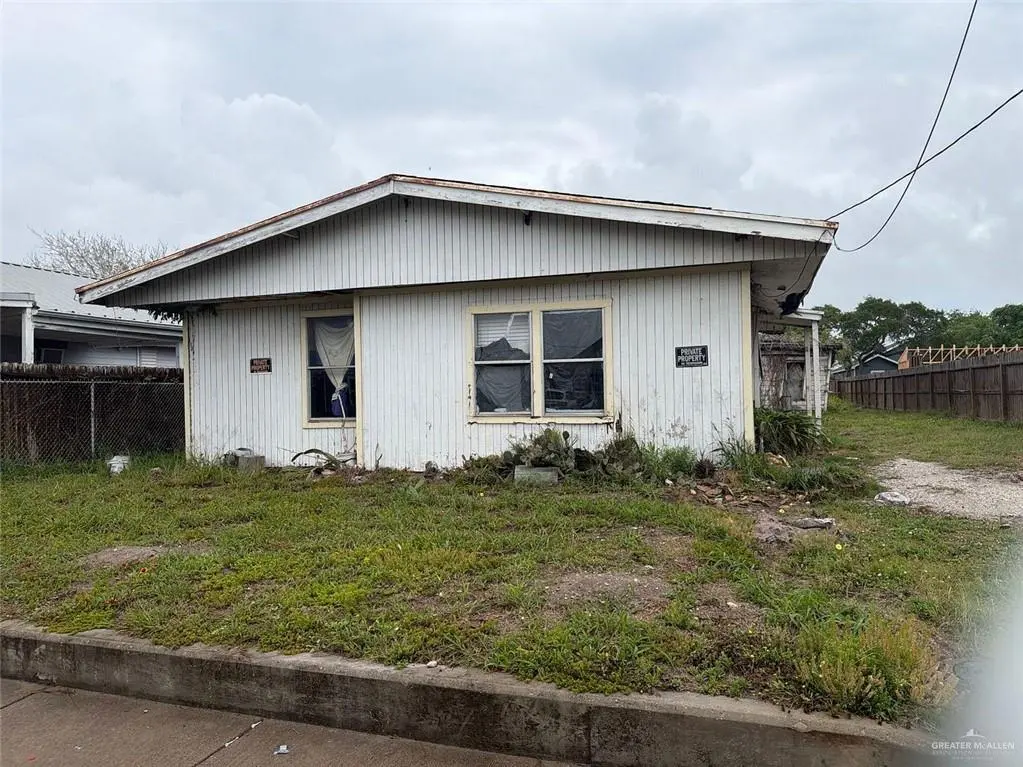
430 Webb St · Corpus Christi, TX
Flood risk 4/10 · Minor
- FEMA flood zone
- X (unshaded)
- Chance of flooding over 30 yrs
- 0.22%
- Est. flood insurance / yr
- $507 – $1,088
Fire risk 1/10 · Minimal
- Est. fire insurance / yr
- $1,222 – $2,270
Heat risk 10/10 · Severe
- Hot days now (above 108°F)
- 7 days/yr
- Hot days in 30 yrs
- 29 days/yr
Wind risk 9/10 · Severe
- Chance of severe wind over 30 yrs
- 99.0%
Air-quality risk 1/10 · Minimal
- Unhealthy air days now
- 0 days/yr
- Unhealthy air days in 30 yrs
- 0 days/yr
Risk factors via First Street. Map © Google.
Why this score? — see what drove the B grade
The composite is a weighted blend of 9 inputs, each scored 0–100. Each bar is that input's sub-score; the figure is the points it added to the 100-point composite (weight × sub-score).
- Cash flow +30.0/30.0
- 1% rule +10.0/10.0
- DSCR +10.0/10.0
- ARV discount +7.5/15.0
- Schools +4.1/10.0
- Livability +3.9/5.0
- Condition / age +2.5/5.0
- Rent growth +2.4/5.0
- Appreciation +0.0/10.0
$75,000
🖨 Deal sheet 📄 Offer letter ✓ Due diligence
Listing remarks MLS
Located at 430 Webb in Corpus Christi, this property offers a great opportunity for investors ready to take on a rehab project with upside. The home has solid bones and a workable layout, making it a strong candidate for improvements that can greatly increase its value. The location is a major highlight. Situated near the Naval Air Station and close to everyday amenities, this area supports long-term appeal for resale or rental strategies. With the right updates, this property can be transformed into a standout asset. It’s simply waiting for a rehabber’s vision to bring it back to life.
Key facts
- Solid bones
- Everyday amenities
- Rehab project
Tags
Neighborhood map
What this means for you Summary
Snapshot
- This is a 2-bed/1.0-bath single-family listed at $75k.
Deal economics
- At list price, monthly cash flow is $455 ($5k/yr) — positive.
- The deal already cash-flows at list — no discount required.
- Meets the 1% rule at list price ($1k rent vs $75k).
- Recommended offer: $70k (6.0% below list) — sets the bar for market timing.
- Cap rate 13.6% vs local median 3.6% in Corpus Christi — top-decile yield for the area; either an underpriced asset or a hidden risk that comps aren't pricing in. Stress-test before assuming the spread holds.
Location & tenants
- Location reads 78/100 on livability (#66 in TX, #2,404 nationally) — a middle-class / working-renter tenant base. Strengths: commute A+, cost of living A+, housing A+; Watch: crime F.
- Flour Bluff ISD (urban): math 43% / reading 51% proficiency, ranked #209 of 826 in TX (top 25%) — families likely to look elsewhere, expect single-tenant / working-renter base with shorter leases.
- Market conditions: Rents soft (-0.6%/yr); 685 active listings in the ZIP; 12 comparable units currently listed for rent nearby; rentals lingering (median 44d on market — plan ~5-8 weeks vacancy on turnover, expect pricing pressure); 50% of comp listings sitting > 30 days — soft ceiling on asking rent; solid renter incomes; 1,397 units permitted in Nueces County in 2024 (47 in 5+ unit buildings).
- This rent is only 17% of the median local income ($92k/yr) — well below the 30% rent-burden line; pricing power to push rent on renewal without tenant pushback.
Forward outlook
- Local home prices are declining (-3.0%/yr); year-one equity from $519 of loan paydown is wiped out by about $2k of value loss. Plan a longer hold.
- Nueces County population projected at +36% by 2050 — long-run rental-demand tailwind backs the buy-and-hold thesis.
- At projected returns (-3.0% appreciation + 0.0% rent growth), your $21k cash investment doubles in ~6 years — after that, you're playing with house money.
Negotiation context
- It's been on market 64 days — a 6% lower offer ($70k) is reasonable based on typical stale-listing flexibility.
Risks & watch-outs
- Watch-outs: property tax is 2.7% of price.
- Climate carrying-cost: severe wind risk, 99% chance of damaging wind over 30y; extreme-heat days projected 7→29/yr by 2055 (HVAC capex compounding) — expect insurance premiums to compound above CPI over the hold.
Questions for the listing agent
- It's been on market 64 days. Have you received any prior offers? Is the seller open to a 6% concession, seller financing, or rate buy-down credit?
- Property tax is high relative to price — has the assessment been appealed recently, and will the sale trigger a re-assessment?
- Why hasn't it sold? Are there any deal-killer items the seller is aware of (foundation, flood, title, zoning, code violations)?
- Is there a deadline driving the sale (1031 exchange, divorce, estate, relocation)? That informs how much negotiation room exists.
- Crime grade is F in this area — have there been break-ins, vandalism, or insurance claims at this property in the last 3 years? What carrier currently insures it and at what premium?
- What's the average days-on-market for RENTAL listings here right now (not sales)? A rising rental-DOM trend means longer vacancies and softer asking-rent achievability than the comps imply.
- What's the recent tenant-quality profile in this submarket — average credit score on applications, eviction rate, late-payment / NSF rate, and stable-employment percentage? A property-management company in the area should have these aggregated.
- How much new for-sale + rental construction is in the pipeline within 1–3 miles? Heavy new supply typically softens prices + rents 12–24 months out; constrained supply supports both.
Investment metrics
- 1% rule
- 1.77% ✓
- Cap rate
- 13.57%
- Cash-on-cash
- 25.99%
- DSCR
- 2.16
- GRM
- 4.7
CMA / ARV
- ARV (median comp)
- $207,577
- List price
- $75,000
- Delta
- -63.87%
- Verdict
- UNDERPRICED
- Comps
- 20 within 1.0 mi
Show comp detail 3 sales within ~0.75 mi
| Address | Dist | Beds/Ba | Sqft | Sold | Price | $/sf | Match |
|---|---|---|---|---|---|---|---|
| 436 Judie Ct | 0.22mi | 3/1.0 (+1) | 1,061 (+4%) | 8mo | $157,500 | $148 | 72 |
| 637 Jester St | 0.28mi | 3/1.0 (+1) | 981 (-4%) | 4mo | $159,500 | $163 | 72 |
| 405 Valerie St | 0.19mi | 3/2.0 (+1) | 1,056 (+3%) | 17mo | $185,000 | $175 | 63 |
Match score weights: distance 35% · size 25% · config 20% · recency 20%. Top-matched comps best support the ARV.
Projected returns pro-forma
-3.0% appreciation · 0.0% rent growth · sell at horizon
- IRR
- 16.0%
- Equity multiple
- 1.62×
- Total profit
- $12,988
- Equity at exit
- $11,183
- IRR
- 22.2%
- Equity multiple
- 2.61×
- Total profit
- $33,829
- Equity at exit
- $6,485
Cash invested: $21,000 (down + closing). Projections, not guarantees.
Landlord ↔ Tenant lean methodology
- Overall (STATE)
- 87 Strongly Landlord-Friendly
- State Texas
- 87 Strongly Landlord-Friendly · R+5
- County
- — inherits STATE
- City
- — inherits STATE
ZIP-level market 78418
- Rents YoY
- -0.6%
- Active inventory
- 685
- Price-to-rent
- 4.7×
Monthly cashflow live
- Estimated rent
- $1,330 high interval (Pro) →
- Mortgage (P&I)
- −$393
- Tax from tax record
- −$171 /mo · $2,053/yr
- Insurance
- −$31
- HOA
- −$0
- Vacancy / Maint / Mgmt
- −$279
- Net cashflow
- $455
Break-even live
UW: 25.0% down · 7.5% · 30yr · 1.5% tax · 5.0% vac · 8.0% maint · 8.0% mgmt
Financing live
Cash to close
- Down payment
- $18,750
- Closing costs
- $2,250
- Reserves months
- —
- Total cash needed
- —
Loan-product check · same deal, 3 products live
Conventional
25% down · 7.5% · 30yr
- Down + closing
- —
- Monthly P&I
- —
- Monthly cashflow
- —
- DSCR
- —
- Eligible?
- —
Personal DTI + credit; lowest rate.
DSCR
20% down · 8.5% · 30yr
- Down + closing
- —
- Monthly P&I
- —
- Monthly cashflow
- —
- DSCR
- —
- Eligible?
- —
No personal income docs; deal must DSCR.
Hard money
10% down · 12.0% · 12mo
- Down + closing
- —
- Monthly P&I
- —
- Monthly cashflow
- —
- DSCR
- —
- Eligible?
- —
Short-term bridge; refi at stabilization.
Rent comps 12 comps
| Address | Beds | Baths | Sqft | Rent | $/sqft | DOM | Units | Dist |
|---|---|---|---|---|---|---|---|---|
| 426 Carleta St Unit 3 Corpus Christi, TX | 1.0 | 1.0 | 785 | $1,195 | $1.52 | 21d | 1 | 0.21mi |
| 710 Webb St Corpus Christi, TX | 2.0 | 1.0 | 920 | $1,700 | $1.85 | 13d | 1 | 0.31mi |
| 701 W Lakeside Dr Corpus Christi, TX | 2.0 | 1.0 | 840 | $1,000 | $1.19 | 43d | 1 | 0.33mi |
| 10333 Compton Rd Corpus Christi, TX | 2.0 | 1.0 | 1080 | $975 | $0.90 | 13d | 1 | 0.66mi |
| 1306 Waldron Rd Apt 202 Corpus Christi, TX | 2.0 | 1.0 | 1080 | $1,075 | $1.00 | 43d | 1 | 0.66mi |
| 1302 Waldron Rd Unit 102 Corpus Christi, TX | 2.0 | 1.0 | 1080 | $1,250 | $1.16 | 43d | 1 | 0.67mi |
| 10329 Compton Rd Unit 508 Corpus Christi, TX | 2.0 | 1.0 | 1080 | $975 | $0.90 | 13d | 1 | 0.67mi |
| 1314 Waldron Rd Unit 108 Corpus Christi, TX | 2.0 | 1.0 | 1080 | $975 | $0.90 | 43d | 1 | 0.68mi |
| 1314 Waldron Rd Unit 105 Corpus Christi, TX | 2.0 | 1.0 | 1080 | $1,075 | $1.00 | 13d | 1 | 0.68mi |
| 10305 Compton Rd Unit 705 Corpus Christi, TX | 2.0 | 1.0 | 1080 | $1,125 | $1.04 | 43d | 1 | 0.68mi |
| 1401 Dewitt St Corpus Christi, TX | 3.0 | 2.0 | 1168 | $1,495 | $1.28 | 43d | 1 | 0.69mi |
| 1010 Behmann St Corpus Christi, TX | 1.0–2.0 | 1.0 | 668 | $980 | $1.47 | 13d | 3 | 0.99mi |
Listing history 18 events
-
2026-06-19price $75,000 Active 64 DOM
-
2026-06-18days on market $84,500 Active 64 DOM
-
2026-06-17days on market $84,500 Active 63 DOM
-
2026-06-16days on market $84,500 Active 62 DOM
-
2026-06-15days on market $84,500 Active 61 DOM
-
2026-06-14days on market $84,500 Active 59 DOM
-
2026-06-13days on market $84,500 Active 58 DOM
-
2026-06-10days on market $84,500 Active 56 DOM
-
2026-06-09days on market $84,500 Active 55 DOM
-
2026-06-08days on market $84,500 Active 54 DOM
-
2026-06-07days on market $84,500 Active 53 DOM
-
2026-06-03days on market $84,500 Active 49 DOM
-
2026-06-02days on market $84,500 Active 48 DOM
-
2026-06-01days on market $84,500 Active 47 DOM
-
2026-05-31days on market $84,500 Active 46 DOM
-
2026-05-30days on market $84,500 Active 45 DOM
-
2026-05-05price $84,500 611-char remark
Show marketing remark (611 chars)
Located at 430 Webb in Corpus Christi, this property offers a great opportunity for investors ready to take on a rehab project with upside. The home has solid bones and a workable layout, making it a strong candidate for improvements that can greatly increase its value. The location is a major highlight. Situated near the Naval Air Station and close to everyday amenities, this area supports long-term appeal for resale or rental strategies. With the right updates, this property can be transformed into a standout asset. It’s simply waiting for a rehabber’s vision to bring it back to life.
-
2026-04-15$89,500 Active 611-char remark
Show marketing remark (611 chars)
Located at 430 Webb in Corpus Christi, this property offers a great opportunity for investors ready to take on a rehab project with upside. The home has solid bones and a workable layout, making it a strong candidate for improvements that can greatly increase its value. The location is a major highlight. Situated near the Naval Air Station and close to everyday amenities, this area supports long-term appeal for resale or rental strategies. With the right updates, this property can be transformed into a standout asset. It’s simply waiting for a rehabber’s vision to bring it back to life.
ⓘ Source: listings_history table (triggers on properties + properties_extension) + one-shot
backfill from property_details.listing_events for pre-trigger history.
Tax reassessment forecast TX · Resets to sale price
- Current annual tax
- $2,053 · $171/mo
- Projected year-2 tax
- $2,053 · $171/mo
- Expected delta
- $0/yr ($0/mo · 0.0%)
ⓘ Screening estimate from a state-policy table — verify with the county assessor before closing.
Climate risk First Street
- Flood 4/10 Moderate FEMA zone X (unshaded) · 22% chance over 30 yrs
- Wildfire 1/10 Low
- Heat 10/10 Extreme 7 d/yr ≥108°F today · 29 d/yr by 30 yrs out
- Wind 9/10 Extreme 99% chance of damaging wind over 30 yrs
- Air quality 1/10 Low 0 unhealthy d/yr today · 0 by 30 yrs out
Nearby sold comps map
Loading sold comps map…
Walkable amenities ~0.75 mi
Loading nearby amenities…
Taxation est. · year 1
- Rental income
- $15,957
- − Mortgage interest
- −$4,201
- − Property taxes
- −$2,053
- − Insurance
- −$375
- − Repairs & maintenance
- −$1,277
- − Management
- −$1,277
- − Depreciation
- −$2,182
- Taxable income
- $4,593
- Est. tax owed @ 24.0%
- −$1,102
- After-tax cash flow
- $4,356/yr
For passive investors: Depreciation is non-cash, so a rental often shows a tax loss while cash-flowing — sheltering income. Rental losses are passive: they offset passive income freely, and up to $25,000/yr can offset ordinary (W-2) income if you actively participate and your MAGI is under $100k (phasing out to $0 by $150k); unused losses carry forward. On sale, claimed depreciation is recaptured at up to 25%, and gains may owe capital-gains tax (a 1031 exchange can defer both). Figures are a year-1 estimate at your 24.0% rate — not tax advice; consult a CPA.
Schools (NCES district)
- District
- Flour Bluff ISD
- NCES district ID
- 4819380
- Math proficiency
- 43% ▼ -12.00%
- Reading proficiency
- 51% ▼ -2.00%
- Median HH income
- $57,162
- Composite
- 40.96/100
- National rank
- #3604
- State rank
- #209 of 826 in TX
Livability — Corpus Christi
- Score
- 78/100
- State rank
- #66
- US rank
- #2404
Category grades
Schools grade is shown separately in the Schools card above.
Census & demographics
- Census place
- Corpus Christi, TX
- County
- Nueces County · 296,836 people
- City population
- 296,836
- Metro
- Corpus Christi, TX
- Population (ZIP)
- 29,790
- Household income
- $92,445
- Rent vs Own
- Severe rent burden
- 808.0
Population outlook (Nueces County) Hauer SSP2
- Today (2025)
- 418,037 people
- By 2030
- 447,123 · +7.0%
- By 2040
- 505,911 · +21.0%
- By 2050
- 567,522 · +35.8%
- By 2075
- 729,686 · +74.6%
- By 2100
- 847,087 · +102.6%
Race, ethnicity, and origin ACS 2023
- Neighborhood character
- Majority White (61%)
- Race & ethnicity
- White 61% Hispanic / Latino 29% Two or more races 19% Asian 3% Black 3%
- Hispanic origin (detail)
- Mexican 25%
- Common ancestry
- Romanian 2% Lithuanian 2% Slovak 2%
- Foreign-born
- 7% · Canada, China
- Languages at home
- 83% English-only · Spanish 14% Tagalog/Filipino 2%
Political lean MEDSL · Nueces
- 2024 margin
- R (+11.5) · D 43.8% · R 55.3%
- 2008→2024 swing
- -7.1pp toward R · 2008: -4.4pp · 2024: -11.5pp
- All cycles
- 2024: R+11.5 2020: R+2.9 2016: R+1.5 2012: R+3.2 2008: R+4.4
Not yet ingested
- Civics
- —
Market trends
- HPI YoY
- ▼ -168.81%
- Current HPI
- 193.902
- Rent YoY
- ▼ -0.57%
- Metro
- Corpus Christi, TX
- State GDP YoY
- ▲ 3.95%
- F500 in state
- 110
Industry mix (Fortune 500 HQ in TX)
| Industry | F500 HQs | Revenue |
|---|---|---|
| Energy | 16 | $1,198B |
|
||
| Technology | 5 | $198B |
|
||
| Engineering / Construction | 4 | $72B |
|
||
| Energy Services | 3 | $60B |
|
||
| Utilities | 3 | $41B |
|
||
| Healthcare | 2 | $330B |
|
||
Price history
-5.6% since first listed2 events — show timeline
- 2026-05-05 Price Changed $84,500 MCALLENMLS
- 2026-04-15 Listed $89,500 MCALLENMLS
Property tax history
+7.4%/yrLatest (2025): $2,053 · +3.3% YoY. Source: county tax records.
Cash-flow waterfall
monthlySold comps — $/sqft
last 12 mo · ≤1 miLoading sold comps…