 🏗️ New Construction
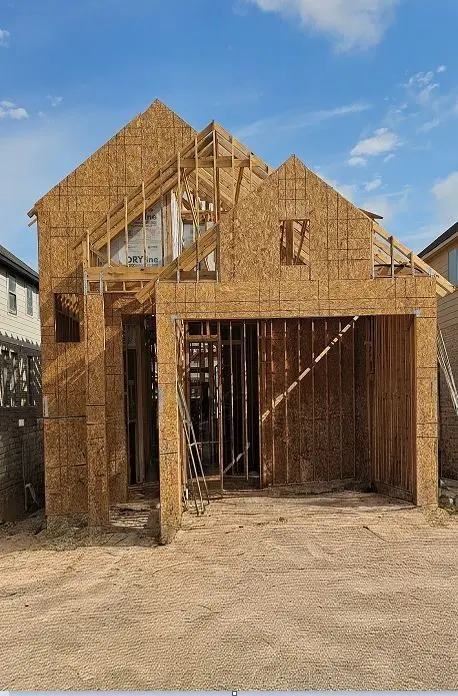
26814 Stardust Mdw · Fulshear, TX
Flood risk No data
- FEMA flood zone
- —
- Chance of flooding over 30 yrs
- —
- Est. flood insurance / yr
- —
Fire risk No data
- Est. fire insurance / yr
- —
Heat risk No data
- Hot days now (above threshold)
- —
- Hot days in 30 yrs
- —
Wind risk No data
- Chance of severe wind over 30 yrs
- —
Air-quality risk No data
- Unhealthy air days now
- —
- Unhealthy air days in 30 yrs
- —
Risk factors via First Street. Map © Google.
Why this score? — see what drove the F grade
The composite is a weighted blend of 9 inputs, each scored 0–100. Each bar is that input's sub-score; the figure is the points it added to the 100-point composite (weight × sub-score).
- ARV discount +7.5/15.0
- Schools +4.6/10.0
- Cash flow +4.3/30.0
- Livability +3.5/5.0
- Condition / age +2.5/5.0
- Rent growth +2.1/5.0
- 1% rule +0.5/10.0
- DSCR +0.0/10.0
- Appreciation +0.0/10.0
$394,990
🖨 Deal sheet 📄 Offer letter ✓ Due diligence
Listing remarks MLS
The Progreso floorplan is a thoughtfully designed two-story home that features four spacious bedrooms and three bathrooms, perfectly suited for growing families or those who love to entertain. The first floor offers an inviting open-concept layout, with the kitchen seamlessly flowing into the family room and casual dining area. A convenient guest suite or flexible room on the main level adds versatility to the layout. Upstairs, the primary suite provides a private retreat with a walk-in closet and a luxurious en suite bathroom, while the additional bedrooms and a shared game room ensure ample space for relaxation or recreation. The two-car garage rounds out the design, providing functionality and style in every corner of this charming home. * Photos and Virtual Tours may be of the same home plan located in a different neighborhood. Features and elevations may vary.
Key facts
- Progreso floor plan
- Versatile game room
- Candela community
Tags
Property features AI
Finance
- HOA & community: Association: Sterling Association Services; Annual association fee of $750
Exterior
- Parking: Attached 2-car garage
- Security: Owned security system
- Utilities: Public water; Public sewer
- Home design: Residential property; Under construction (new construction); Faces south
- Construction: Built in 2026; Brick, cement siding, and stucco exterior; Composition roof; Slab foundation
- Exterior features: Deck; Patio; Private yard; Subdivision lot
Interior
- Kitchen: Dishwasher; Electric oven; Gas cooktop; Garbage disposal; Microwave
- Bedrooms: Primary bedroom on the first floor (14 x 13); Bedroom on the first floor (10 x 10); Bedroom on the second floor (11 x 10); Bedroom on the second floor (11 x 10)
- Flooring: Carpet; Plank; Tile; Vinyl
- Bathrooms: 3 full bathrooms
- Heating & cooling: Central heating (gas); Central electric air conditioning; Programmable thermostat
- Interior features: Breakfast bar; Entrance foyer; Granite counters; Kitchen island; Kitchen/family room combo; Pantry; Separate shower; Tub/shower; Ceiling fan(s); Programmable thermostat; Low emissivity windows; Gas fireplace
- Laundry & utility: Washer hookup; Electric dryer hookup; Gas dryer hookup
Neighborhood map
What this means for you Summary
Snapshot
- This is a 4-bed/3.0-bath single-family listed at $395k.
Deal economics
- At list price, monthly cash flow is $-1k ($-16k/yr) — negative.
- To cash-flow at today's rent, offer at most $308k (22.0% below list).
- To meet the 1% rule (rent ≥ 1% of price), the offer needs to be $278k (29.7% below list).
- Recommended offer: $278k (29.7% below list) — sets the bar for 1% rule.
Location & tenants
- Location reads 69/100 on livability (#430 in TX) — a middle-class / working-renter tenant base. Strengths: schools A+, crime A+, employment A+; Watch: amenities F, commute F, cost of living F.
- Lamar CISD (suburban): math 50% / reading 53% proficiency, ranked #116 of 826 in TX (top 14%) — acceptable for families but not a draw, mixed tenant base, ~2y average lease.
- Market conditions: Rents soft (-1.6%/yr); 1222 active listings in the ZIP; 3 comparable units currently listed for rent nearby; rentals lingering (median 44d on market — plan ~5-8 weeks vacancy on turnover, expect pricing pressure); 67% of comp listings sitting > 30 days — soft ceiling on asking rent; high-income renter base; 12,093 units permitted in Fort Bend County in 2024 (815 in 5+ unit buildings).
Forward outlook
- Local home prices are declining (-3.0%/yr); year-one equity from $3k of loan paydown is wiped out by about $15k of value loss. Plan a longer hold.
- Fort Bend County population projected at +75% by 2050 — long-run rental-demand tailwind backs the buy-and-hold thesis.
Negotiation context
- It's been on market 51 days — a 3% lower offer ($383k) is reasonable based on typical stale-listing flexibility.
- 2 sale attempts with the ask held roughly flat each time — persistent listings suggest the price (not the market) is what's stuck; bring a comps-based counter.
Questions for the listing agent
- What do current leases actually rent for vs. the listed asking? Can we see a recent rent roll and the last 12 months of T-12 income?
- It's been on market 51 days. Have you received any prior offers? Is the seller open to a 30% concession, seller financing, or rate buy-down credit?
- What does the HOA fee cover, when was the last increase, and are there any pending special assessments or reserve-fund shortfalls?
- Is there a deadline driving the sale (1031 exchange, divorce, estate, relocation)? That informs how much negotiation room exists.
- Schools are A-rated — typically a magnet for longer-tenancy family renters. What's the average tenant stay here, and is there a school-zone premium baked into asking?
- The area grade is low — what's the realistic commute time and amenity access for the typical tenant pool here? Any planned neighborhood developments (good or bad) we should know about?
- What's the average days-on-market for RENTAL listings here right now (not sales)? A rising rental-DOM trend means longer vacancies and softer asking-rent achievability than the comps imply.
- What's the recent tenant-quality profile in this submarket — average credit score on applications, eviction rate, late-payment / NSF rate, and stable-employment percentage? A property-management company in the area should have these aggregated.
- How much new for-sale + rental construction is in the pipeline within 1–3 miles? Heavy new supply typically softens prices + rents 12–24 months out; constrained supply supports both.
Investment metrics
- 1% rule
- 0.55% ✗
- Cap rate
- 3.11%
- Cash-on-cash
- -11.37%
- DSCR
- 0.49
- GRM
- 15.0
CMA / ARV
- ARV (median comp)
- $500,400
- List price
- $394,990
- Delta
- -21.07%
- Verdict
- UNDERPRICED
- Comps
- 20 within 1.0 mi
Show comp detail 12 sales within ~0.75 mi
| Address | Dist | Beds/Ba | Sqft | Sold | Price | $/sf | Match |
|---|---|---|---|---|---|---|---|
| 10323 Melida Dawn Way | 0.09mi | 4/3.0 | 2,160 (0%) | 3mo | $380,990 | $176 | 94 |
| 26714 Stardust Meadow Ct | 0.03mi | 4/3.5 | 2,392 (+11%) | 0mo | $458,900 | $192 | 78 |
| 26827 Stardust Meadow Ct | 0.03mi | 4/3.5 | 2,392 (+11%) | 1mo | $453,900 | $190 | 78 |
| 10311 Melida Dawn Way | 0.43mi | 4/3.0 | 2,263 (+5%) | 2mo | $409,990 | $181 | 71 |
| 26718 Concord Dawn Dr | 0.09mi | 4/3.0 | 2,443 (+13%) | 4mo | $479,900 | $196 | 71 |
| 10630 Starfire Yellow Dr | 0.42mi | 4/3.0 | 2,074 (-4%) | 4mo | $421,990 | $203 | 70 |
| 26822 Chandrila Vista Ct | 0.42mi | 3/2.5 (-1) | 2,330 (+8%) | 2mo | $399,900 | $172 | 59 |
| 26419 Polaris Rise Ln | 0.59mi | 4/3.0 | 2,373 (+10%) | 1mo | $415,000 | $175 | 55 |
| 10722 Aquila Star Dr | 0.39mi | 4/3.5 | 2,463 (+14%) | 2mo | $439,520 | $178 | 55 |
| 10803 Aquila Star Dr | 0.40mi | 4/3.5 | 2,463 (+14%) | 2mo | $414,731 | $168 | 54 |
| 26303 Polaris Rise Ln | 0.63mi | 3/3.0 (-1) | 2,336 (+8%) | 1mo | $409,000 | $175 | 51 |
| 10818 Cassiopeia Creek Cir | 0.49mi | 3/2.0 (-1) | 1,896 (-12%) | 0mo | $360,000 | $190 | 47 |
Match score weights: distance 35% · size 25% · config 20% · recency 20%. Top-matched comps best support the ARV.
Projected returns pro-forma
-3.0% appreciation · 0.0% rent growth · sell at horizon
- IRR
- -40.4%
- Equity multiple
- -0.24×
- Total profit
- $-173,724
- Equity at exit
- $74,611
- IRR
- -87.9%
- Equity multiple
- -1.08×
- Total profit
- $-291,302
- Equity at exit
- $43,265
Cash invested: $140,112 (down + closing). Projections, not guarantees.
Landlord ↔ Tenant lean methodology
- Overall (STATE)
- 87 Strongly Landlord-Friendly
- State Texas
- 87 Strongly Landlord-Friendly · R+5
- County
- — inherits STATE
- City
- — inherits STATE
ZIP-level market 77406
- Home prices YoY
- -26.2%
- Rents YoY
- -1.6%
- Active inventory
- 1222
- Price-to-rent
- 11.9×
Monthly cashflow live
- Estimated rent
- $2,776 medium interval (Pro) →
- Mortgage (P&I)
- −$2,624
- Tax est. 1.5%
- −$626 /mo · $7,506/yr
- Insurance
- −$208
- HOA
- −$63
- Vacancy / Maint / Mgmt
- −$583
- Net cashflow
- $-1,328
Break-even live
UW: 25.0% down · 7.5% · 30yr · 1.5% tax · 5.0% vac · 8.0% maint · 8.0% mgmt
Financing live
Cash to close
- Down payment
- $125,100
- Closing costs
- $15,012
- Reserves months
- —
- Total cash needed
- —
Loan-product check · same deal, 3 products live
Conventional
25% down · 7.5% · 30yr
- Down + closing
- —
- Monthly P&I
- —
- Monthly cashflow
- —
- DSCR
- —
- Eligible?
- —
Personal DTI + credit; lowest rate.
DSCR
20% down · 8.5% · 30yr
- Down + closing
- —
- Monthly P&I
- —
- Monthly cashflow
- —
- DSCR
- —
- Eligible?
- —
No personal income docs; deal must DSCR.
Hard money
10% down · 12.0% · 12mo
- Down + closing
- —
- Monthly P&I
- —
- Monthly cashflow
- —
- DSCR
- —
- Eligible?
- —
Short-term bridge; refi at stabilization.
Rent comps 3 comps
| Address | Beds | Baths | Sqft | Rent | $/sqft | DOM | Units | Dist |
|---|---|---|---|---|---|---|---|---|
| 10503 Shinning Dawn Way Richmond, TX | 4.0 | 3.5 | 2523 | $3,399 | $1.35 | 43d | 1 | 0.71mi |
| 25810 Palmdale Estate Dr Richmond, TX | 4.0 | 2.0 | 2008 | $2,350 | $1.17 | 43d | 1 | 1.35mi |
| 26122 Serenity Oaks Dr Richmond, TX | 4.0 | 3.0 | 2438 | $2,386 | $0.98 | 5d | 1 | 1.37mi |
HOA detail
- Monthly dues
- $63 · $756/yr
Listing history 15 events
-
2026-06-18days on market $394,990 Active 51 DOM
-
2026-06-17days on market $394,990 Active 50 DOM
-
2026-06-16days on market $394,990 Active 49 DOM
-
2026-06-15days on market $394,990 Active 48 DOM
-
2026-06-13days on market $394,990 Active 46 DOM
-
2026-06-10days on market $394,990 Active 42 DOM
-
2026-06-08days on market $394,990 Active 41 DOM
-
2026-06-07pricedays on market $394,990 Active 40 DOM
-
2026-06-04days on market $399,990 Active 37 DOM
-
2026-06-03days on market $399,990 Active 36 DOM
-
2026-06-02days on market $399,990 Active 35 DOM
-
2026-06-01days on market $399,990 Active 34 DOM
-
2026-05-31days on market $399,990 Active 33 DOM
-
2026-05-13price $399,990 850-char remark
-
2026-04-28$408,410 Active 850-char remark
ⓘ Source: listings_history table (triggers on properties + properties_extension) + one-shot
backfill from property_details.listing_events for pre-trigger history.
Nearby sold comps map
Loading sold comps map…
Walkable amenities ~0.75 mi
Loading nearby amenities…
Taxation est. · year 1
- Rental income
- $33,313
- − Mortgage interest
- −$28,030
- − Property taxes
- −$7,506
- − Insurance
- −$2,502
- − Repairs & maintenance
- −$2,665
- − Management
- −$2,665
- − HOA
- −$756
- − Depreciation
- −$14,557
- Taxable loss
- −$25,368
- Est. tax savings @ 24.0%
- +$6,088
- After-tax cash flow
- $-9,848/yr
For passive investors: Depreciation is non-cash, so a rental often shows a tax loss while cash-flowing — sheltering income. Rental losses are passive: they offset passive income freely, and up to $25,000/yr can offset ordinary (W-2) income if you actively participate and your MAGI is under $100k (phasing out to $0 by $150k); unused losses carry forward. On sale, claimed depreciation is recaptured at up to 25%, and gains may owe capital-gains tax (a 1031 exchange can defer both). Figures are a year-1 estimate at your 24.0% rate — not tax advice; consult a CPA.
Schools (NCES district)
- District
- Lamar CISD
- NCES district ID
- 4826580
- Math proficiency
- 50% ▼ -12.00%
- Reading proficiency
- 53% ▼ -4.00%
- Median HH income
- $75,213
- Composite
- 46.43/100
- National rank
- #2452
- State rank
- #116 of 826 in TX
Livability — Fulshear
- Score
- 69/100
- State rank
- #430
- US rank
- #8901
Category grades
Schools grade is shown separately in the Schools card above.
Census & demographics
- County
- Fort Bend County · 836,777 people
- City population
- 41,324
- Metro
- Houston-The Woodlands-Sugar Land, TX
- Population (ZIP)
- 69,918
- Household income
- $141,869
- Rent vs Own
- Severe rent burden
- 575.0
Population outlook (Fort Bend County) Hauer SSP2
- Today (2025)
- 1,004,526 people
- By 2030
- 1,153,104 · +14.8%
- By 2040
- 1,453,718 · +44.7%
- By 2050
- 1,753,781 · +74.6%
- By 2075
- 2,455,772 · +144.5%
- By 2100
- 2,930,528 · +191.7%
Race, ethnicity, and origin ACS 2023
- Neighborhood character
- Highly diverse neighborhood (Simpson 0.72)
- Race & ethnicity
- White 43% Hispanic / Latino 26% Two or more races 15% Black 14% Asian 12%
- Hispanic origin (detail)
- Mexican 18% Puerto Rican 1%
- Common ancestry
- Lithuanian 2% Romanian 1% Iranian 1%
- Foreign-born
- 17% · Canada, Vietnam, China
- Languages at home
- 73% English-only · Spanish 14% Other Indo-European 3% Vietnamese 2%
Political lean MEDSL · Fort Bend
- 2024 margin
- Toss-up / Even · D 49.5% · R 47.9% · Other 2.6%
- 2008→2024 swing
- +4.0pp toward D · 2008: -2.4pp · 2024: 1.6pp
- All cycles
- 2024: D+1.6 2020: D+10.6 2016: D+6.6 2012: R+6.8 2008: R+2.4
Not yet ingested
- Civics
- —
Market trends
- HPI YoY
- ▼ -79.18%
- Current HPI
- 222.9525
- Rent YoY
- ▼ -1.61%
- Metro
- Houston-The Woodlands-Sugar Land, TX
- State GDP YoY
- ▲ 3.95%
- F500 in state
- 110
Industry mix (Fortune 500 HQ in TX)
| Industry | F500 HQs | Revenue |
|---|---|---|
| Energy | 16 | $1,198B |
|
||
| Technology | 5 | $198B |
|
||
| Engineering / Construction | 4 | $72B |
|
||
| Energy Services | 3 | $60B |
|
||
| Utilities | 3 | $41B |
|
||
| Healthcare | 2 | $330B |
|
||
Price history
-3.3% since first listed4 events — show timeline
- 2026-06-09 Listed $394,990 Zillow
- 2026-06-04 Price Changed $394,990 HARMLS
- 2026-05-13 Price Changed $399,990 HARMLS
- 2026-04-28 Listed $408,410 HARMLS
Cash-flow waterfall
monthlySold comps — $/sqft
last 12 mo · ≤1 miLoading sold comps…