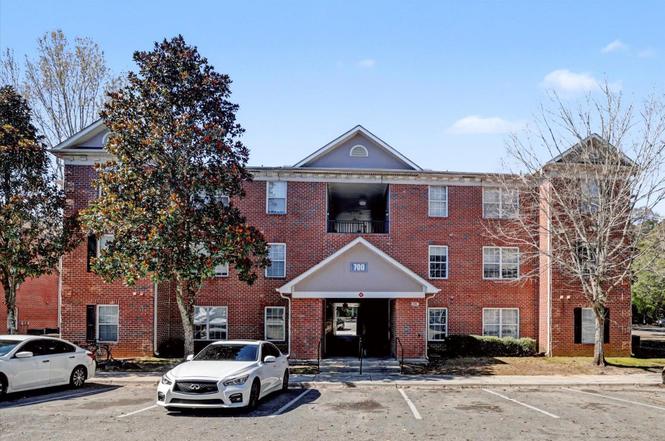
3000 S Adams St #711 · Tallahassee, FL
Flood risk 1/10 · Minimal
- FEMA flood zone
- X (unshaded)
- Chance of flooding over 30 yrs
- 0.0%
- Est. flood insurance / yr
- $507 – $1,088
Fire risk 3/10 · Minor
- Est. fire insurance / yr
- $947 – $1,759
Heat risk 9/10 · Severe
- Hot days now (above 108°F)
- 7 days/yr
- Hot days in 30 yrs
- 21 days/yr
Wind risk 9/10 · Severe
- Chance of severe wind over 30 yrs
- 99.0%
Air-quality risk 4/10 · Minor
- Unhealthy air days now
- 5 days/yr
- Unhealthy air days in 30 yrs
- 6 days/yr
Risk factors via First Street. Map © Google.
Why this score? — see what drove the B+ grade
The composite is a weighted blend of 9 inputs, each scored 0–100. Each bar is that input's sub-score; the figure is the points it added to the 100-point composite (weight × sub-score).
- Cash flow +27.4/30.0
- ARV discount +15.0/15.0
- 1% rule +10.0/10.0
- DSCR +9.6/10.0
- Schools +4.3/10.0
- Livability +4.3/5.0
- Rent growth +3.5/5.0
- Condition / age +2.5/5.0
- Appreciation +0.0/10.0
$111,000
🖨 Deal sheet 📄 Offer letter ✓ Due diligence
Listing remarks MLS
Great location, close to FAMU, this condo has fresh paint, new carpet, new fixtures, move in ready. Call today to view this 3BR/3BA property. Call LA to view NOT FHA/VA approved, No investors for the first 20 days
Key facts
- 1st floor
- En suite baths
- Clubhouse
Tags
Property features AI
Finance
- HOA & community: HOA fee covers common areas, structure maintenance, and pool(s); Association fee (listed)
Exterior
- Parking: Parking space(s)
- Security: Gated community
- Utilities: Public sewer
- Home design: Condominium (unit); Located in a gated community
- Construction: Brick construction
- Exterior features: Community pool; Street lights; Private maintained road
Interior
- Kitchen: Oven; Range; Dishwasher; Disposal; Refrigerator
- Bedrooms: Bedroom 2 (13x11); Bedroom 3 (13x11)
- Flooring: Plank flooring; Vinyl flooring
- Bathrooms: 3 full bathrooms
- Heating & cooling: Electric heating; Central electric cooling
- Interior features: Handicap access
- Laundry & utility: Washer; Dryer
Neighborhood map
What this means for you Summary
Snapshot
- This is a 3-bed/3.0-bath condo listed at $111k.
Deal economics
- At list price, monthly cash flow is $325 ($4k/yr) — positive.
- The deal already cash-flows at list — no discount required.
- Meets the 1% rule at list price ($2k rent vs $111k).
- Recommended offer: $101k (9.0% below list) — sets the bar for market timing.
- Cap rate 9.8% vs local median 4.2% in Tallahassee — top-decile yield for the area; either an underpriced asset or a hidden risk that comps aren't pricing in. Stress-test before assuming the spread holds.
Location & tenants
- Location reads 86/100 on livability (#19 in FL, #429 nationally) — a professional / high-income tenant draw. Strengths: amenities A+, commute A+, health & safety A+; Watch: employment D.
- Leon (urban): math 48% / reading 53% proficiency, ranked #33 of 73 in FL (top 45%) — acceptable for families but not a draw, mixed tenant base, ~2y average lease.
- Market conditions: Rents rising fast (+4.2%/yr); 121 active listings in the ZIP; 19 comparable units currently listed for rent nearby; rentals at typical pace (median 21d on market — plan ~3-4 weeks tenant-placement turnaround); 1,765 units permitted in Leon County in 2024 (975 in 5+ unit buildings).
- This rent runs 41% of the median local income ($51k/yr) — at the standard rent-burdened threshold; future hikes will face affordability resistance.
Forward outlook
- Local home prices are declining (-3.0%/yr); year-one equity from $767 of loan paydown is wiped out by about $3k of value loss. Plan a longer hold.
- Leon County population projected at +23% by 2050 — long-run rental-demand tailwind backs the buy-and-hold thesis.
- At projected returns (-3.0% appreciation + 4.2% rent growth), your $31k cash investment doubles in ~8 years — after that, you're playing with house money.
Negotiation context
- It's been on market 118 days — a 9% lower offer ($101k) is reasonable based on typical stale-listing flexibility.
- 6 sale attempts since 20y ago with the ask held roughly flat each time — persistent listings suggest the price (not the market) is what's stuck; bring a comps-based counter.
- Current owner paid $65k; list at $111k implies a 71% gain — meaningful room to come down on a strong offer.
Risks & watch-outs
- Climate carrying-cost: severe wind risk, 99% chance of damaging wind over 30y; extreme-heat days projected 7→21/yr by 2055 (HVAC capex compounding) — expect insurance premiums to compound above CPI over the hold.
Questions for the listing agent
- It's been on market 118 days. Have you received any prior offers? Is the seller open to a 9% concession, seller financing, or rate buy-down credit?
- What does the HOA fee cover, when was the last increase, and are there any pending special assessments or reserve-fund shortfalls?
- Any open or pending special assessments — roof, HVAC, plumbing, elevator, façade? What's the per-unit balance and payoff schedule, and is the seller paying it off at close or rolling it to the buyer?
- Why hasn't it sold? Are there any deal-killer items the seller is aware of (foundation, flood, title, zoning, code violations)?
- Is there a deadline driving the sale (1031 exchange, divorce, estate, relocation)? That informs how much negotiation room exists.
- Schools are B-rated — typically a magnet for longer-tenancy family renters. What's the average tenant stay here, and is there a school-zone premium baked into asking?
- What's the average days-on-market for RENTAL listings here right now (not sales)? A rising rental-DOM trend means longer vacancies and softer asking-rent achievability than the comps imply.
- What's the recent tenant-quality profile in this submarket — average credit score on applications, eviction rate, late-payment / NSF rate, and stable-employment percentage? A property-management company in the area should have these aggregated.
- How much new apartment / multifamily construction is in the pipeline within 1–3 miles? Heavy new supply (>2% of stock underway) typically softens rents 12–24 months out; light construction supports rent growth.
Investment metrics
- 1% rule
- 1.57% ✓
- Cap rate
- 9.80%
- Cash-on-cash
- 12.53%
- DSCR
- 1.56
- GRM
- 5.3
CMA / ARV
- ARV (on-the-fly)
- $199,712
- Comps found
- 1
Show comp detail 1 sale within ~0.75 mi
| Address | Dist | Beds/Ba | Sqft | Sold | Price | $/sf | Match |
|---|---|---|---|---|---|---|---|
| 2304 S Calhoun St Unit A&B | 0.70mi | 4/2.0 (+1) | 1,200 (-5%) | 14mo | $190,000 | $158 | 38 |
Match score weights: distance 35% · size 25% · config 20% · recency 20%. Top-matched comps best support the ARV.
Projected returns pro-forma
-3.0% appreciation · 4.16% rent growth · sell at horizon
- IRR
- 4.0%
- Equity multiple
- 1.16×
- Total profit
- $4,948
- Equity at exit
- $16,550
- IRR
- 15.0%
- Equity multiple
- 2.30×
- Total profit
- $40,402
- Equity at exit
- $9,597
Cash invested: $31,080 (down + closing). Projections, not guarantees.
Landlord ↔ Tenant lean methodology
- Overall (STATE)
- 87 Strongly Landlord-Friendly
- State Florida
- 87 Strongly Landlord-Friendly · R+3
- County
- — inherits STATE
- City
- — inherits STATE
ZIP-level market 32301
- Rents YoY
- 4.2%
- Active inventory
- 121
- Price-to-rent
- 5.3×
Monthly cashflow live
- Estimated rent
- $1,744 high interval (Pro) →
- Mortgage (P&I)
- −$582
- Tax from tax record
- −$123 /mo · $1,477/yr
- Insurance
- −$46
- HOA
- −$302
- Vacancy / Maint / Mgmt
- −$366
- Net cashflow
- $325
Break-even live
UW: 25.0% down · 7.5% · 30yr · 1.5% tax · 5.0% vac · 8.0% maint · 8.0% mgmt
Financing live
Cash to close
- Down payment
- $27,750
- Closing costs
- $3,330
- Reserves months
- —
- Total cash needed
- —
Loan-product check · same deal, 3 products live
Conventional
25% down · 7.5% · 30yr
- Down + closing
- —
- Monthly P&I
- —
- Monthly cashflow
- —
- DSCR
- —
- Eligible?
- —
Personal DTI + credit; lowest rate.
DSCR
20% down · 8.5% · 30yr
- Down + closing
- —
- Monthly P&I
- —
- Monthly cashflow
- —
- DSCR
- —
- Eligible?
- —
No personal income docs; deal must DSCR.
Hard money
10% down · 12.0% · 12mo
- Down + closing
- —
- Monthly P&I
- —
- Monthly cashflow
- —
- DSCR
- —
- Eligible?
- —
Short-term bridge; refi at stabilization.
Rent comps 19 comps
| Address | Beds | Baths | Sqft | Rent | $/sqft | DOM | Units | Dist |
|---|---|---|---|---|---|---|---|---|
| 3000 S Adams St Tallahassee, FL | 1.0–3.0 | 1.0–3.0 | 884 | $1,850 | $2.09 | 21d | 8 | 0.06mi |
| 509 Famcee Ave Tallahassee, FL | 3.0 | 2.0 | 1079 | $1,700 | $1.58 | 21d | 1 | 0.46mi |
| 3005 S Meridian St Tallahassee, FL | 3.0 | 1.0 | 998 | $2,300 | $2.30 | 21d | 1 | 0.52mi |
| 401 Putnam Dr Tallahassee, FL | 1.0–2.0 | 1.0–2.0 | 766 | $1,250 | $1.63 | 21d | 1 | 0.58mi |
| 3111 Rackley Dr Tallahassee, FL | 4.0 | 2.5 | 1802 | $3,800 | $2.11 | 21d | 1 | 0.75mi |
| 2205 Magnolia Cir Tallahassee, FL | 1.0–2.0 | 1.0–2.0 | 750 | $1,225 | $1.63 | 13d | 9 | 0.78mi |
| 2205 Magnolia Cir Tallahassee, FL | 1.0–2.0 | 1.0–2.0 | 750 | $1,225 | $1.63 | 21d | 1 | 0.78mi |
| 2218 Magnolia Cir Tallahassee, FL | 1.0–2.0 | 1.0–2.0 | 700 | $1,200 | $1.71 | 21d | 7 | 0.79mi |
| 635 Palm Beach St Apt 125 Tallahassee, FL | 2.0 | 2.0 | 900 | $900 | $1.00 | 21d | 1 | 0.88mi |
| 735 Putnam Dr #2 Tallahassee, FL | 3.0 | 2.5 | 1396 | $1,650 | $1.18 | 13d | 1 | 0.91mi |
| 402 Perkins St Tallahassee, FL | 4.0 | 2.0 | 1686 | $1,850 | $1.10 | 21d | 1 | 0.96mi |
| 418 Perkins St Tallahassee, FL | 4.0 | 2.0 | 1497 | $1,850 | $1.24 | 21d | 1 | 0.97mi |
| 301 Gaile Ave Tallahassee, FL | 3.0 | 1.0 | 1009 | $1,400 | $1.39 | 13d | 1 | 0.97mi |
| 3178 N Ridge Rd Apt A Tallahassee, FL | 2.0 | 2.0 | 995 | $1,350 | $1.36 | 13d | 1 | 1.17mi |
| 1504 S Adams St #1 Tallahassee, FL | 2.0 | 2.0 | 1088 | $1,300 | $1.19 | 13d | 1 | 1.27mi |
| 2873 Jim Lee Rd Tallahassee, FL | 2.0 | 2.0 | 1000 | $925 | $0.93 | 21d | 1 | 1.29mi |
| 916 Saddle Creek Run Tallahassee, FL | 4.0 | 2.0 | 1399 | $1,750 | $1.25 | 13d | 1 | 1.48mi |
| 1315 Pinellas St Tallahassee, FL | 3.0 | 3.0 | 1197 | $1,450 | $1.21 | 21d | 1 | 1.48mi |
| 1240 Levy Ave Tallahassee, FL | 3.0 | 1.0 | 1290 | $1,350 | $1.05 | 21d | 1 | 1.48mi |
HOA detail condo
- Monthly dues
- $302 · $3,624/yr
- Assessments
- None detected in remarks — confirm with the listing agent.
Listing history 28 events
-
2026-06-18days on market $111,000 Active 118 DOM
-
2026-06-17days on market $111,000 Active 117 DOM
-
2026-06-16days on market $111,000 Active 116 DOM
-
2026-06-15days on market $111,000 Active 115 DOM
-
2026-06-14days on market $111,000 Active 113 DOM
-
2026-06-10days on market $111,000 Active 110 DOM
-
2026-06-09days on market $111,000 Active 109 DOM
-
2026-06-08days on market $111,000 Active 108 DOM
-
2026-06-07days on market $111,000 Active 107 DOM
-
2026-06-05days on market $111,000 Active 104 DOM
-
2026-06-03days on market $111,000 Active 103 DOM
-
2026-06-02days on market $111,000 Active 102 DOM
-
2026-06-01days on market $111,000 Active 101 DOM
-
2026-05-31days on market $111,000 Active 100 DOM
-
2026-05-30days on market $111,000 Active 99 DOM
-
2026-04-29price $111,000
-
2026-02-20$115,000 Active
-
2025-07-27historical $1,500
-
2025-07-24$1,500
-
2023-08-20historical $1,275
-
2023-08-19$1,275
-
2018-06-12soldstatus $64,900
-
2018-06-11soldstatus $64,900 213-char remark
Show marketing remark (213 chars)
Great location, close to FAMU, this condo has fresh paint, new carpet, new fixtures, move in ready. Call today to view this 3BR/3BA property. Call LA to view NOT FHA/VA approved, No investors for the first 20 days
-
2018-04-27$64,900 213-char remark
Show marketing remark (213 chars)
Great location, close to FAMU, this condo has fresh paint, new carpet, new fixtures, move in ready. Call today to view this 3BR/3BA property. Call LA to view NOT FHA/VA approved, No investors for the first 20 days
-
2013-07-30historical
-
2009-05-01$65,000
-
2006-03-14historical
-
2006-01-04$141,750
ⓘ Source: listings_history table (triggers on properties + properties_extension) + one-shot
backfill from property_details.listing_events for pre-trigger history.
Tax reassessment forecast FL · Resets to sale price
- Current annual tax
- $1,477 · $123/mo
- Projected year-2 tax
- $1,477 · $123/mo
- Expected delta
- $0/yr ($0/mo · 0.0%)
ⓘ Screening estimate from a state-policy table — verify with the county assessor before closing.
Climate risk First Street
- Flood 1/10 Low FEMA zone X (unshaded) · 0% chance over 30 yrs
- Wildfire 3/10 Moderate
- Heat 9/10 Extreme 7 d/yr ≥108°F today · 21 d/yr by 30 yrs out
- Wind 9/10 Extreme 99% chance of damaging wind over 30 yrs
- Air quality 4/10 Moderate 5 unhealthy d/yr today · 6 by 30 yrs out
Nearby sold comps map
Loading sold comps map…
Walkable amenities ~0.75 mi
Loading nearby amenities…
Taxation est. · year 1
- Rental income
- $20,931
- − Mortgage interest
- −$6,218
- − Property taxes
- −$1,477
- − Insurance
- −$555
- − Repairs & maintenance
- −$1,674
- − Management
- −$1,674
- − HOA
- −$3,624
- − Depreciation
- −$3,229
- Taxable income
- $2,480
- Est. tax owed @ 24.0%
- −$595
- After-tax cash flow
- $3,300/yr
For passive investors: Depreciation is non-cash, so a rental often shows a tax loss while cash-flowing — sheltering income. Rental losses are passive: they offset passive income freely, and up to $25,000/yr can offset ordinary (W-2) income if you actively participate and your MAGI is under $100k (phasing out to $0 by $150k); unused losses carry forward. On sale, claimed depreciation is recaptured at up to 25%, and gains may owe capital-gains tax (a 1031 exchange can defer both). Figures are a year-1 estimate at your 24.0% rate — not tax advice; consult a CPA.
Schools (NCES district)
- District
- Leon
- NCES district ID
- 1201110
- Math proficiency
- 48% ▼ -13.00%
- Reading proficiency
- 53% ▼ -5.00%
- Median HH income
- $46,339
- Composite
- 42.84/100
- National rank
- #3131
- State rank
- #33 of 73 in FL
Livability — Tallahassee
- Score
- 86/100
- State rank
- #19
- US rank
- #429
Category grades
Schools grade is shown separately in the Schools card above.
Census & demographics
- Census place
- Tallahassee, FL
- County
- Leon County · 294,472 people
- City population
- 294,472
- Metro
- Tallahassee, FL
- Population (ZIP)
- 32,017
- Household income
- $50,942
- Rent vs Own
- Severe rent burden
- 2625.0
Population outlook (Leon County) Hauer SSP2
- Today (2025)
- 315,507 people
- By 2030
- 330,677 · +4.8%
- By 2040
- 358,465 · +13.6%
- By 2050
- 386,804 · +22.6%
- By 2075
- 465,480 · +47.5%
- By 2100
- 519,959 · +64.8%
Race, ethnicity, and origin ACS 2023
- Neighborhood character
- Diverse neighborhood (Simpson 0.61)
- Race & ethnicity
- Black 49% White 38% Hispanic / Latino 6% Two or more races 6% Asian 3%
- Hispanic origin (detail)
- Puerto Rican 1% Cuban 1%
- Common ancestry
- Slovak 2% Romanian 1% Lithuanian 1%
- Foreign-born
- 7% · Canada, China, Vietnam
- Languages at home
- 91% English-only · Spanish 4% Other Indo-European 1% French/Haitian/Cajun 1%
Political lean MEDSL · Leon
- 2024 margin
- Strong D (+21.8) · D 60.3% · R 38.5% · Other 1.2%
- 2008→2024 swing
- -2.5pp toward R · 2008: 24.3pp · 2024: 21.8pp
- All cycles
- 2024: D+21.8 2020: D+28.3 2016: D+25.1 2012: D+23.6 2008: D+24.3
Not yet ingested
- Civics
- —
Market trends
- HPI YoY
- ▼ -231.50%
- Current HPI
- 231.103
- Rent YoY
- ▲ 4.16%
- Metro
- Tallahassee, FL
- State GDP YoY
- ▲ 3.28%
- F500 in state
- 36
Industry mix (Fortune 500 HQ in FL)
| Industry | F500 HQs | Revenue |
|---|---|---|
| Industrial Technology | 2 | $29B |
|
||
| Insurance | 2 | $17B |
|
||
| Retail | 1 | $60B |
|
||
| Technology Distribution | 1 | $58B |
|
||
| Homebuilding | 1 | $35B |
|
||
| Technology Manufacturing | 1 | $35B |
|
||
Price history
-21.7% since first listed13 events — show timeline
- 2026-04-29 Price Changed $111,000 CATRS
- 2026-02-20 Listed $115,000 CATRS
- 2025-07-27 Rental Removed $1,500 APPFOLIO
- 2025-07-24 Listed for Rent $1,500 APPFOLIO
- 2023-08-20 Rental Removed $1,275 APPFOLIO
- 2023-08-19 Listed for Rent $1,275 APPFOLIO
- 2018-06-12 Sold (Public Records) $64,900 Public Records
- 2018-06-11 Sold (MLS) $64,900 CATRS
- 2018-04-27 Listed $64,900 CATRS
- 2013-07-30 Listing Removed — CATRS
- 2009-05-01 Listed $65,000 CATRS
- 2006-03-14 Listing Removed — CATRS
- 2006-01-04 Listed $141,750 CATRS
Property tax history
+4.5%/yrLatest (2025): $1,477 · +11.6% YoY. Source: county tax records.
Cash-flow waterfall
monthlySold comps — $/sqft
last 12 mo · ≤1 miLoading sold comps…