 🏷️ Likely Rental
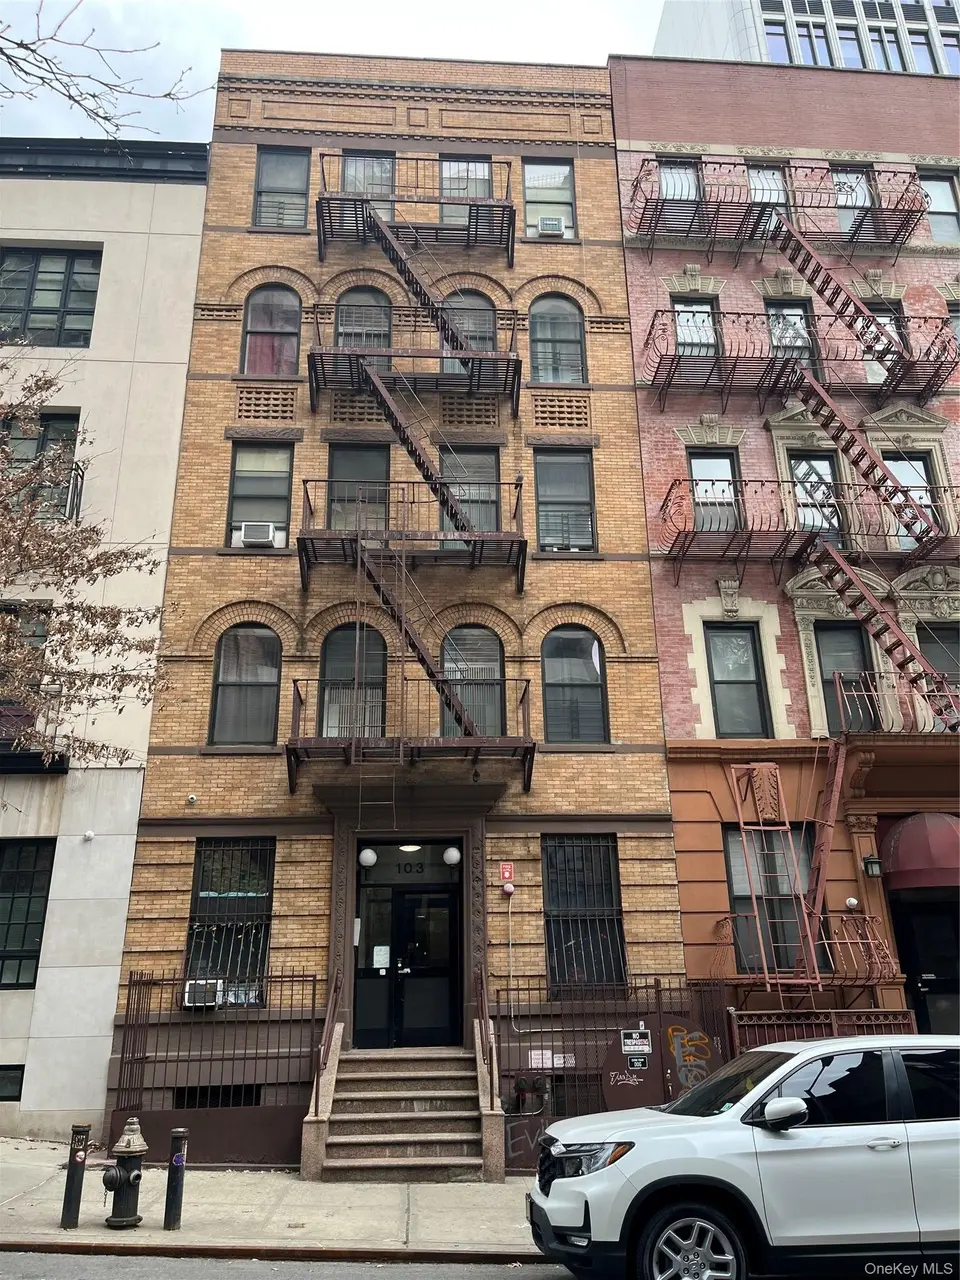
103 E East 97th St Unit 1B · New York, NY
Flood risk No data
- FEMA flood zone
- —
- Chance of flooding over 30 yrs
- —
- Est. flood insurance / yr
- —
Fire risk No data
- Est. fire insurance / yr
- —
Heat risk No data
- Hot days now (above threshold)
- —
- Hot days in 30 yrs
- —
Wind risk No data
- Chance of severe wind over 30 yrs
- —
Air-quality risk No data
- Unhealthy air days now
- —
- Unhealthy air days in 30 yrs
- —
Risk factors via First Street. Map © Google.
Why this score? — see what drove the B- grade
The composite is a weighted blend of 9 inputs, each scored 0–100. Each bar is that input's sub-score; the figure is the points it added to the 100-point composite (weight × sub-score).
- Cash flow +22.7/30.0
- Appreciation +8.2/10.0
- ARV discount +7.5/15.0
- DSCR +7.3/10.0
- 1% rule +5.9/10.0
- Schools +5.0/10.0
- Livability +3.8/5.0
- Rent growth +3.6/5.0
- Condition / age +2.2/5.0
$325,000
🖨 Deal sheet 📄 Offer letter ✓ Due diligence
Listing remarks MLS
WHERE ELSE CAN YOU FIND A RENOVATED TWO BEDROOM, WITH A WASHER DRYER, IN A DOORMAN BUILDING, AROUND THE CORNER FROM CENTRAL PARK, FOR UNDER $900,000.. .. .RIGHT HERE!!!! This renovated two bedroom one and one half bathroom pre-war home boasts an expansive living room with ample space for dining and a built-in desk for a home office area. Renovated, windowed, eat-in kitchen with white cabinets, gray Caesarstone countertops, stainless steel appliances and two pantries make this a great kitchen to sit and enjoy a meal. Additional features include: WASHER/DRYER IN UNIT, hard wood floors, beamed ceilings, heated floors bathroom in both bathrooms. Apartment 1B faces north and south with the northern exposure looking onto tree-lined 97th Street. Apartment comes with additional storage in the basement. 12 East 97th street is a 24 hour doorman building right next to Central Park and 5th Avenue along Museum Mile and 3 blocks from 96th Street Subway. Building amenities include a bike room, laundry room and common storage room. The building is pet friendly and allows co-purchasing and pied-a-terres and offers 75% financing.
Key facts
- Built 1910
- Listed 3 days
Property features AI
Exterior
- Parking: On-street parking
- Utilities: Con Edison electric; Public sewer; Electricity available
- Home design: Stock cooperative
- Construction: Brick construction
- Exterior features: Brick exterior; Not waterfront
Interior
- Kitchen: Range; Refrigerator
- Bedrooms: Entry level: 1
- Bathrooms: 1 full bathroom
- Heating & cooling: Steam heat; Wall/window cooling unit(s)
- Interior features: Open floor plan; Open kitchen; No basement
- Laundry & utility: Pets allowed: contact for details
Neighborhood map
What this means for you Summary
Snapshot
- This is a 1-bed/1.0-bath single-family listed at $325k. Condition is rated fair.
Deal economics
- At list price, monthly cash flow is $560 ($7k/yr) — positive.
- The deal already cash-flows at list — no discount required.
- Meets the 1% rule at list price ($4k rent vs $325k).
- Cap rate 8.4% vs local median 2.6% in New York — top-decile yield for the area; either an underpriced asset or a hidden risk that comps aren't pricing in. Stress-test before assuming the spread holds.
Location & tenants
- Location reads 75/100 on livability (#268 in NY, #4,188 nationally) — a middle-class / working-renter tenant base. Strengths: amenities A+, commute A+, health & safety A; Watch: crime F, cost of living F.
- Market conditions: Rents rising fast (+4.5%/yr); 96 active listings in the ZIP; 40 comparable units currently listed for rent nearby; rentals leasing fast (median 6d on market — plan ~1-2 weeks tenant-placement turnaround); lower-income renter base — watch delinquency; 4,467 units permitted in New York County in 2024 (4,463 in 5+ unit buildings).
- At $3,551/mo this rent would consume 110% of the median local household income ($39k/yr) (locally 8791% of renters already pay >50% of income on rent) — very limited rent-growth headroom before tenants either downsize or default.
Forward outlook
- In year one you build about $23k of equity ($2k loan paydown + $21k appreciation (6.3% local appreciation)).
- New York County population projected at +21% by 2050 — long-run rental-demand tailwind backs the buy-and-hold thesis.
- At projected returns (6.3% appreciation + 4.5% rent growth), your $91k cash investment doubles in ~3 years — after that, you're playing with house money.
- By year 2, paydown + projected appreciation supports a ~$36k cash-out refi (75% LTV) — recoverable capital for the next deal without selling this one.
Negotiation context
- Only 3 days on market — expect competitive offers; lowballing is unlikely to land.
Risks & watch-outs
- Watch-outs: built in 1910 — expect roof / HVAC / electrical / plumbing capex.
Questions for the listing agent
- Have any recent inspections been done? Can we get a copy of the seller's disclosures and any deferred-maintenance estimates?
- Built in 1910 — when were the roof, HVAC, electrical panel, plumbing, and water heater last replaced?
- Is there a deadline driving the sale (1031 exchange, divorce, estate, relocation)? That informs how much negotiation room exists.
- Schools are B-rated — typically a magnet for longer-tenancy family renters. What's the average tenant stay here, and is there a school-zone premium baked into asking?
- Crime grade is F in this area — have there been break-ins, vandalism, or insurance claims at this property in the last 3 years? What carrier currently insures it and at what premium?
- What's the average days-on-market for RENTAL listings here right now (not sales)? A rising rental-DOM trend means longer vacancies and softer asking-rent achievability than the comps imply.
- What's the recent tenant-quality profile in this submarket — average credit score on applications, eviction rate, late-payment / NSF rate, and stable-employment percentage? A property-management company in the area should have these aggregated.
- How much new for-sale + rental construction is in the pipeline within 1–3 miles? Heavy new supply typically softens prices + rents 12–24 months out; constrained supply supports both.
Investment metrics
- 1% rule
- 1.09% ✓
- Cap rate
- 8.36%
- Cash-on-cash
- 7.38%
- DSCR
- 1.33
- GRM
- 7.6
CMA / ARV
- ARV (on-the-fly)
- $740,125
- Comps found
- 1
Show comp detail 1 sale within ~0.75 mi
| Address | Dist | Beds/Ba | Sqft | Sold | Price | $/sf | Match |
|---|---|---|---|---|---|---|---|
| 1760 2nd Ave | 0.58mi | 1/1.5 | 843 (+9%) | 3mo | $805,000 | $955 | 54 |
Match score weights: distance 35% · size 25% · config 20% · recency 20%. Top-matched comps best support the ARV.
Projected returns pro-forma
6.32% appreciation · 4.5% rent growth · sell at horizon
- IRR
- 22.9%
- Equity multiple
- 2.55×
- Total profit
- $141,173
- Equity at exit
- $210,904
- IRR
- 22.2%
- Equity multiple
- 5.37×
- Total profit
- $397,676
- Equity at exit
- $388,291
Cash invested: $91,000 (down + closing). Projections, not guarantees.
Landlord ↔ Tenant lean methodology
- Overall (CITY)
- 0 Strongly Tenant-Friendly
- State New York
- 15 Strongly Tenant-Friendly · D+10
- County
- — inherits STATE
- City New York
- 0 Strongly Tenant-Friendly · D+34
ZIP-level market 10029
- Home prices YoY
- 1.9%
- Rents YoY
- 4.5%
- Active inventory
- 96
- Price-to-rent
- 7.6×
Monthly cashflow live
- Estimated rent
- $3,551 medium interval (Pro) →
- Mortgage (P&I)
- −$1,704
- Tax est. 1.5%
- −$406 /mo · $4,875/yr
- Insurance
- −$135
- HOA
- −$0
- Vacancy / Maint / Mgmt
- −$746
- Net cashflow
- $560
Break-even live
UW: 25.0% down · 7.5% · 30yr · 1.5% tax · 5.0% vac · 8.0% maint · 8.0% mgmt
Financing live
Cash to close
- Down payment
- $81,250
- Closing costs
- $9,750
- Reserves months
- —
- Total cash needed
- —
Loan-product check · same deal, 3 products live
Conventional
25% down · 7.5% · 30yr
- Down + closing
- —
- Monthly P&I
- —
- Monthly cashflow
- —
- DSCR
- —
- Eligible?
- —
Personal DTI + credit; lowest rate.
DSCR
20% down · 8.5% · 30yr
- Down + closing
- —
- Monthly P&I
- —
- Monthly cashflow
- —
- DSCR
- —
- Eligible?
- —
No personal income docs; deal must DSCR.
Hard money
10% down · 12.0% · 12mo
- Down + closing
- —
- Monthly P&I
- —
- Monthly cashflow
- —
- DSCR
- —
- Eligible?
- —
Short-term bridge; refi at stabilization.
Rent comps 40 comps
| Address | Beds | Baths | Sqft | Rent | $/sqft | DOM | Units | Dist |
|---|---|---|---|---|---|---|---|---|
| 1501 Lexington Ave #932 New York, NY | 1.0 | 1.0 | 583 | $5,580 | $9.56 | 3d | 2 | 0.31mi |
| 122 E 102nd St Unit 1021896P New York, NY | 2.0 | 1.0 | 742 | $5,429 | $7.32 | 15d | 1 | 0.33mi |
| 175 E 96th St Unit 1251683P New York, NY | 2.0 | 1.0 | 600 | $5,305 | $8.84 | 2d | 2 | 0.36mi |
| 1635 Lexington Ave Unit 6D New York, NY | 2.0 | 2.0 | 1112 | $6,000 | $5.40 | 24d | 1 | 0.42mi |
| 215 E 96th St Unit 688 New York, NY | 1.0 | 1.0 | 717 | $7,960 | $11.10 | 2d | 1 | 0.44mi |
| 215 E 95th St #1293 New York, NY | 1.0–2.0 | 1.0–1.5 | 740 | $5,520 | $7.46 | 1d | 2 | 0.46mi |
| 1377 Lexington Ave Unit 5CC New York, NY | 2.0 | 1.0 | 796 | $5,100 | $6.41 | 19d | 1 | 0.46mi |
| 160 E 88th St #1332 New York, NY | 1.0 | 1.0 | 560 | $5,670 | $10.12 | 6d | 1 | 0.59mi |
| 420 Central Park W Unit 6K New York, NY | 2.0 | 2.0 | 1060 | $8,000 | $7.55 | 21d | 1 | 0.60mi |
| 200 E 89th St Unit 12G New York, NY | 1.0 | 1.0 | 650 | $5,000 | $7.69 | 17d | 1 | 0.60mi |
| 50 W 97th St #1739 New York, NY | 2.0 | 1.0 | 800 | $6,560 | $8.20 | 6d | 1 | 0.63mi |
| 77 E 110th St Unit 1322508P New York, NY | 2.0 | 1.5 | 990 | $6,360 | $6.42 | 24d | 1 | 0.65mi |
| 345 E 94th St #1470 New York, NY | 2.0 | 1.0–2.0 | 710 | $5,645 | $7.95 | 3d | 3 | 0.66mi |
| 235 E 89th St Unit 1495783P New York, NY | 2.0 | 1.0 | 699 | $7,443 | $10.65 | 20d | 1 | 0.66mi |
| 70 W 95th St New York, NY | 1.0–4.0 | 1.0–2.0 | 1095 | $9,999 | $9.13 | 16d | 1 | 0.68mi |
| 201 E 86th St #298 New York, NY | 1.0–2.0 | 1.0–1.5 | 700 | $7,210 | $10.30 | 3d | 2 | 0.69mi |
| 354 E 91st St #648 New York, NY | 1.0–2.0 | 1.0 | 692 | $5,600 | $8.09 | 1d | 2 | 0.73mi |
| 808 Columbus Ave New York, NY | 2.0 | 1.0–2.0 | 773 | $6,906 | $8.93 | 1d | 31 | 0.74mi |
| 125 E 83rd St Unit 1312101P New York, NY | 1.0 | 1.0 | 839 | $7,470 | $8.90 | 6d | 1 | 0.77mi |
| 244 E 86th St #604 New York, NY | 1.0–2.0 | 1.0–2.0 | 950 | $4,920 | $5.18 | 3d | 2 | 0.78mi |
| 788 Columbus Ave #1323 New York, NY | 1.0–3.0 | 1.0–1.5 | 900 | $3,660 | $4.07 | 24d | 2 | 0.79mi |
| 305 E 86th St New York, NY | 1.0–3.0 | 1.0–2.0 | 820 | $3,270 | $3.99 | 24d | 10 | 0.79mi |
| 315 E 86th St Unit 1327 New York, NY | 1.0 | 2.0 | 726 | $6,460 | $8.90 | 24d | 1 | 0.80mi |
| 134 W 93rd St New York, NY | 1.0 | 1.0 | 763 | $4,700 | $6.16 | 11d | 1 | 0.82mi |
| 160 W 97th St #1101 New York, NY | 2.0 | 1.0 | 850 | $6,050 | $7.12 | 13d | 1 | 0.83mi |
| 600 Columbus Ave Unit 1251680P New York, NY | 1.0–2.0 | 1.0 | 900 | $6,270 | $6.97 | 1d | 2 | 0.84mi |
| 43 W 85th St Unit 1470323P New York, NY | 1.0 | 1.0 | 699 | $6,466 | $9.25 | 5d | 1 | 0.88mi |
| 200 E 82nd St #505 New York, NY | 2.0 | 1.0 | 636 | $6,715 | $10.55 | 1d | 3 | 0.90mi |
| 814 Amsterdam Ave #1019 New York, NY | 1.0–2.0 | 1.0–2.0 | 800 | $4,800 | $6.00 | 24d | 2 | 0.90mi |
| 435 E 86th St Unit 2001 New York, NY | 1.0 | 1.0 | 800 | $5,480 | $6.85 | 24d | 1 | 0.93mi |
| 202 W 102nd St Unit 1053014P New York, NY | 2.0 | 2.0 | 538 | $10,000 | $18.59 | 21d | 1 | 0.93mi |
| 900 Park Ave New York, NY | 1.0–2.0 | 1.5–2.5 | 1200 | $8,000 | $6.67 | 24d | 2 | 0.94mi |
| 189 W 89th St New York, NY | 2.0 | 1.0–2.0 | 716 | $6,414 | $8.95 | 1d | 13 | 0.95mi |
| 501 E 87th St #2094 New York, NY | 1.0 | 1.0 | 618 | $7,890 | $12.77 | 1d | 2 | 0.97mi |
| 1 Morningside Dr New York, NY | 3.0 | 1.0–2.0 | 1655 | $6,310 | $3.81 | 1d | 1 | 0.99mi |
| 212 W 91st St #416 New York, NY | 1.0–2.0 | 1.0–2.0 | 825 | $6,270 | $7.60 | 6d | 2 | 0.99mi |
| 212 W 91st St New York, NY | 1.0–2.0 | 1.0–2.0 | 825 | $4,695 | $5.69 | 3d | 4 | 0.99mi |
| 212 W 91st St New York, NY | 1.0–2.0 | 1.0–2.0 | 825 | $4,725 | $5.73 | 2d | 3 | 0.99mi |
| 255 W 94th St #686 New York, NY | 1.0–2.0 | 1.0–2.0 | 750 | $6,300 | $8.40 | 1d | 2 | 0.99mi |
| 515 E 86th St Unit 589 New York, NY | 1.0 | 1.0 | 695 | $6,070 | $8.73 | 19d | 1 | 1.01mi |
Listing history 6 events
-
2026-06-07statusdays on market $325,000 Pending 3 DOM
-
2026-06-04statusdays on market $325,000 Active 1 DOM
-
2026-06-03days on market $325,000 Coming Soon 5 DOM
-
2026-06-02days on market $325,000 Coming Soon 4 DOM
-
2026-06-01days on market $325,000 Coming Soon 3 DOM
-
2026-05-31days on market $325,000 Coming Soon 2 DOM
ⓘ Source: listings_history table (triggers on properties + properties_extension) + one-shot
backfill from property_details.listing_events for pre-trigger history.
Nearby sold comps map
Loading sold comps map…
Walkable amenities ~0.75 mi
Loading nearby amenities…
Taxation est. · year 1
- Rental income
- $42,618
- − Mortgage interest
- −$18,205
- − Property taxes
- −$4,875
- − Insurance
- −$1,625
- − Repairs & maintenance
- −$3,409
- − Management
- −$3,409
- − Depreciation
- −$9,455
- Taxable income
- $1,639
- Est. tax owed @ 24.0%
- −$393
- After-tax cash flow
- $6,322/yr
For passive investors: Depreciation is non-cash, so a rental often shows a tax loss while cash-flowing — sheltering income. Rental losses are passive: they offset passive income freely, and up to $25,000/yr can offset ordinary (W-2) income if you actively participate and your MAGI is under $100k (phasing out to $0 by $150k); unused losses carry forward. On sale, claimed depreciation is recaptured at up to 25%, and gains may owe capital-gains tax (a 1031 exchange can defer both). Figures are a year-1 estimate at your 24.0% rate — not tax advice; consult a CPA.
Condition & rehab AI · 8 photos
This property requires moderate renovations to its kitchen, bathroom, and exterior. Upgrading these areas will significantly enhance its resale and rental value.
Repairs flagged
- Moderate Kitchen Countertops — The countertops appear dated and need updating.
- Moderate Bathroom Fixtures — The bathroom fixtures look worn and could benefit from replacement.
- Moderate Exterior Paint — The exterior paint appears faded and could be refreshed.
Value-add opportunities
- Resale New kitchen countertops — Modern countertops will enhance the kitchen's appeal and functionality.
- Resale New bathroom fixtures — Upgraded fixtures will improve the bathroom's functionality and appearance.
- Resale Fresh exterior paint — A fresh coat of paint will improve the home's curb appeal and value.
Renovation cost estimate screening
| Repair item | Severity | Est. cost |
|---|---|---|
| Kitchen Countertops · The countertops appear dated and need updating. | Moderate | $3,000–15,000 |
| Bathroom Fixtures · The bathroom fixtures look worn and could benefit from replacement. | Moderate | $3,000–15,000 |
| Exterior Paint · The exterior paint appears faded and could be refreshed. | Moderate | $3,000–15,000 |
| Total estimated repair cost · 3 items | $9,000–45,000 |
Value-add ROI direction
- Resale New kitchen countertops — Modern countertops will enhance the kitchen's appeal and functionality. ↑
- Resale New bathroom fixtures — Upgraded fixtures will improve the bathroom's functionality and appearance. ↑
- Resale Fresh exterior paint — A fresh coat of paint will improve the home's curb appeal and value. ↑
ⓘ Cost ranges are severity-bucket heuristics (US national rule-of-thumb). Get contractor quotes + a written scope before underwriting a rehab budget.
Schools (NCES district)
No district data.
Livability — New York
- Score
- 75/100
- State rank
- #268
- US rank
- #4188
Category grades
Schools grade is shown separately in the Schools card above.
Census & demographics
- Census place
- New York, NY
- County
- New York County · 1,599,927 people
- City population
- 7,731,280
- Metro
- New York-Newark-Jersey City, NY-NJ-PA
- Population (ZIP)
- 77,447
- Household income
- $38,695
- Rent vs Own
- Severe rent burden
- 8791.0
Population outlook (New York County) Hauer SSP2
- Today (2025)
- 1,825,725 people
- By 2030
- 1,904,611 · +4.3%
- By 2040
- 2,052,719 · +12.4%
- By 2050
- 2,206,601 · +20.9%
- By 2075
- 2,509,427 · +37.4%
- By 2100
- 2,702,933 · +48.0%
Race, ethnicity, and origin ACS 2023
- Neighborhood character
- Highly diverse neighborhood (Simpson 0.71)
- Race & ethnicity
- Hispanic / Latino 42% Black 28% White 14% Two or more races 12% Asian 12%
- Hispanic origin (detail)
- Mexican 6% Puerto Rican 19% Dominican 10%
- Common ancestry
- Romanian 2% Scotch-Irish 1% Lithuanian 0%
- Foreign-born
- 26% · Canada, China, South Korea
- Languages at home
- 50% English-only · Spanish 33% Chinese 7% Other Indo-European 3%
Political lean MEDSL · New York
- 2024 margin
- Solid D (+64.8) · D 82.4% · R 17.6%
- 2008→2024 swing
- -7.4pp toward R · 2008: 72.2pp · 2024: 64.8pp
- All cycles
- 2024: D+64.8 2020: D+74.5 2016: D+77.2 2012: D+69.6 2008: D+72.2
Not yet ingested
- Civics
- —
Market trends
- HPI YoY
- ▲ 6.32%
- Current HPI
- 333.4025
- Rent YoY
- ▲ 4.50%
- Metro
- New York-Newark-Jersey City, NY-NJ-PA
- State GDP YoY
- ▲ 2.60%
- F500 in state
- 92
Industry mix (Fortune 500 HQ in NY)
| Industry | F500 HQs | Revenue |
|---|---|---|
| Financial Services | 10 | $950B |
|
||
| Consumer Goods | 9 | $162B |
|
||
| Insurance | 4 | $225B |
|
||
| Telecommunications | 2 | $144B |
|
||
| Pharmaceuticals | 2 | $112B |
|
||
| Media / Entertainment | 2 | $69B |
|
||
Price history
-56.7% since first listed4 events — show timeline
- 2026-05-30 Coming Soon $325,000 OneKey® MLS as Distributed by MLS Grid
- 2024-02-03 Price Changed $699,000 RLS at REBNY
- 2022-01-04 Sold (MLS) $975,000 RLS at REBNY
- 2021-05-13 Listed $750,000 RLS at REBNY
Cash-flow waterfall
monthlySold comps — $/sqft
last 12 mo · ≤1 miLoading sold comps…